| Param | Original file | Final file |
|---|---|---|
| Filename | modeM0/AS1G07_076T04_9000001172_08386cztM0_level2.evt | modeM0/AS1G07_076T04_9000001172_08386cztM0_level2_quad_clean.evt |
| Size (bytes) | 85,766,400 | 23,739,840 |
| Size | 81.8 MB | 22.6 MB |
| Events in quadrant A | 606,321 | 157,259 |
| Events in quadrant B | 648,524 | 159,151 |
| Events in quadrant C | 601,415 | 153,547 |
| Events in quadrant D | 648,139 | 149,566 |
| Mode SS | |||
|---|---|---|---|
| Quadrant | BADHDUFLAG | Total packets | Discarded packets |
| A | 0 | 28 | 0 |
| B | 0 | 28 | 0 |
| C | 0 | 28 | 0 |
| D | 0 | 28 | 0 |
| Mode M0 | |||
|---|---|---|---|
| Quadrant | BADHDUFLAG | Total packets | Discarded packets |
| A | 0 | 2637 | 0 |
| B | 0 | 2740 | 0 |
| C | 0 | 2634 | 0 |
| D | 0 | 2767 | 0 |
| Quadrant | Total seconds | Saturated seconds | Saturation percentage |
|---|---|---|---|
| A | 1316 | 2 | 0.151976% |
| B | 1316 | 6 | 0.455927% |
| C | 1316 | 0 | 0.000000% |
| D | 1316 | 6 | 0.455927% |
Noise dominated data is calculated using 1-second bins in cleaned event files. If a bin has >2000 counts, and if more than 50% of those come from <1% of pixels, then it is considered to be noise-dominated and hence unusable.
| Quadrant | # 1 sec bins | Bins with >0 counts | Bins with >2000 counts | High rate bins dominated by noise | Noise dominated (total time) | Noise dominated (detector-on time) | Marked lightcurve |
|---|---|---|---|---|---|---|---|
| A | 1316 | 1316 | 0 | 0 | 0.00% | 0.00% | 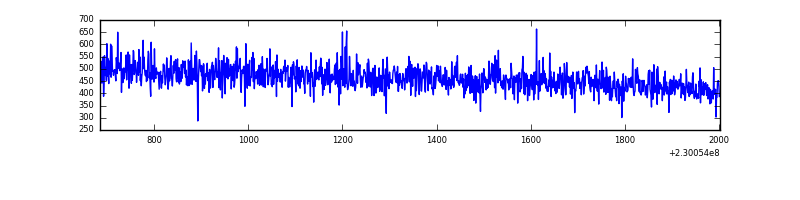 |
| B | 1316 | 1316 | 2 | 2 | 0.15% | 0.15% | 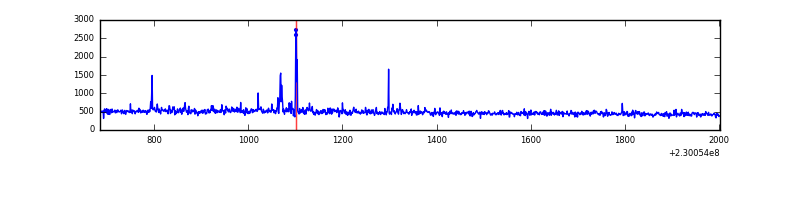 |
| C | 1316 | 1316 | 0 | 0 | 0.00% | 0.00% |  |
| D | 1316 | 1316 | 2 | 2 | 0.15% | 0.15% | 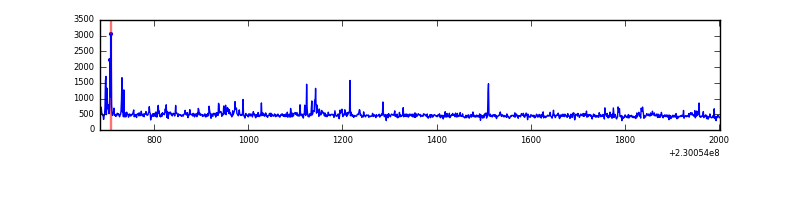 |
Top three noisy pixels from each quadrant. If the there are fewer than three noisy pixels in the level2.evt file, extra rows are filled as -1
| Pixel properties | Quadrant properties | ||||||
|---|---|---|---|---|---|---|---|
| Quadrant | DetID | PixID | Counts | Sigma | Mean | Median | Sigma |
| A | 0 | 226 | 1571 | 41.72 | 157 | 153 | 34.0 |
| A | 12 | 194 | 1454 | 38.27 | 157 | 153 | 34.0 |
| A | 3 | 137 | 637 | 14.24 | 157 | 153 | 34.0 |
| B | 0 | 214 | 33306 | 1031.17 | 156 | 152 | 32.2 |
| B | 4 | 48 | 5110 | 154.21 | 156 | 152 | 32.2 |
| B | 12 | 111 | 3157 | 93.46 | 156 | 152 | 32.2 |
| C | 8 | 128 | 2826 | 71.76 | 152 | 153 | 37.2 |
| C | 8 | 112 | 1472 | 35.41 | 152 | 153 | 37.2 |
| C | 13 | 61 | 1191 | 27.87 | 152 | 153 | 37.2 |
| D | 1 | 52 | 28263 | 650.56 | 154 | 150 | 43.2 |
| D | 12 | 233 | 19811 | 454.97 | 154 | 150 | 43.2 |
| D | 7 | 71 | 5584 | 125.75 | 154 | 150 | 43.2 |
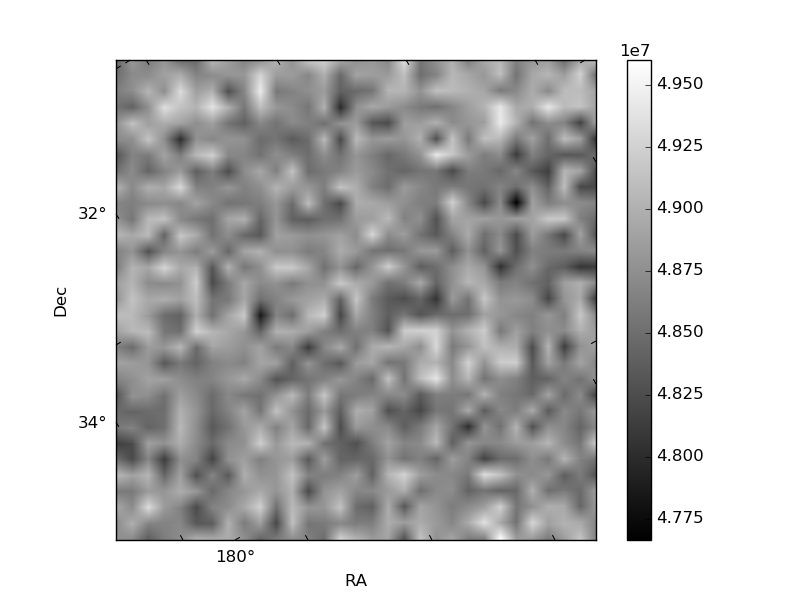
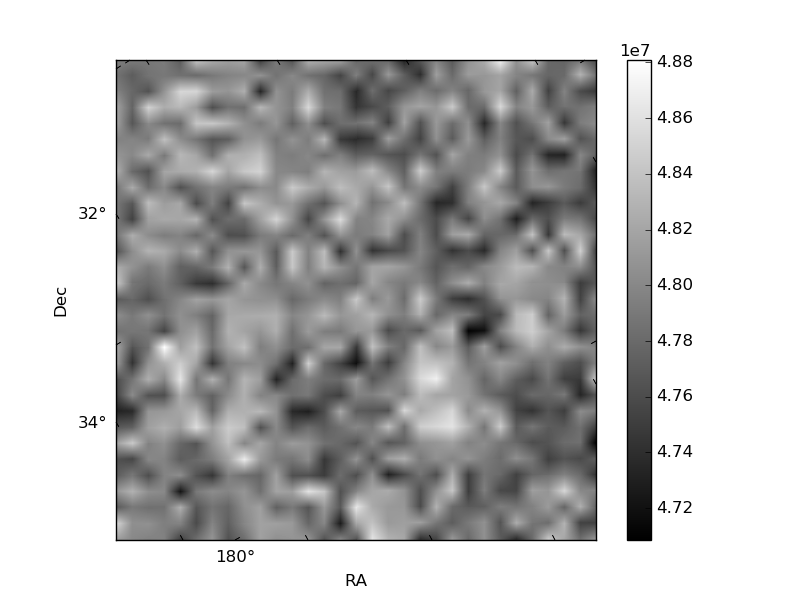
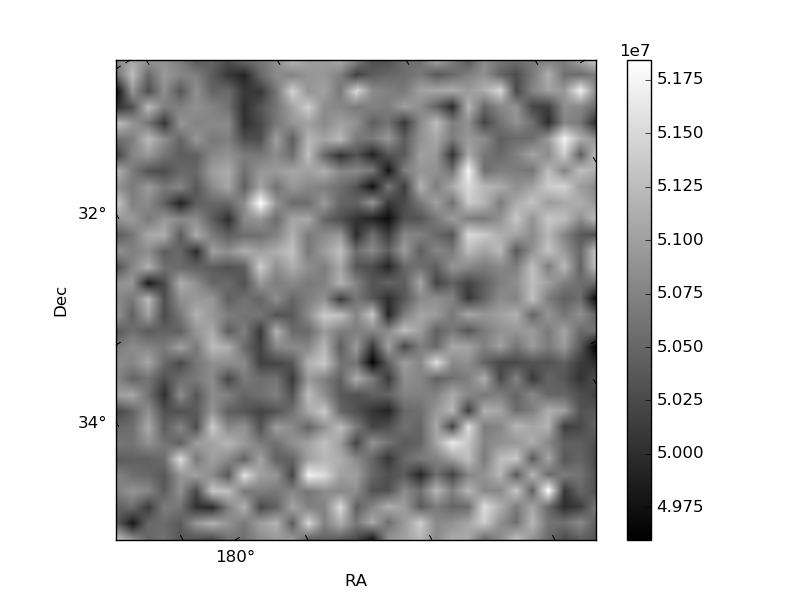
Histogram calculated using DETX and DETY for each event in the final _common_clean file
| Quadrant A |  |
 |
Quadrant B |
|---|---|---|---|
| Quadrant D | 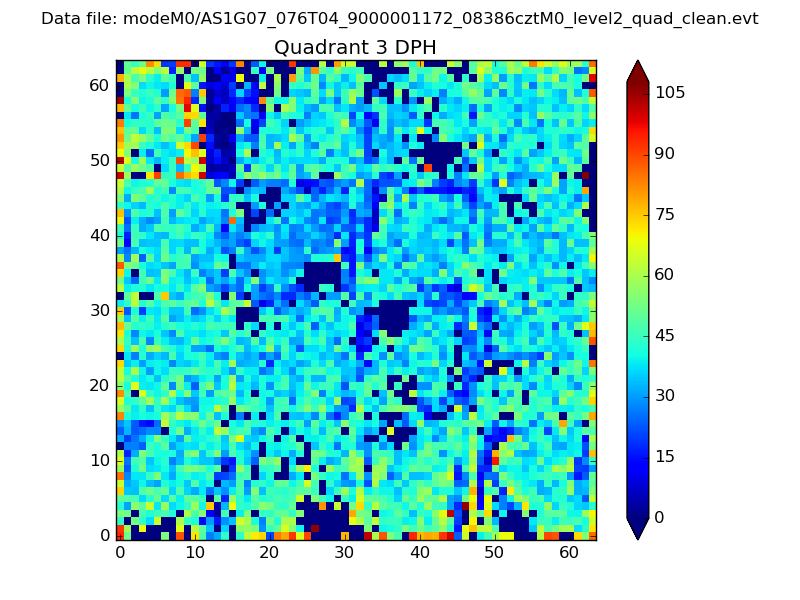 |
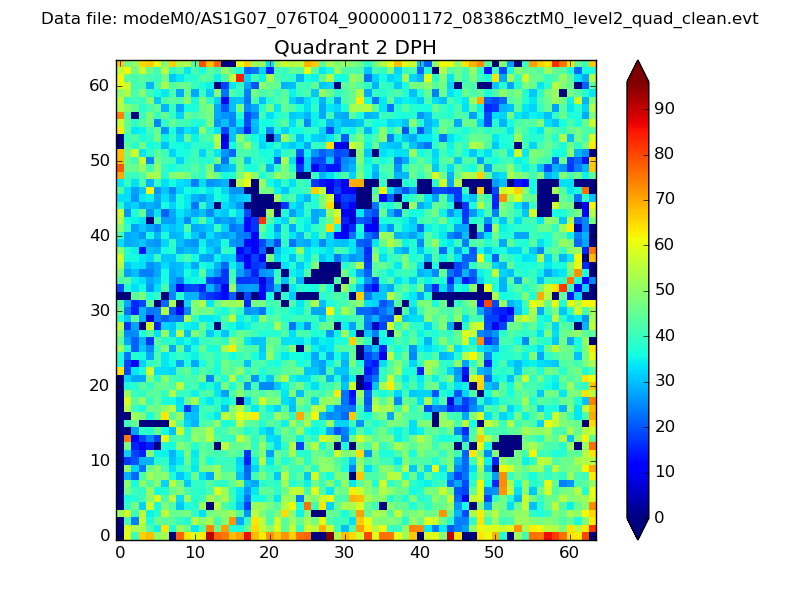 |
Quadrant C |
| Plot type | Count rate plots | Images |
|---|---|---|
| Comparison with Poisson distribution Blue bars denote a histogram of data divided into 1 sec bins. Red curve is a Poisson curve with rate = median count rate of data. |
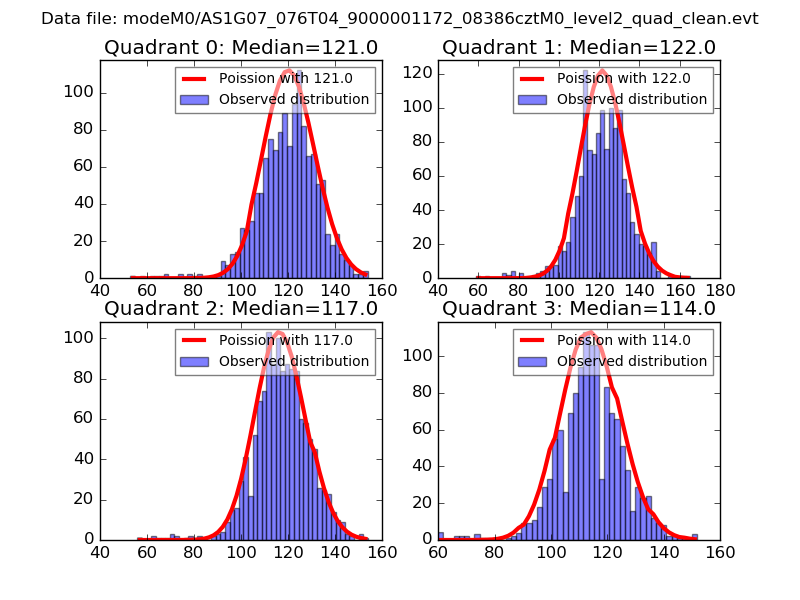 |
 |
| Quadrant-wise count rates Data is divided into 100 sec bins |
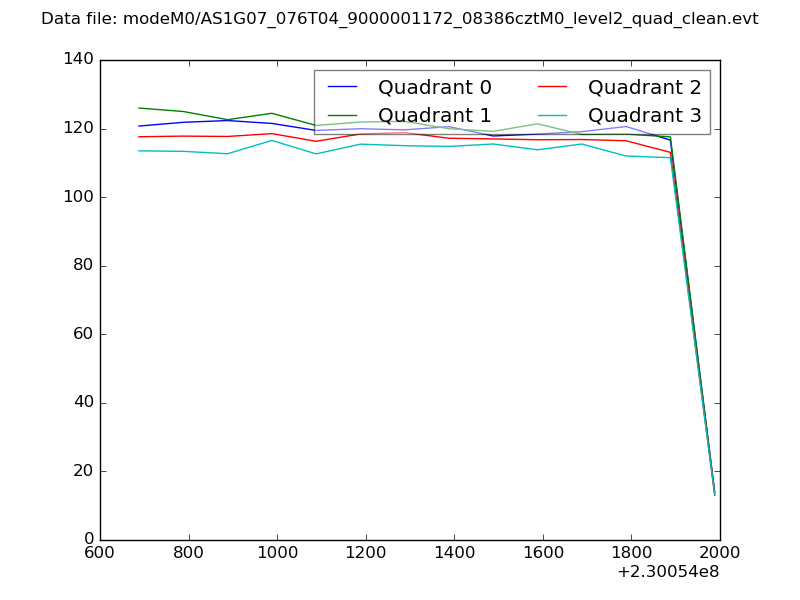 |
|
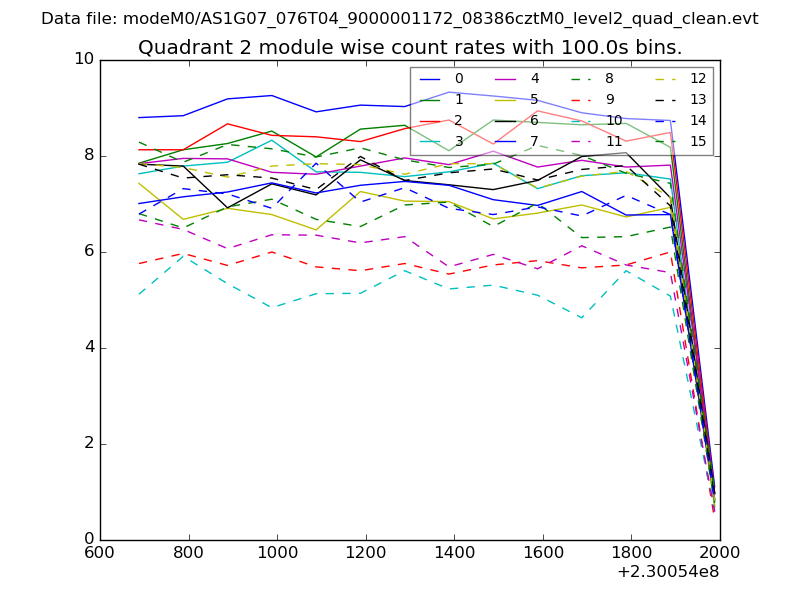
| Module-wise count rates for Quadrant A Data is divided into 100 sec bins |
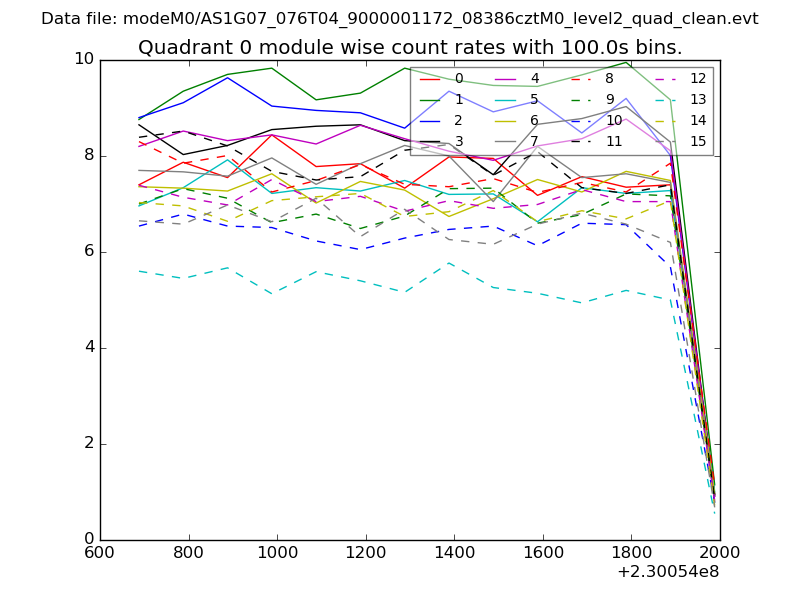 |
 |
| Module-wise count rates for Quadrant B Data is divided into 100 sec bins |
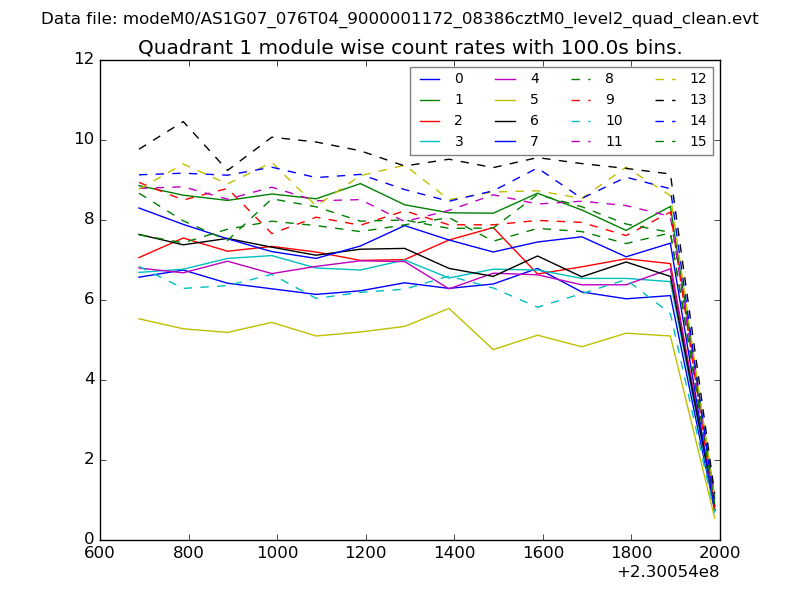 |
 |
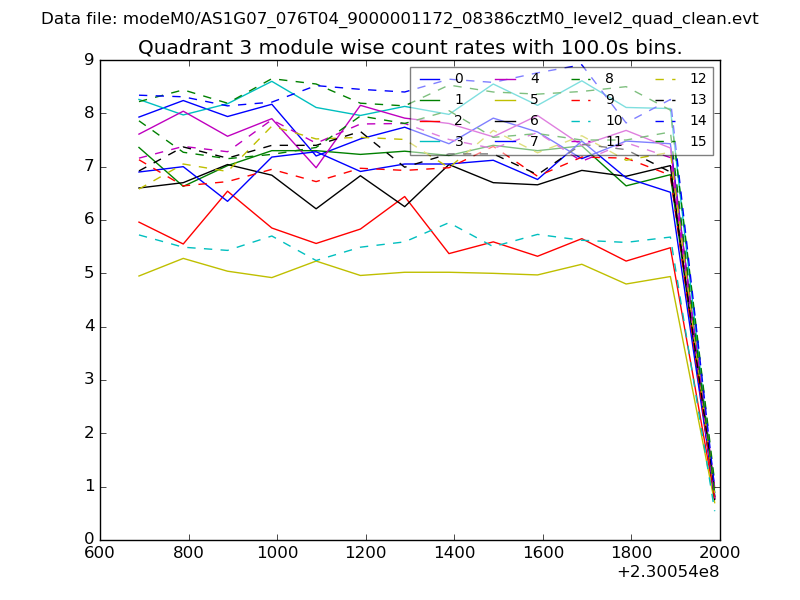
| Module-wise count rates for Quadrant C Data is divided into 100 sec bins |
 |
 |
| Module-wise count rates for Quadrant D Data is divided into 100 sec bins |
 |
 |
| Parameter | Plot |
|---|---|
| CZT HV Monitor | 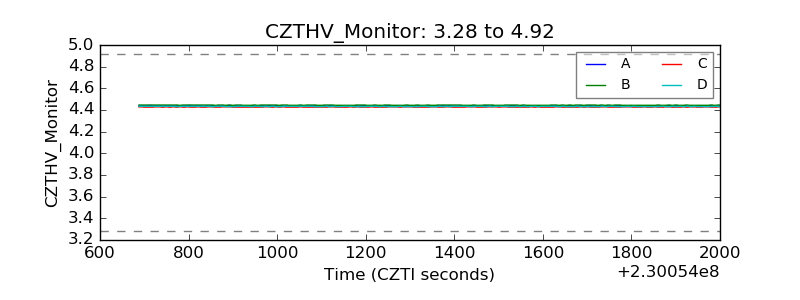 |
| D_VDD | 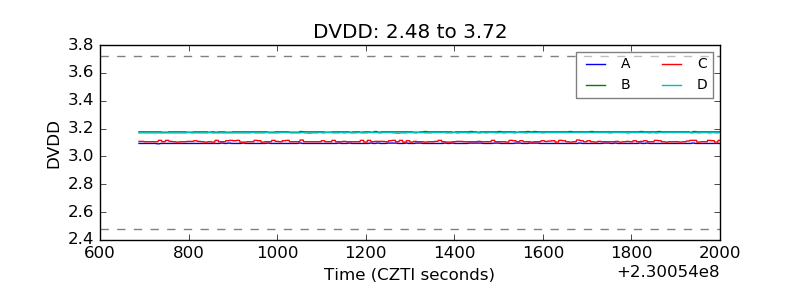 |
| Temperature 1 | 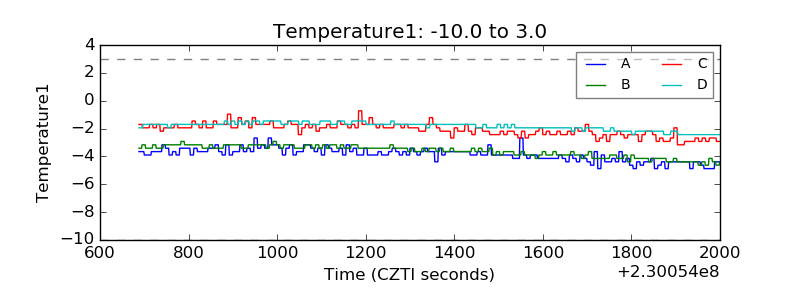 |
| Veto HV Monitor | 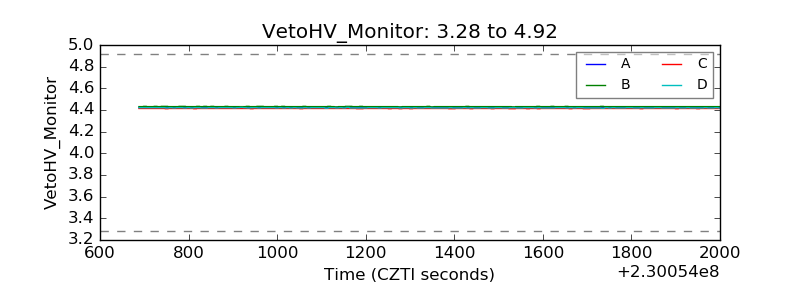 |
| Veto LLD | 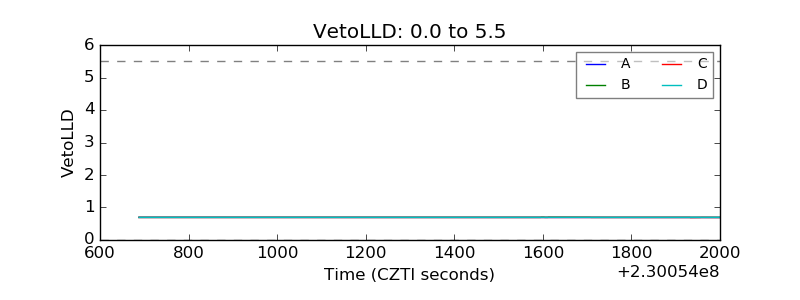 |
| Alpha Counter | 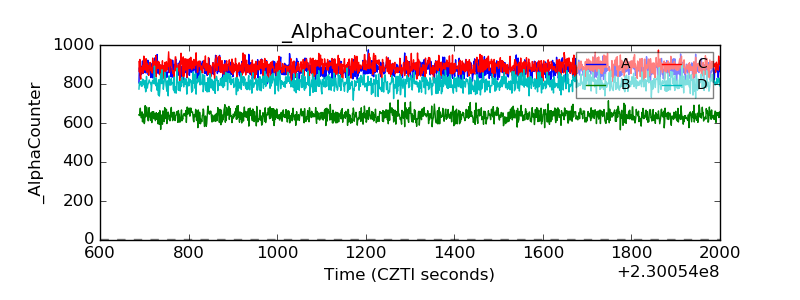 |
| _CPM_Rate | 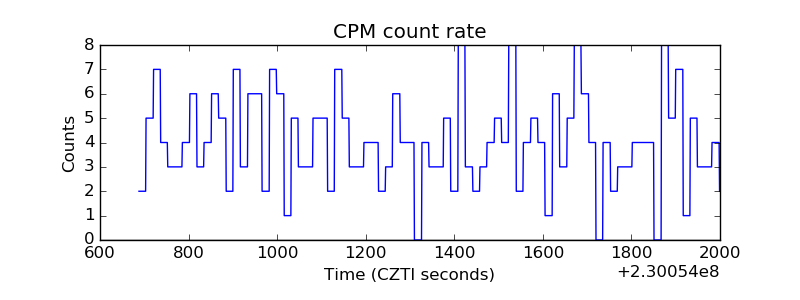 |
| CZT Counter | 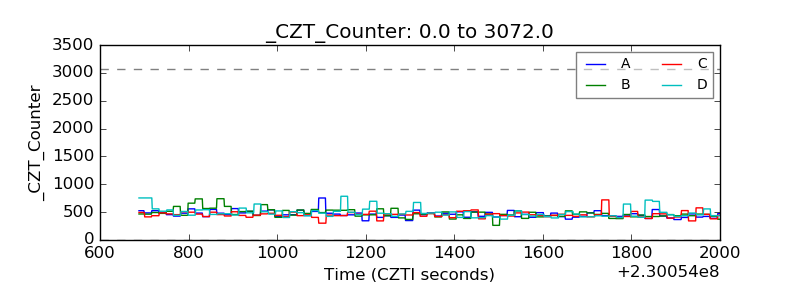 |
| +2.5 Volts monitor |  |
| +5 Volts monitor |  |
| _ROLL_ROT | 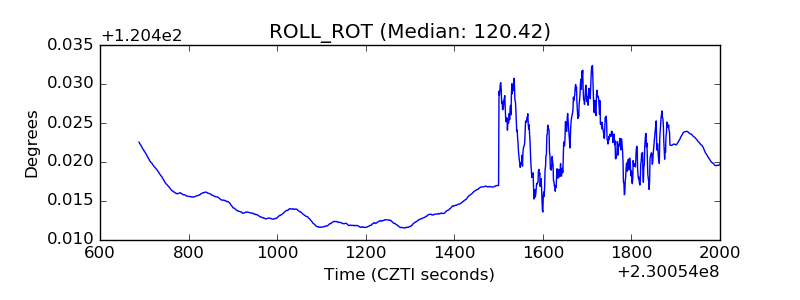 |
| _Roll_DEC | 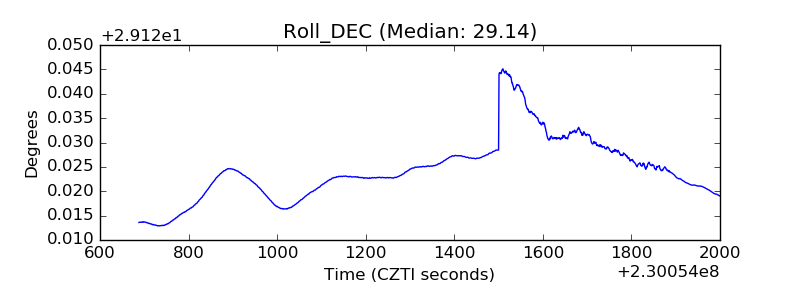 |
| _Roll_RA | 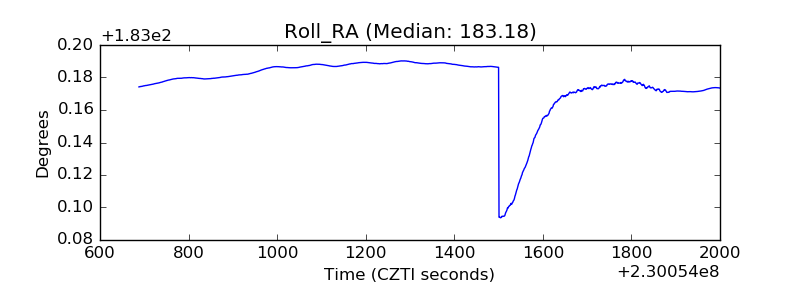 |
| Veto Counter | 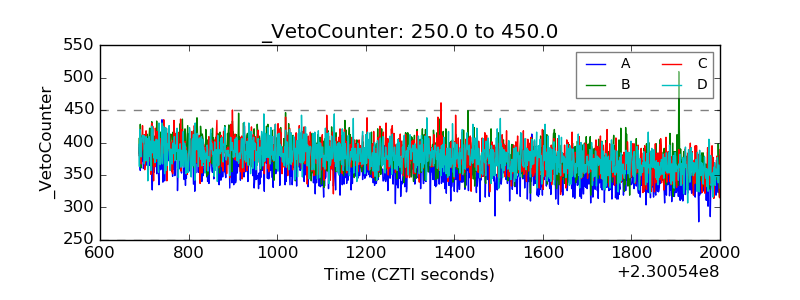 |