| Param | Original file | Final file |
|---|---|---|
| Filename | modeM0/AS1G07_084T03_9000001174cztM0_level2.fits | modeM0/AS1G07_084T03_9000001174cztM0_level2_quad_clean.evt |
| Size (bytes) | 191,430,720 | 264,447,360 |
| Size | 182.6 MB | 252.2 MB |
| Events in quadrant A | 1,133,678 | 1,676,569 |
| Events in quadrant B | 1,099,090 | 1,695,628 |
| Events in quadrant C | 1,121,596 | 1,644,850 |
| Events in quadrant D | 972,820 | 1,521,668 |
| Mode SS | |||
|---|---|---|---|
| Quadrant | BADHDUFLAG | Total packets | Discarded packets |
| A | 0 | 434 | 0 |
| B | 0 | 434 | 0 |
| C | 0 | 434 | 0 |
| D | 0 | 434 | 0 |
| Mode M0 | |||
|---|---|---|---|
| Quadrant | BADHDUFLAG | Total packets | Discarded packets |
| A | 0 | 43710 | 0 |
| B | 0 | 44102 | 0 |
| C | 0 | 43430 | 0 |
| D | 0 | 46624 | 0 |
| Mode M9 | |||
|---|---|---|---|
| Quadrant | BADHDUFLAG | Total packets | Discarded packets |
| A | 0 | 25 | 0 |
| B | 0 | 25 | 0 |
| C | 0 | 25 | 0 |
| D | 0 | 25 | 0 |
| Quadrant | Total seconds | Saturated seconds | Saturation percentage |
|---|---|---|---|
| A | 21365 | 126 | 0.589750% |
| B | 21365 | 124 | 0.580388% |
| C | 21365 | 86 | 0.402527% |
| D | 21365 | 199 | 0.931430% |
Noise dominated data is calculated using 1-second bins in cleaned event files. If a bin has >2000 counts, and if more than 50% of those come from <1% of pixels, then it is considered to be noise-dominated and hence unusable.
| Quadrant | # 1 sec bins | Bins with >0 counts | Bins with >2000 counts | High rate bins dominated by noise | Noise dominated (total time) | Noise dominated (detector-on time) | Marked lightcurve |
|---|---|---|---|---|---|---|---|
| A | 23875 | 21365 | 0 | 0 | 0.00% | 0.00% |  |
| B | 23875 | 21365 | 0 | 0 | 0.00% | 0.00% |  |
| C | 23875 | 21365 | 0 | 0 | 0.00% | 0.00% |  |
| D | 23875 | 21365 | 0 | 0 | 0.00% | 0.00% |  |
Top three noisy pixels from each quadrant. If the there are fewer than three noisy pixels in the level2.evt file, extra rows are filled as -1
| Pixel properties | Quadrant properties | ||||||
|---|---|---|---|---|---|---|---|
| Quadrant | DetID | PixID | Counts | Sigma | Mean | Median | Sigma |
| A | 14 | 188 | 1149 | 11.58 | 293 | 274 | 75.5 |
| A | 0 | 29 | 1087 | 10.76 | 293 | 274 | 75.5 |
| A | 7 | 110 | 940 | 8.82 | 293 | 274 | 75.5 |
| B | 2 | 9 | 966 | 11.28 | 290 | 276 | 61.2 |
| B | 14 | 254 | 759 | 7.89 | 290 | 276 | 61.2 |
| B | 2 | 8 | 738 | 7.55 | 290 | 276 | 61.2 |
| C | 1 | 80 | 824 | 6.91 | 295 | 273 | 79.7 |
| C | 12 | 241 | 821 | 6.87 | 295 | 273 | 79.7 |
| C | 1 | 81 | 814 | 6.78 | 295 | 273 | 79.7 |
| D | 1 | 19 | 741 | 6.43 | 276 | 251 | 76.2 |
| D | 3 | 14 | 722 | 6.18 | 276 | 251 | 76.2 |
| D | 6 | 231 | 716 | 6.1 | 276 | 251 | 76.2 |
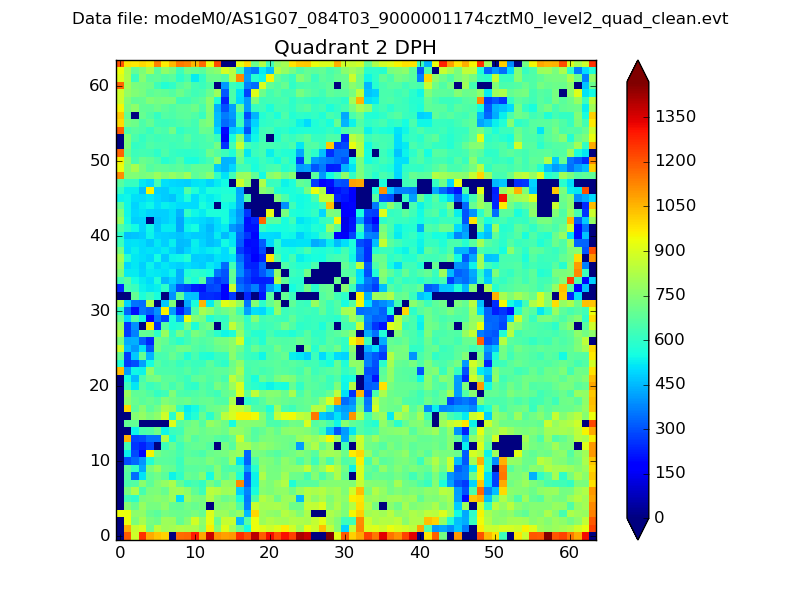
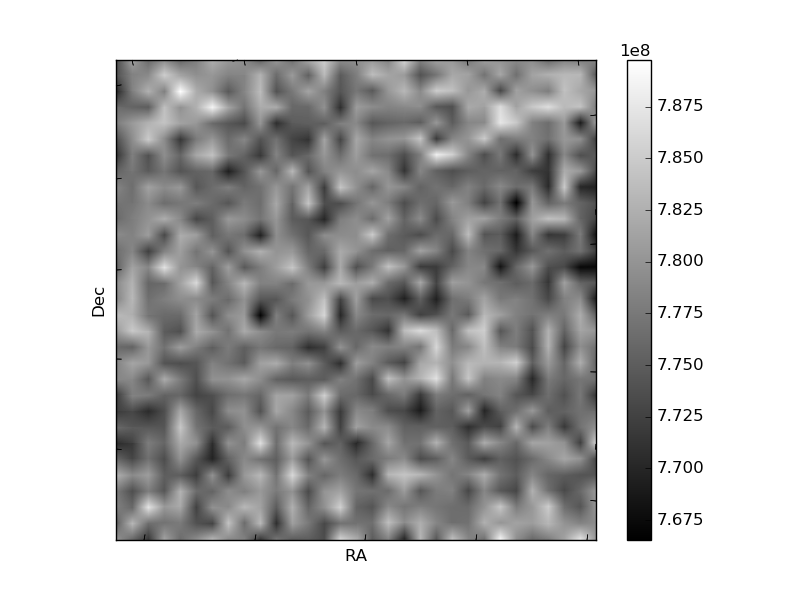
Histogram calculated using DETX and DETY for each event in the final _common_clean file
| Quadrant A | 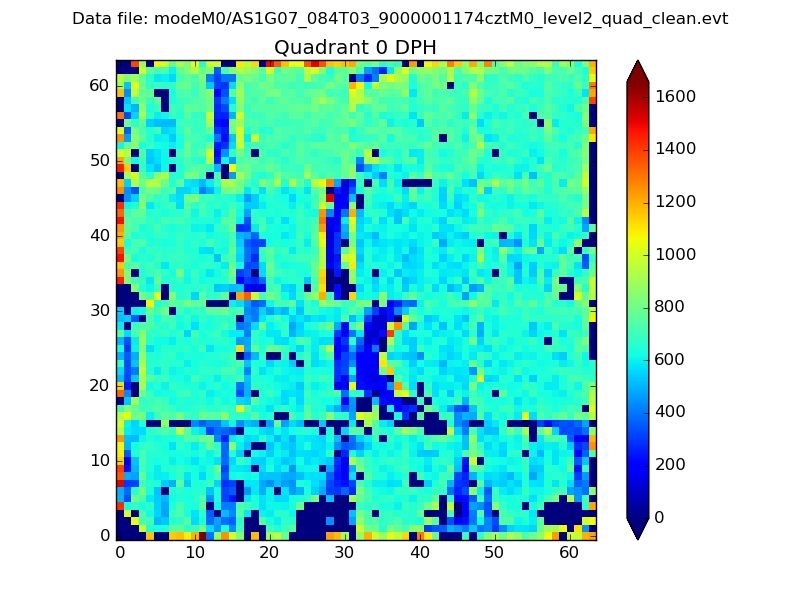 |
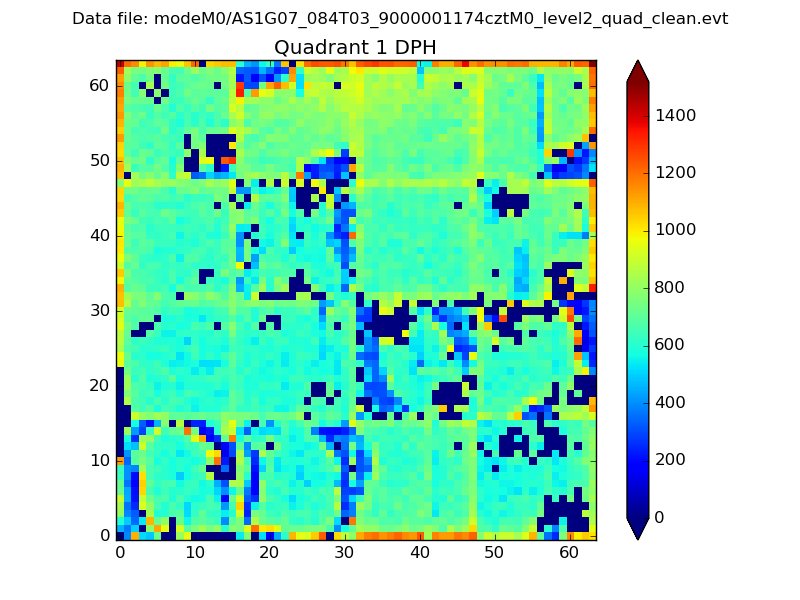 |
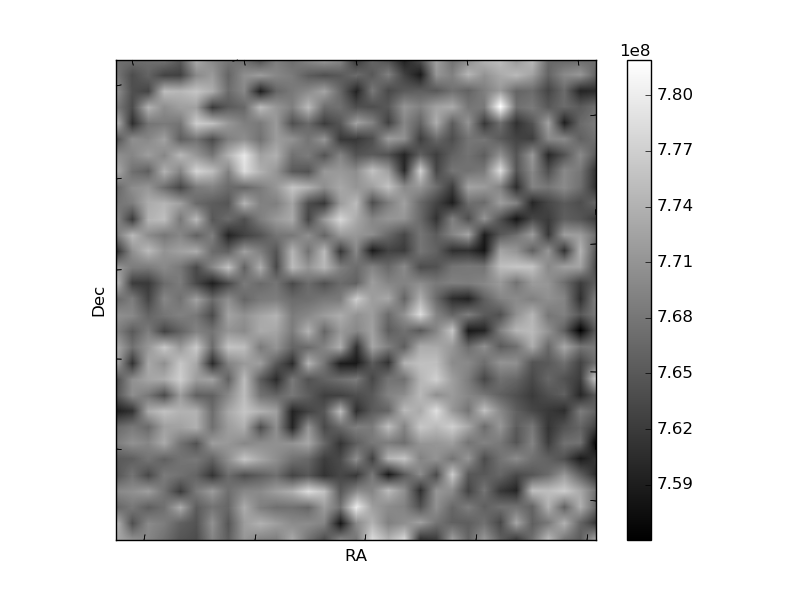
Quadrant B |
|---|---|---|---|
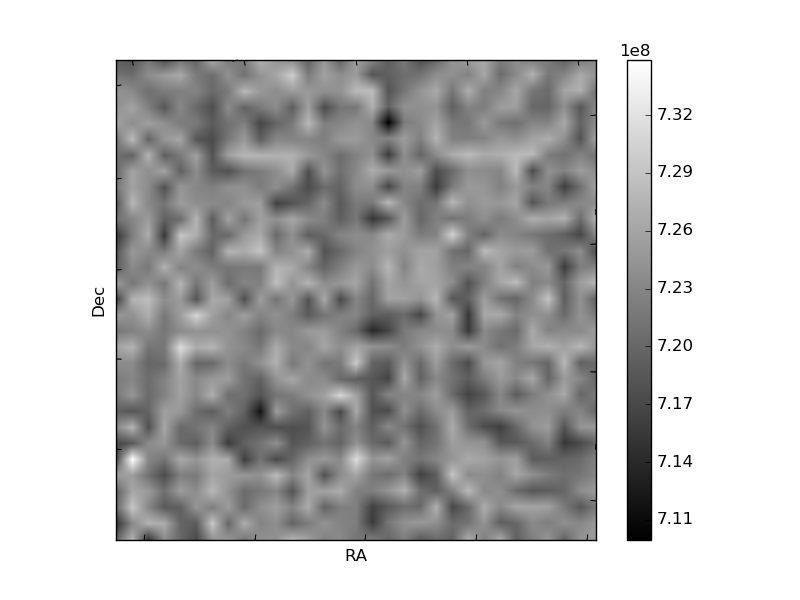
| Quadrant D | 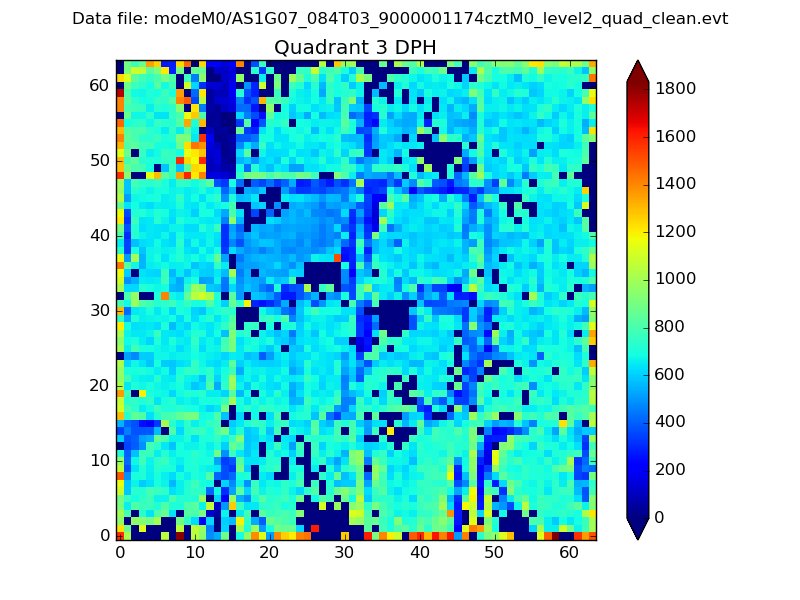 |
 |
Quadrant C |
| Plot type | Count rate plots | Images |
|---|---|---|
| Comparison with Poisson distribution Blue bars denote a histogram of data divided into 1 sec bins. Red curve is a Poisson curve with rate = median count rate of data. |
 |
 |
| Quadrant-wise count rates Data is divided into 100 sec bins |
 |
|
| Module-wise count rates for Quadrant A Data is divided into 100 sec bins |
 |
 |
| Module-wise count rates for Quadrant B Data is divided into 100 sec bins |
 |
 |
| Module-wise count rates for Quadrant C Data is divided into 100 sec bins |
 |
 |
| Module-wise count rates for Quadrant D Data is divided into 100 sec bins |
 |
 |
| Parameter | Plot |
|---|---|
| CZT HV Monitor | 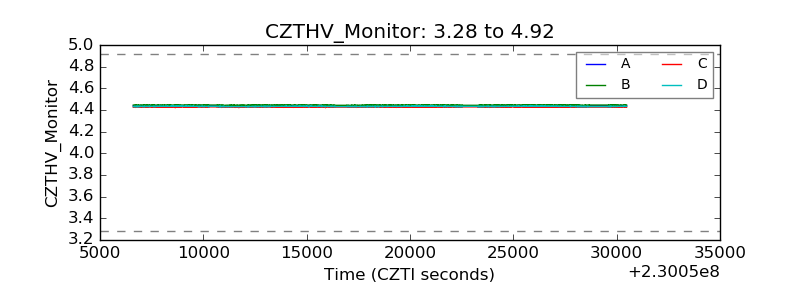 |
| D_VDD | 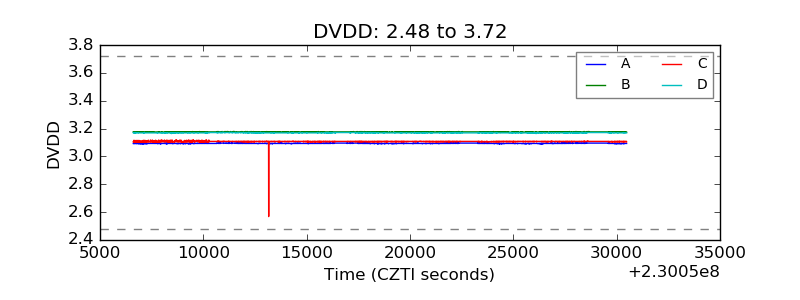 |
| Temperature 1 | 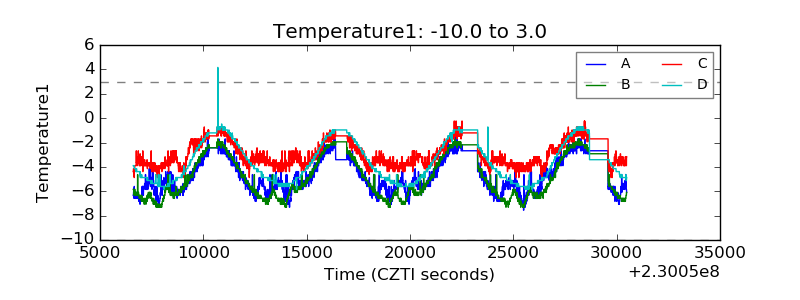 |
| Veto HV Monitor |  |
| Veto LLD | 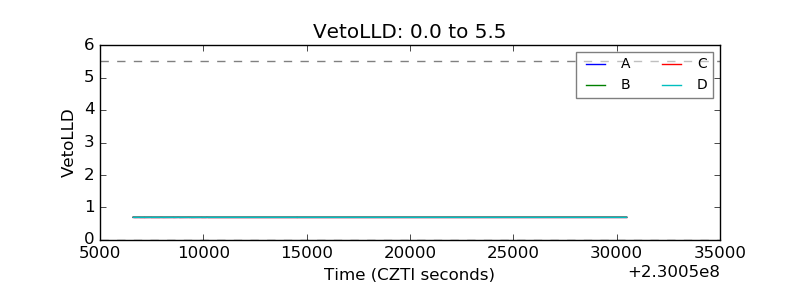 |
| Alpha Counter |  |
| _CPM_Rate |  |
| CZT Counter |  |
| +2.5 Volts monitor | 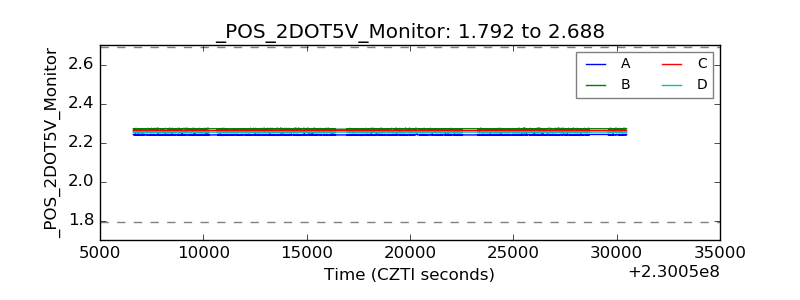 |
| +5 Volts monitor |  |
| _ROLL_ROT |  |
| _Roll_DEC |  |
| _Roll_RA |  |
| Veto Counter |  |