| Param | Original file | Final file |
|---|---|---|
| Filename | modeM0/AS1G07_084T03_9000001174_08386cztM0_level2.evt | modeM0/AS1G07_084T03_9000001174_08386cztM0_level2_quad_clean.evt |
| Size (bytes) | 326,900,160 | 93,594,240 |
| Size | 311.8 MB | 89.3 MB |
| Events in quadrant A | 2,309,734 | 617,267 |
| Events in quadrant B | 2,402,410 | 626,857 |
| Events in quadrant C | 2,323,673 | 619,808 |
| Events in quadrant D | 2,509,423 | 606,108 |
| Mode SS | |||
|---|---|---|---|
| Quadrant | BADHDUFLAG | Total packets | Discarded packets |
| A | 0 | 104 | 0 |
| B | 0 | 104 | 0 |
| C | 0 | 104 | 0 |
| D | 0 | 104 | 0 |
| Mode M0 | |||
|---|---|---|---|
| Quadrant | BADHDUFLAG | Total packets | Discarded packets |
| A | 0 | 10612 | 2 |
| B | 0 | 10711 | 1 |
| C | 0 | 10643 | 1 |
| D | 0 | 11257 | 1 |
| Mode M9 | |||
|---|---|---|---|
| Quadrant | BADHDUFLAG | Total packets | Discarded packets |
| A | 0 | 4 | 0 |
| B | 0 | 4 | 0 |
| C | 0 | 4 | 0 |
| D | 0 | 4 | 0 |
| Quadrant | Total seconds | Saturated seconds | Saturation percentage |
|---|---|---|---|
| A | 5212 | 28 | 0.537222% |
| B | 5212 | 39 | 0.748273% |
| C | 5212 | 39 | 0.748273% |
| D | 5212 | 58 | 1.112817% |
Noise dominated data is calculated using 1-second bins in cleaned event files. If a bin has >2000 counts, and if more than 50% of those come from <1% of pixels, then it is considered to be noise-dominated and hence unusable.
| Quadrant | # 1 sec bins | Bins with >0 counts | Bins with >2000 counts | High rate bins dominated by noise | Noise dominated (total time) | Noise dominated (detector-on time) | Marked lightcurve |
|---|---|---|---|---|---|---|---|
| A | 5572 | 5213 | 0 | 0 | 0.00% | 0.00% |  |
| B | 5572 | 5213 | 0 | 0 | 0.00% | 0.00% |  |
| C | 5572 | 5213 | 2 | 2 | 0.04% | 0.04% |  |
| D | 5572 | 5213 | 18 | 18 | 0.32% | 0.35% |  |
Top three noisy pixels from each quadrant. If the there are fewer than three noisy pixels in the level2.evt file, extra rows are filled as -1
| Pixel properties | Quadrant properties | ||||||
|---|---|---|---|---|---|---|---|
| Quadrant | DetID | PixID | Counts | Sigma | Mean | Median | Sigma |
| A | 0 | 226 | 5540 | 40.0 | 599 | 584 | 123.9 |
| A | 12 | 194 | 5438 | 39.18 | 599 | 584 | 123.9 |
| A | 0 | 128 | 3244 | 21.47 | 599 | 584 | 123.9 |
| B | 12 | 0 | 24164 | 202.51 | 603 | 588 | 116.4 |
| B | 0 | 214 | 18099 | 150.42 | 603 | 588 | 116.4 |
| B | 4 | 48 | 13945 | 114.73 | 603 | 588 | 116.4 |
| C | 1 | 16 | 16748 | 118.33 | 585 | 585 | 136.6 |
| C | 8 | 128 | 9171 | 62.86 | 585 | 585 | 136.6 |
| C | 9 | 68 | 6335 | 42.1 | 585 | 585 | 136.6 |
| D | 12 | 233 | 170972 | 1108.03 | 580 | 566 | 153.8 |
| D | 1 | 52 | 46431 | 298.23 | 580 | 566 | 153.8 |
| D | 2 | 234 | 19549 | 123.43 | 580 | 566 | 153.8 |
Histogram calculated using DETX and DETY for each event in the final _common_clean file
| Quadrant A |  |
 |
Quadrant B |
|---|---|---|---|
| Quadrant D |  |
 |
Quadrant C |
| Plot type | Count rate plots | Images |
|---|---|---|
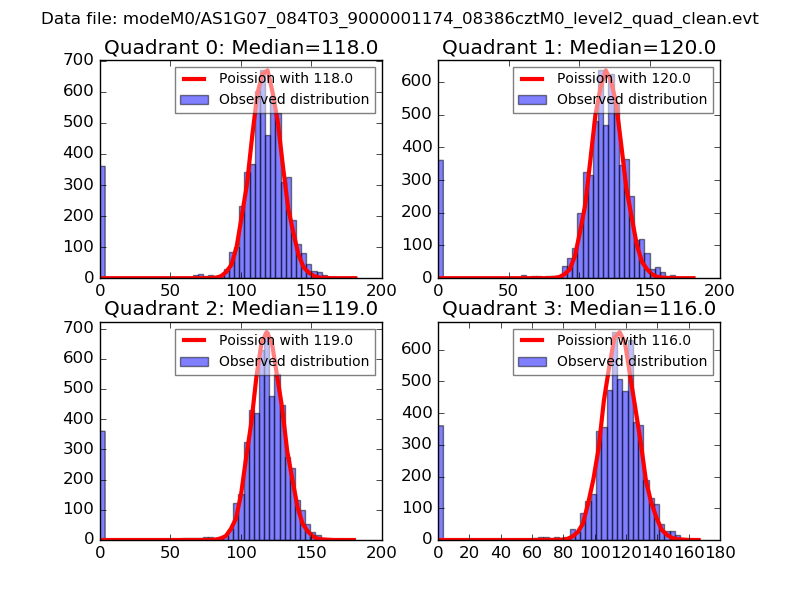
| Comparison with Poisson distribution Blue bars denote a histogram of data divided into 1 sec bins. Red curve is a Poisson curve with rate = median count rate of data. |
 |
 |
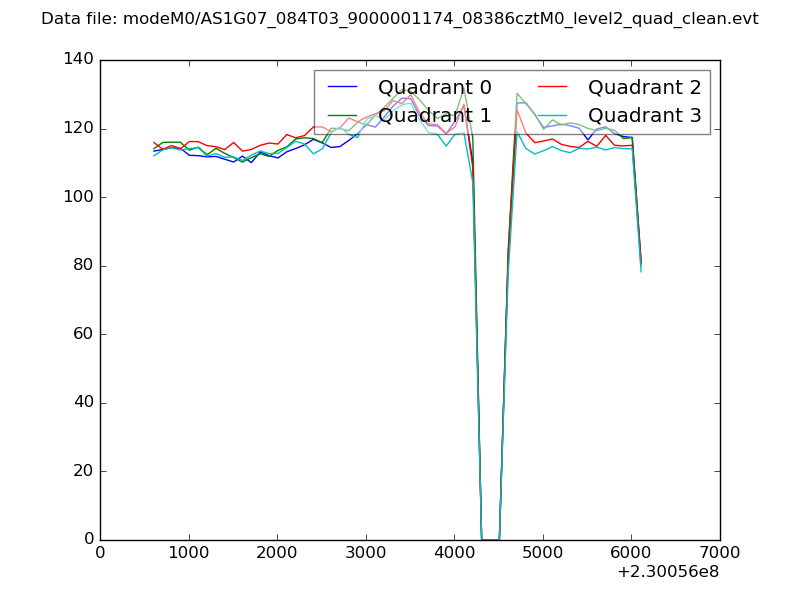
| Quadrant-wise count rates Data is divided into 100 sec bins |
 |
|
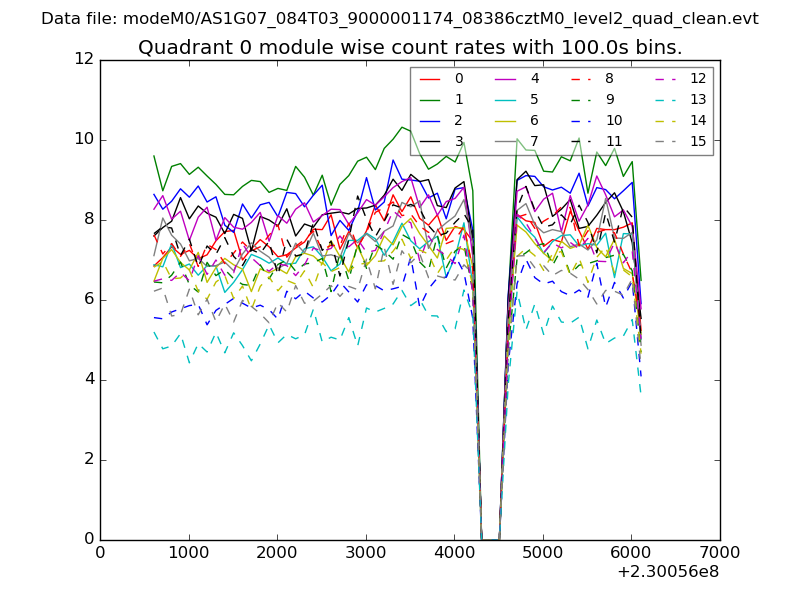
| Module-wise count rates for Quadrant A Data is divided into 100 sec bins |
 |
 |
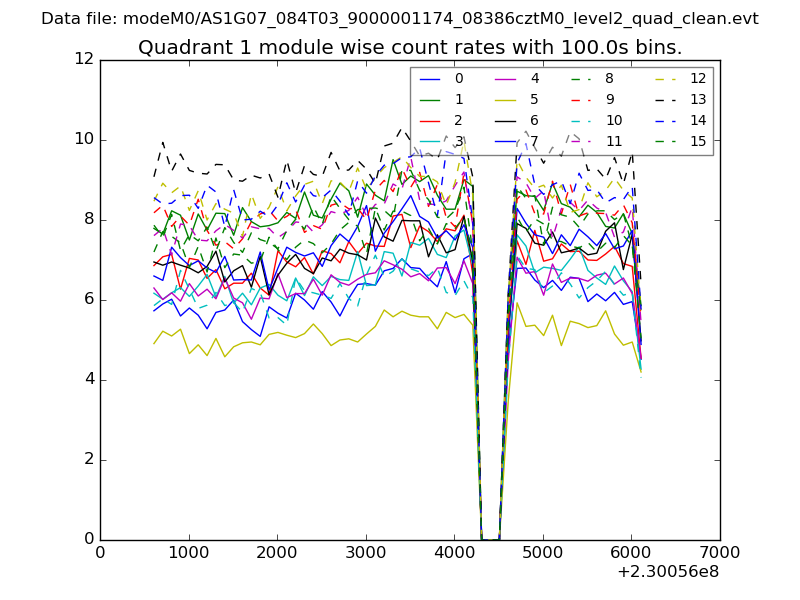
| Module-wise count rates for Quadrant B Data is divided into 100 sec bins |
 |
 |
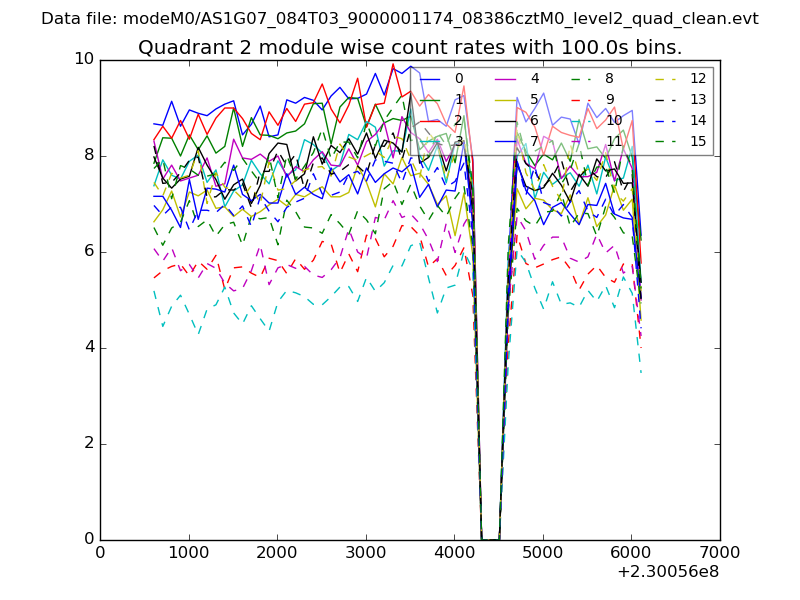
| Module-wise count rates for Quadrant C Data is divided into 100 sec bins |
 |
 |
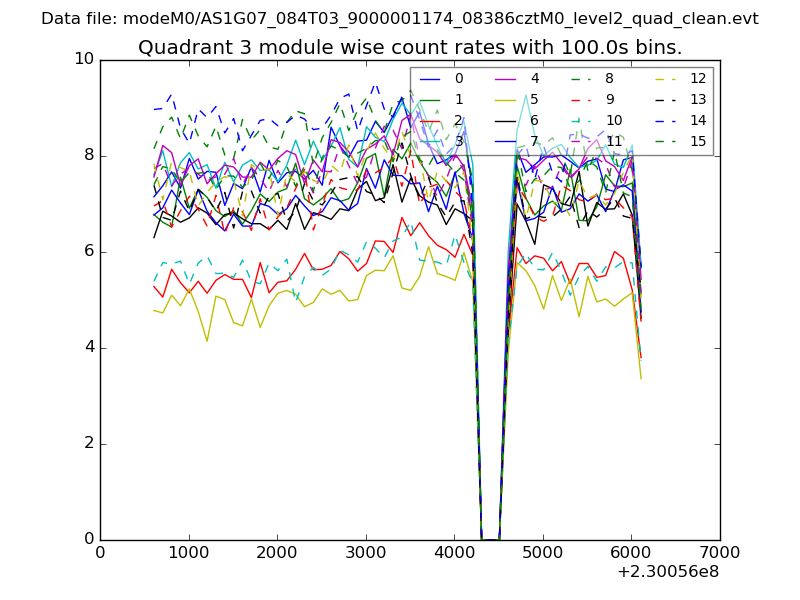
| Module-wise count rates for Quadrant D Data is divided into 100 sec bins |
 |
 |
| Parameter | Plot |
|---|---|
| CZT HV Monitor | 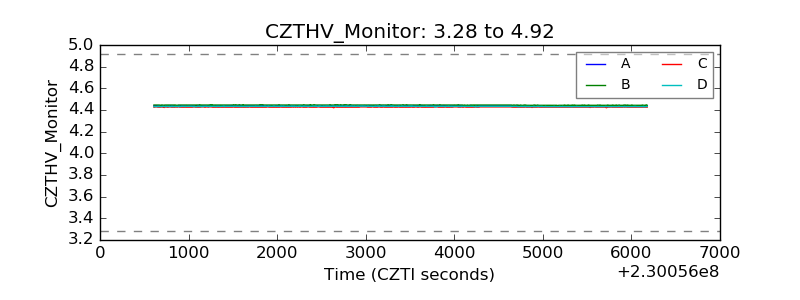 |
| D_VDD |  |
| Temperature 1 |  |
| Veto HV Monitor |  |
| Veto LLD |  |
| Alpha Counter | 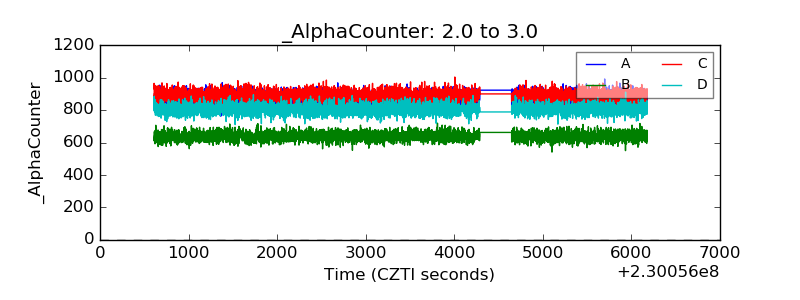 |
| _CPM_Rate | 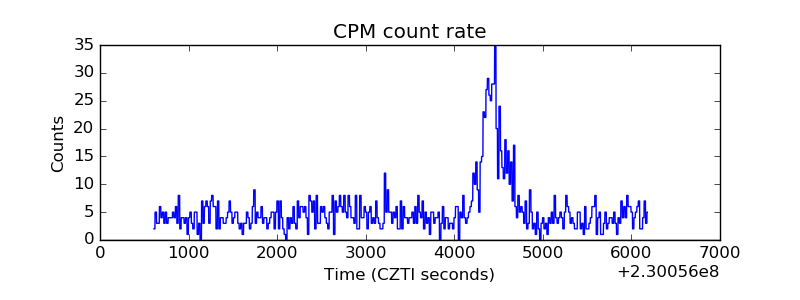 |
| CZT Counter |  |
| +2.5 Volts monitor |  |
| +5 Volts monitor |  |
| _ROLL_ROT | 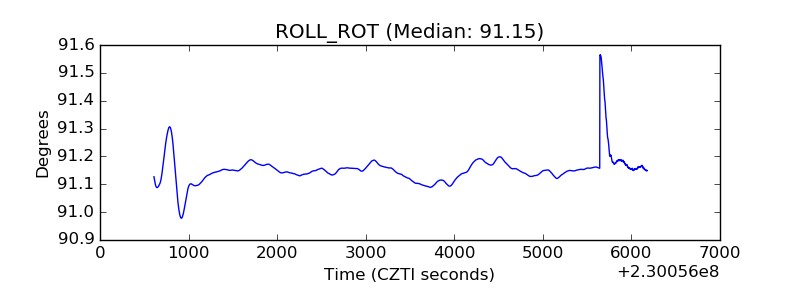 |
| _Roll_DEC | 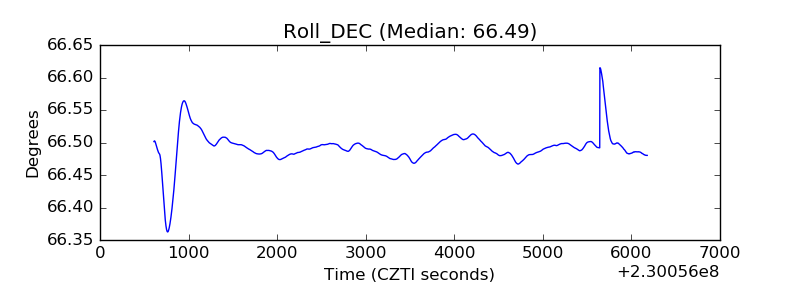 |
| _Roll_RA |  |
| Veto Counter | 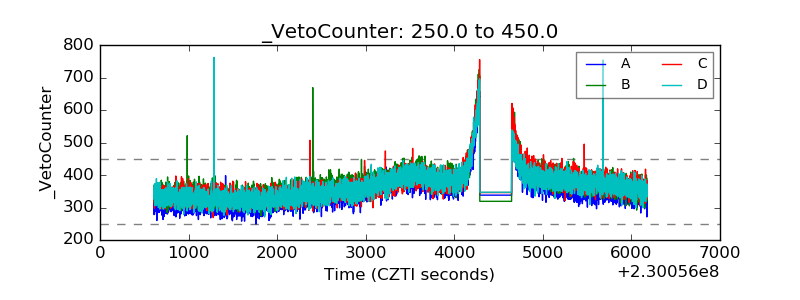 |