| Param | Original file | Final file |
|---|---|---|
| Filename | modeM0/AS1G07_084T03_9000001174_08390cztM0_level2.evt | modeM0/AS1G07_084T03_9000001174_08390cztM0_level2_quad_clean.evt |
| Size (bytes) | 85,245,120 | 23,618,880 |
| Size | 81.3 MB | 22.5 MB |
| Events in quadrant A | 599,113 | 155,923 |
| Events in quadrant B | 636,976 | 158,954 |
| Events in quadrant C | 613,678 | 158,276 |
| Events in quadrant D | 646,599 | 150,280 |
| Mode SS | |||
|---|---|---|---|
| Quadrant | BADHDUFLAG | Total packets | Discarded packets |
| A | 0 | 26 | 0 |
| B | 0 | 26 | 0 |
| C | 0 | 26 | 0 |
| D | 0 | 26 | 0 |
| Mode M0 | |||
|---|---|---|---|
| Quadrant | BADHDUFLAG | Total packets | Discarded packets |
| A | 0 | 2522 | 1 |
| B | 0 | 2616 | 1 |
| C | 0 | 2536 | 1 |
| D | 0 | 2699 | 1 |
| Mode M9 | |||
|---|---|---|---|
| Quadrant | BADHDUFLAG | Total packets | Discarded packets |
| A | 0 | 9 | 0 |
| B | 0 | 9 | 0 |
| C | 0 | 9 | 0 |
| D | 0 | 9 | 0 |
| Quadrant | Total seconds | Saturated seconds | Saturation percentage |
|---|---|---|---|
| A | 1210 | 13 | 1.074380% |
| B | 1210 | 26 | 2.148760% |
| C | 1210 | 12 | 0.991736% |
| D | 1210 | 10 | 0.826446% |
Noise dominated data is calculated using 1-second bins in cleaned event files. If a bin has >2000 counts, and if more than 50% of those come from <1% of pixels, then it is considered to be noise-dominated and hence unusable.
| Quadrant | # 1 sec bins | Bins with >0 counts | Bins with >2000 counts | High rate bins dominated by noise | Noise dominated (total time) | Noise dominated (detector-on time) | Marked lightcurve |
|---|---|---|---|---|---|---|---|
| A | 2105 | 1211 | 0 | 0 | 0.00% | 0.00% | 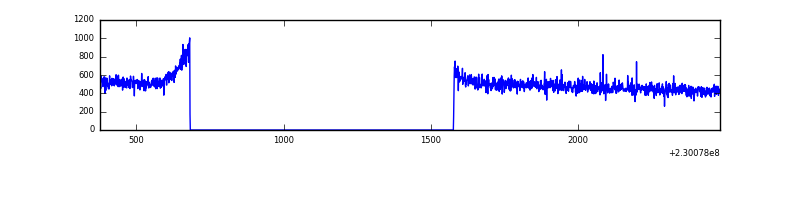 |
| B | 2105 | 1211 | 0 | 0 | 0.00% | 0.00% | 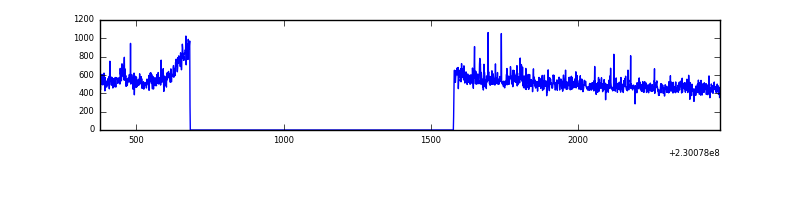 |
| C | 2105 | 1211 | 0 | 0 | 0.00% | 0.00% | 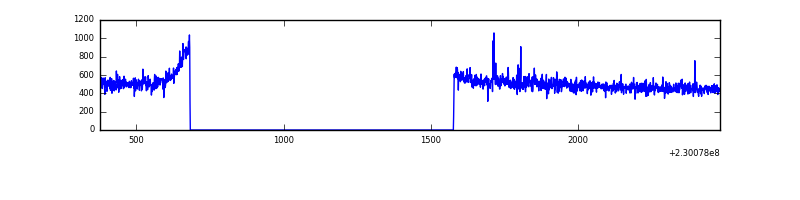 |
| D | 2105 | 1211 | 2 | 2 | 0.10% | 0.17% | 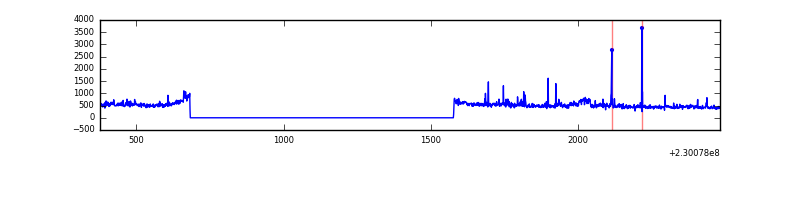 |
Top three noisy pixels from each quadrant. If the there are fewer than three noisy pixels in the level2.evt file, extra rows are filled as -1
| Pixel properties | Quadrant properties | ||||||
|---|---|---|---|---|---|---|---|
| Quadrant | DetID | PixID | Counts | Sigma | Mean | Median | Sigma |
| A | 0 | 226 | 1419 | 37.12 | 155 | 151 | 34.2 |
| A | 12 | 194 | 1417 | 37.06 | 155 | 151 | 34.2 |
| A | 5 | 16 | 588 | 12.79 | 155 | 151 | 34.2 |
| B | 0 | 214 | 7366 | 220.68 | 158 | 154 | 32.7 |
| B | 4 | 48 | 5037 | 149.41 | 158 | 154 | 32.7 |
| B | 4 | 81 | 3579 | 104.8 | 158 | 154 | 32.7 |
| C | 1 | 16 | 3806 | 94.32 | 156 | 156 | 38.7 |
| C | 13 | 61 | 1207 | 27.16 | 156 | 156 | 38.7 |
| C | 3 | 202 | 375 | 5.66 | 156 | 156 | 38.7 |
| D | 13 | 105 | 15714 | 386.49 | 154 | 149 | 40.3 |
| D | 7 | 71 | 14452 | 355.15 | 154 | 149 | 40.3 |
| D | 2 | 14 | 12117 | 297.17 | 154 | 149 | 40.3 |
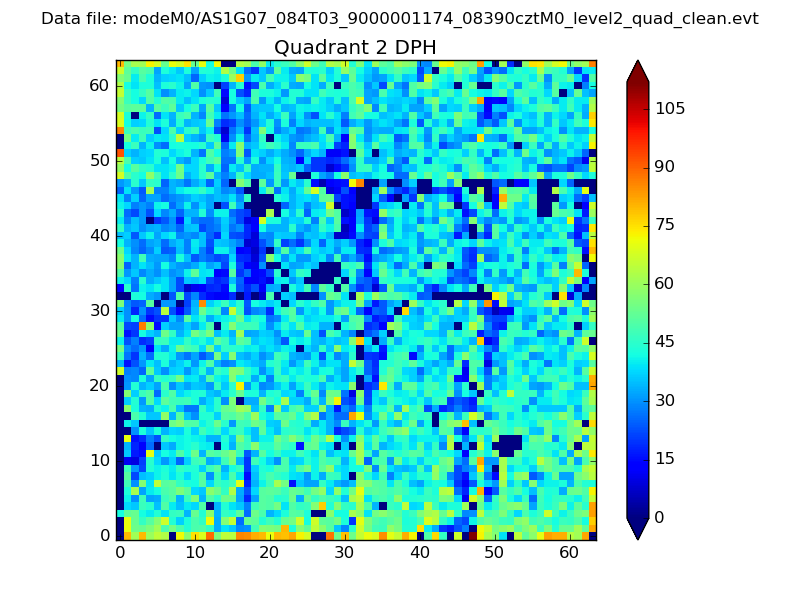
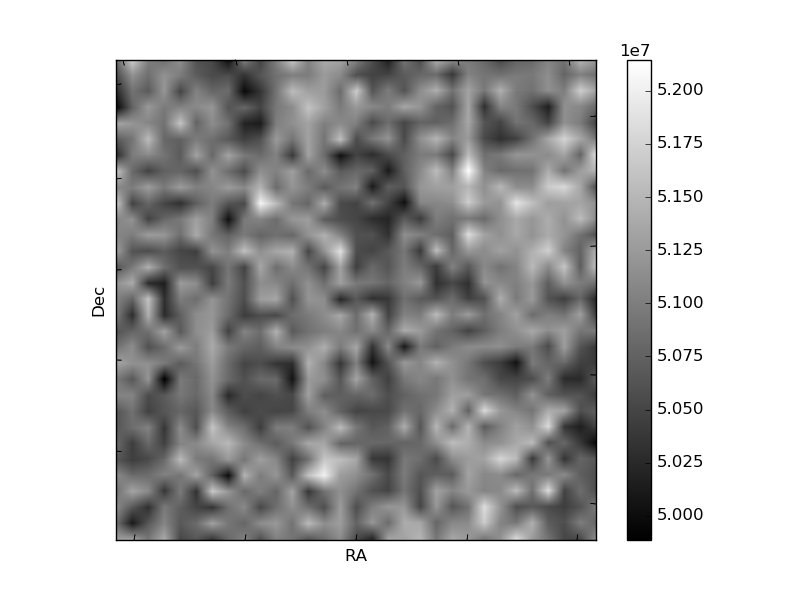
Histogram calculated using DETX and DETY for each event in the final _common_clean file
| Quadrant A |  |
 |
Quadrant B |
|---|---|---|---|
| Quadrant D | 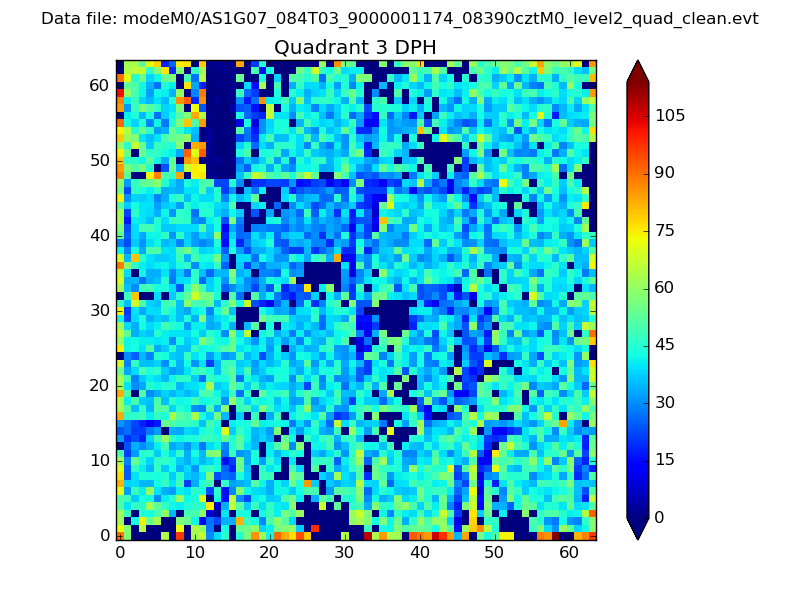 |
 |
Quadrant C |
| Plot type | Count rate plots | Images |
|---|---|---|
| Comparison with Poisson distribution Blue bars denote a histogram of data divided into 1 sec bins. Red curve is a Poisson curve with rate = median count rate of data. |
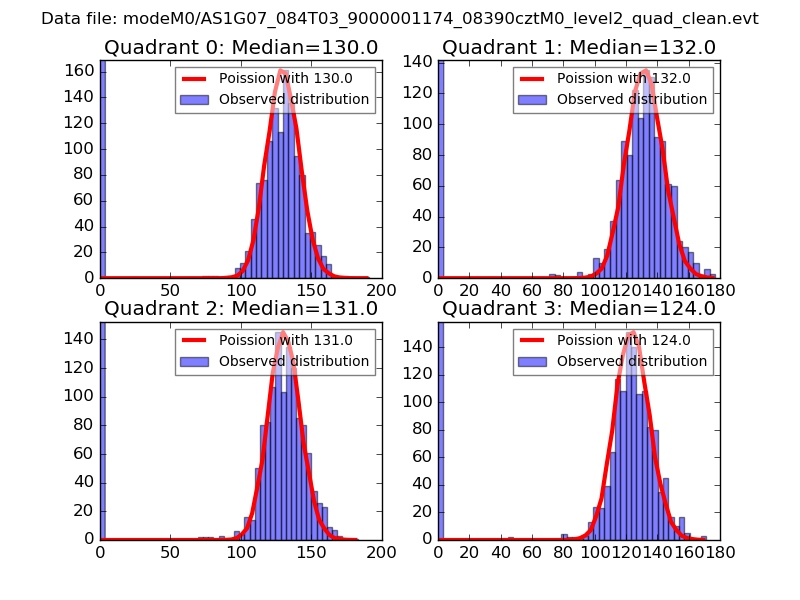 |
 |
| Quadrant-wise count rates Data is divided into 100 sec bins |
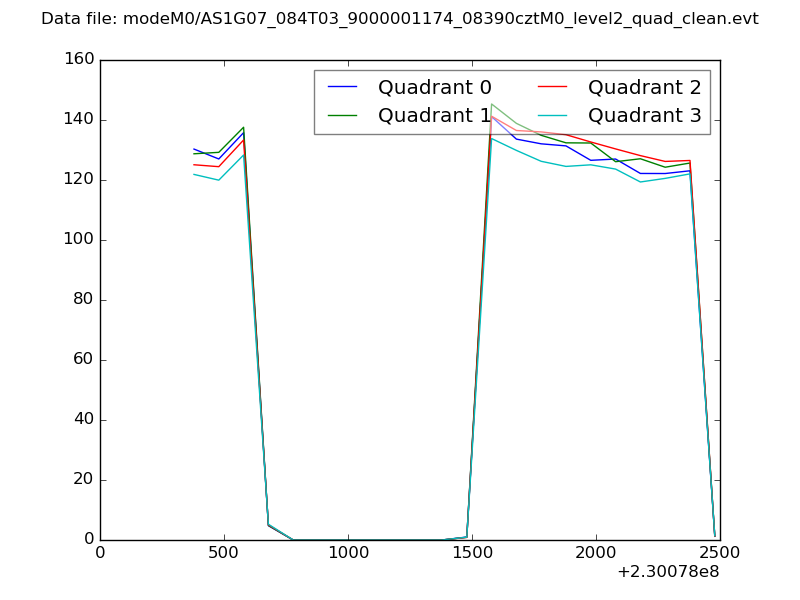 |
|
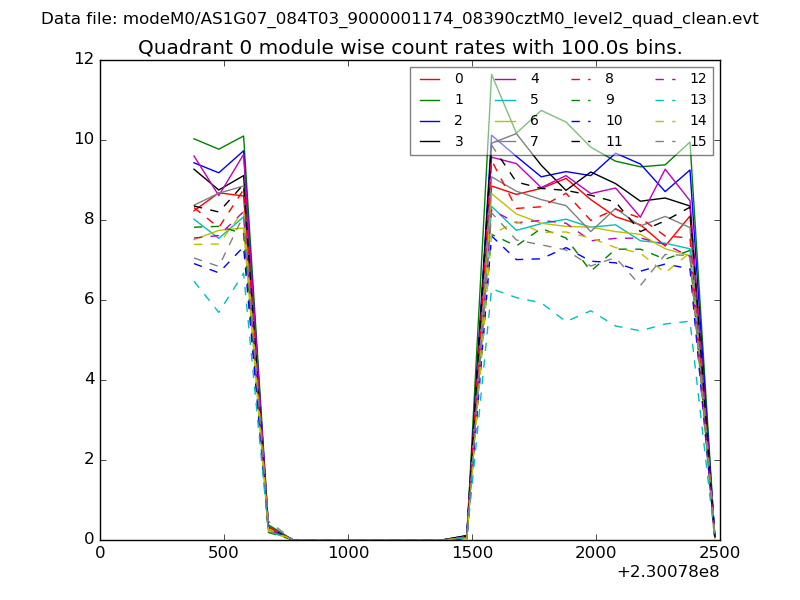
| Module-wise count rates for Quadrant A Data is divided into 100 sec bins |
 |
 |
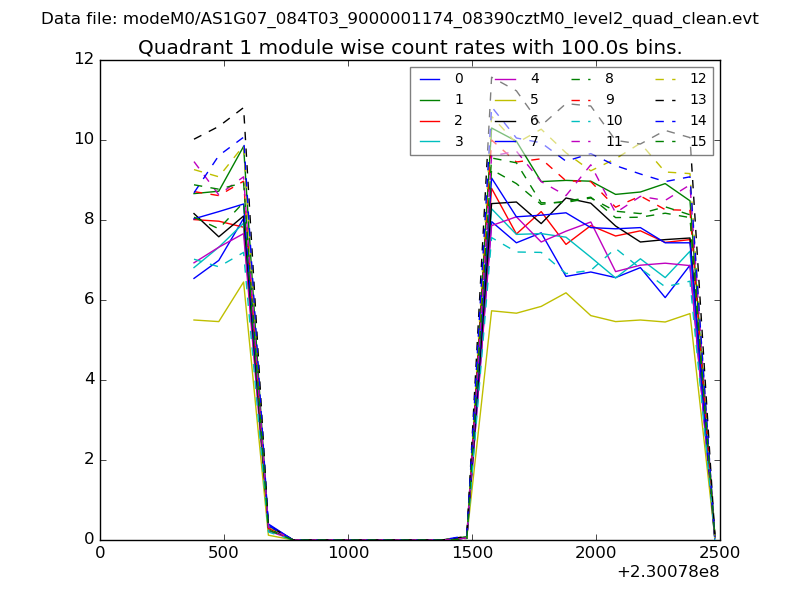
| Module-wise count rates for Quadrant B Data is divided into 100 sec bins |
 |
 |
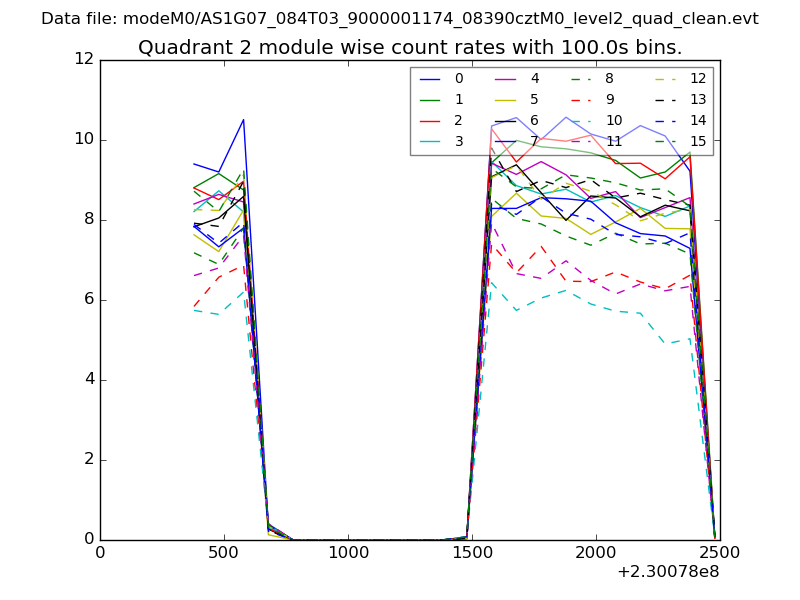
| Module-wise count rates for Quadrant C Data is divided into 100 sec bins |
 |
 |
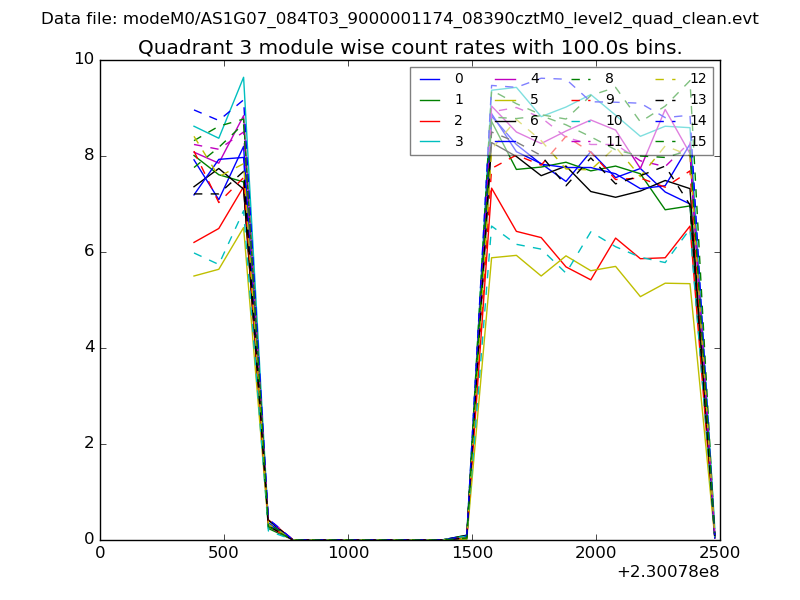
| Module-wise count rates for Quadrant D Data is divided into 100 sec bins |
 |
 |
| Parameter | Plot |
|---|---|
| CZT HV Monitor | 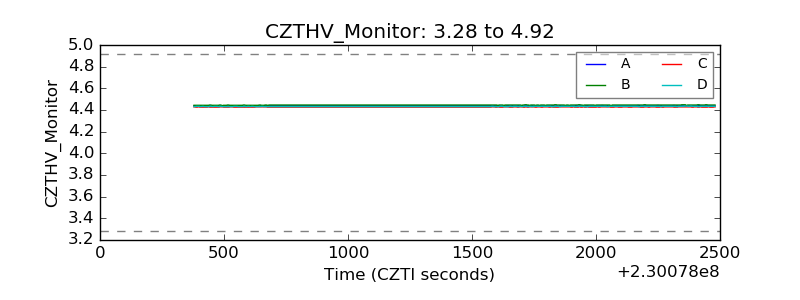 |
| D_VDD | 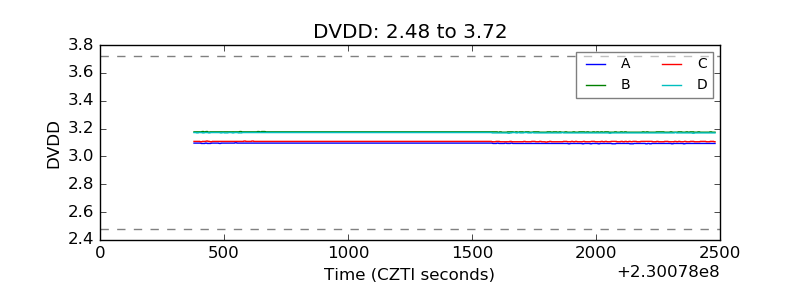 |
| Temperature 1 | 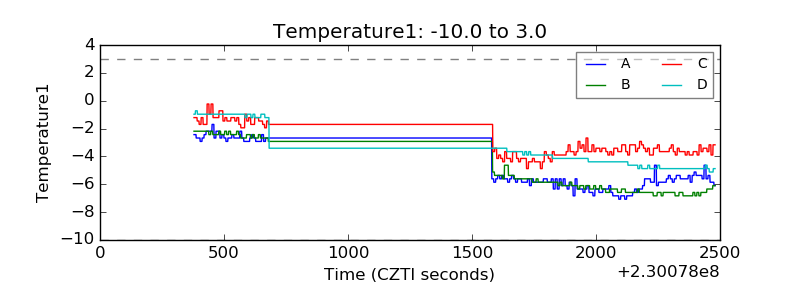 |
| Veto HV Monitor |  |
| Veto LLD | 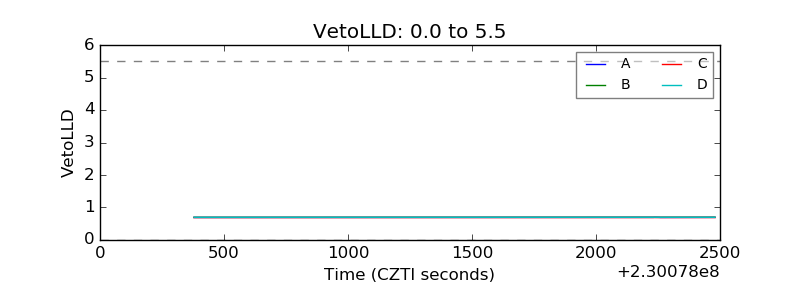 |
| Alpha Counter | 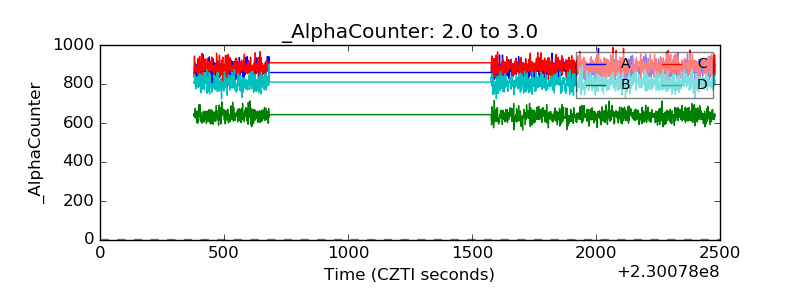 |
| _CPM_Rate | 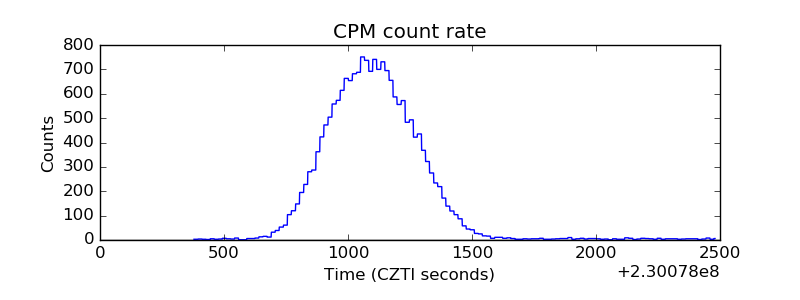 |
| CZT Counter | 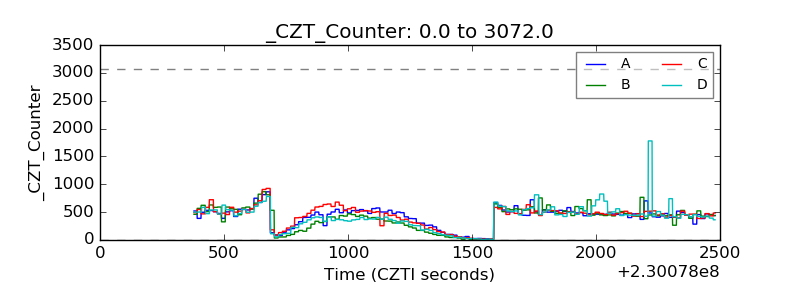 |
| +2.5 Volts monitor |  |
| +5 Volts monitor |  |
| _ROLL_ROT | 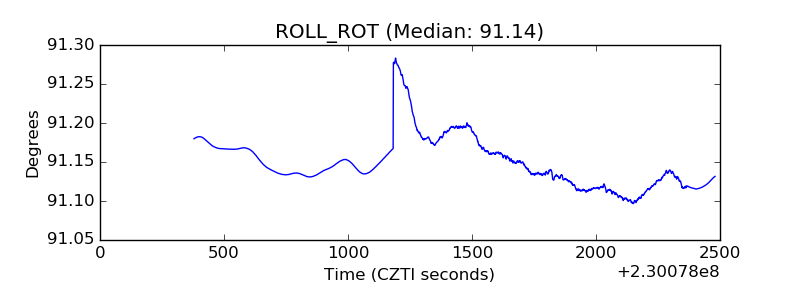 |
| _Roll_DEC | 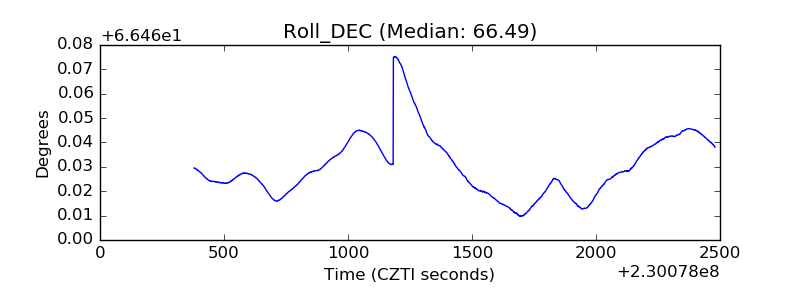 |
| _Roll_RA |  |
| Veto Counter | 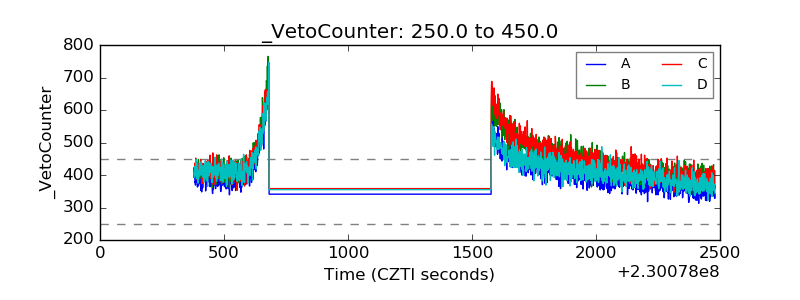 |