| Param | Original file | Final file |
|---|---|---|
| Filename | modeM0/AS1A03_025T07_9000001182cztM0_level2.fits | modeM0/AS1A03_025T07_9000001182cztM0_level2_quad_clean.evt |
| Size (bytes) | 362,226,240 | 322,922,880 |
| Size | 345.4 MB | 308.0 MB |
| Events in quadrant A | 2,228,714 | 1,898,066 |
| Events in quadrant B | 2,154,400 | 1,906,692 |
| Events in quadrant C | 2,163,740 | 1,784,412 |
| Events in quadrant D | 1,866,746 | 1,633,518 |
| Mode M9 | |||
|---|---|---|---|
| Quadrant | BADHDUFLAG | Total packets | Discarded packets |
| A | 0 | 78 | 0 |
| B | 0 | 78 | 0 |
| C | 0 | 78 | 0 |
| D | 0 | 78 | 0 |
| Mode SS | |||
|---|---|---|---|
| Quadrant | BADHDUFLAG | Total packets | Discarded packets |
| A | 0 | 762 | 0 |
| B | 0 | 764 | 0 |
| C | 0 | 758 | 0 |
| D | 0 | 758 | 0 |
| Mode M0 | |||
|---|---|---|---|
| Quadrant | BADHDUFLAG | Total packets | Discarded packets |
| A | 0 | 77147 | 0 |
| B | 0 | 78351 | 0 |
| C | 0 | 76329 | 0 |
| D | 0 | 86512 | 0 |
| Quadrant | Total seconds | Saturated seconds | Saturation percentage |
|---|---|---|---|
| A | 37217 | 508 | 1.364968% |
| B | 37214 | 519 | 1.394636% |
| C | 37210 | 308 | 0.827734% |
| D | 37217 | 1016 | 2.729935% |
Noise dominated data is calculated using 1-second bins in cleaned event files. If a bin has >2000 counts, and if more than 50% of those come from <1% of pixels, then it is considered to be noise-dominated and hence unusable.
| Quadrant | # 1 sec bins | Bins with >0 counts | Bins with >2000 counts | High rate bins dominated by noise | Noise dominated (total time) | Noise dominated (detector-on time) | Marked lightcurve |
|---|---|---|---|---|---|---|---|
| A | 45298 | 37290 | 0 | 0 | 0.00% | 0.00% |  |
| B | 45298 | 37291 | 0 | 0 | 0.00% | 0.00% |  |
| C | 45298 | 37291 | 0 | 0 | 0.00% | 0.00% |  |
| D | 45298 | 37247 | 0 | 0 | 0.00% | 0.00% |  |
Top three noisy pixels from each quadrant. If the there are fewer than three noisy pixels in the level2.evt file, extra rows are filled as -1
| Pixel properties | Quadrant properties | ||||||
|---|---|---|---|---|---|---|---|
| Quadrant | DetID | PixID | Counts | Sigma | Mean | Median | Sigma |
| A | 0 | 29 | 2105 | 10.81 | 580 | 545 | 144.3 |
| A | 7 | 110 | 1804 | 8.72 | 580 | 545 | 144.3 |
| A | 9 | 19 | 1690 | 7.93 | 580 | 545 | 144.3 |
| B | 2 | 9 | 1877 | 11.78 | 569 | 545 | 113.1 |
| B | 5 | 128 | 1445 | 7.96 | 569 | 545 | 113.1 |
| B | 12 | 226 | 1441 | 7.92 | 569 | 545 | 113.1 |
| C | 1 | 80 | 1607 | 7.17 | 571 | 533 | 149.9 |
| C | 1 | 81 | 1498 | 6.44 | 571 | 533 | 149.9 |
| C | 12 | 241 | 1469 | 6.24 | 571 | 533 | 149.9 |
| D | 7 | 5 | 1378 | 6.27 | 532 | 485 | 142.5 |
| D | 6 | 231 | 1374 | 6.24 | 532 | 485 | 142.5 |
| D | 10 | 189 | 1322 | 5.87 | 532 | 485 | 142.5 |
Histogram calculated using DETX and DETY for each event in the final _common_clean file
| Quadrant A | 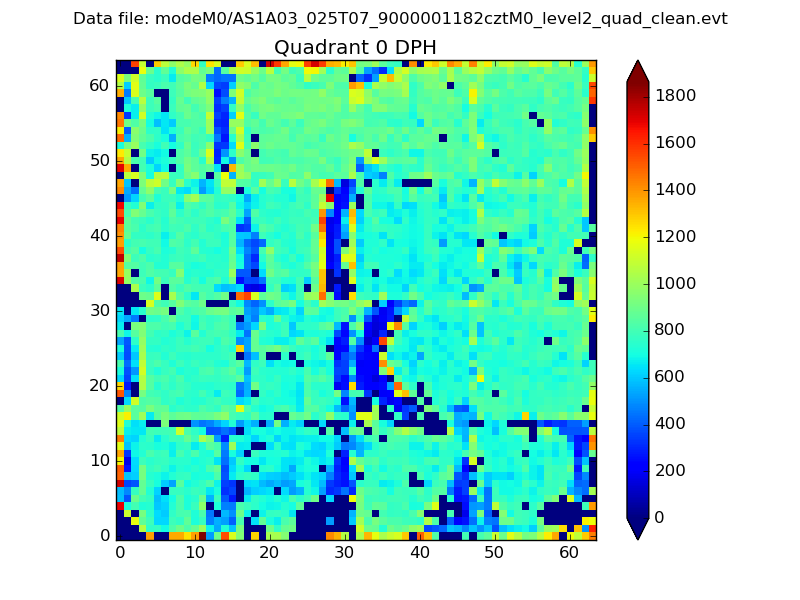 |
 |
Quadrant B |
|---|---|---|---|
| Quadrant D |  |
 |
Quadrant C |
| Plot type | Count rate plots | Images |
|---|---|---|
| Comparison with Poisson distribution Blue bars denote a histogram of data divided into 1 sec bins. Red curve is a Poisson curve with rate = median count rate of data. |
 |
 |
| Quadrant-wise count rates Data is divided into 100 sec bins |
 |
|
| Module-wise count rates for Quadrant A Data is divided into 100 sec bins |
 |
 |
| Module-wise count rates for Quadrant B Data is divided into 100 sec bins |
 |
 |
| Module-wise count rates for Quadrant C Data is divided into 100 sec bins |
 |
 |
| Module-wise count rates for Quadrant D Data is divided into 100 sec bins |
 |
 |
| Parameter | Plot |
|---|---|
| CZT HV Monitor |  |
| D_VDD |  |
| Temperature 1 |  |
| Veto HV Monitor |  |
| Veto LLD |  |
| Alpha Counter |  |
| _CPM_Rate |  |
| CZT Counter |  |
| +2.5 Volts monitor |  |
| +5 Volts monitor |  |
| _ROLL_ROT |  |
| _Roll_DEC |  |
| _Roll_RA | 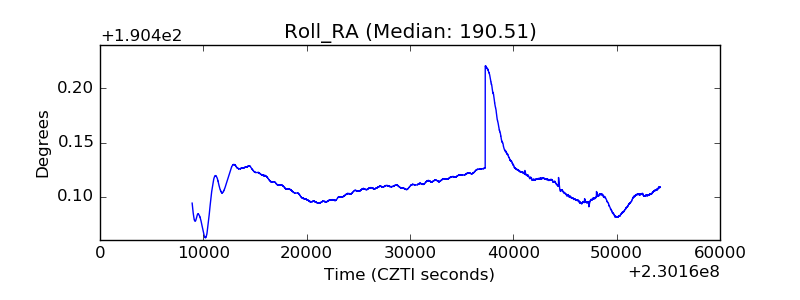 |
| Veto Counter |  |