| Param | Original file | Final file |
|---|---|---|
| Filename | modeM0/AS1A03_025T07_9000001182_08406cztM0_level2.evt | modeM0/AS1A03_025T07_9000001182_08406cztM0_level2_quad_clean.evt |
| Size (bytes) | 315,843,840 | 59,783,040 |
| Size | 301.2 MB | 57.0 MB |
| Events in quadrant A | 2,190,365 | 373,554 |
| Events in quadrant B | 2,305,494 | 382,338 |
| Events in quadrant C | 2,149,228 | 373,523 |
| Events in quadrant D | 2,591,073 | 342,166 |
| Mode M9 | |||
|---|---|---|---|
| Quadrant | BADHDUFLAG | Total packets | Discarded packets |
| A | 0 | 11 | 0 |
| B | 0 | 11 | 0 |
| C | 0 | 11 | 0 |
| D | 0 | 11 | 0 |
| Mode SS | |||
|---|---|---|---|
| Quadrant | BADHDUFLAG | Total packets | Discarded packets |
| A | 0 | 100 | 2 |
| B | 0 | 100 | 0 |
| C | 0 | 100 | 6 |
| D | 0 | 100 | 6 |
| Mode M0 | |||
|---|---|---|---|
| Quadrant | BADHDUFLAG | Total packets | Discarded packets |
| A | 0 | 9981 | 153 |
| B | 0 | 10196 | 157 |
| C | 0 | 9975 | 169 |
| D | 0 | 11319 | 157 |
| Quadrant | Total seconds | Saturated seconds | Saturation percentage |
|---|---|---|---|
| A | 4832 | 26 | 0.538079% |
| B | 4830 | 28 | 0.579710% |
| C | 4824 | 8 | 0.165837% |
| D | 4830 | 170 | 3.519669% |
Noise dominated data is calculated using 1-second bins in cleaned event files. If a bin has >2000 counts, and if more than 50% of those come from <1% of pixels, then it is considered to be noise-dominated and hence unusable.
| Quadrant | # 1 sec bins | Bins with >0 counts | Bins with >2000 counts | High rate bins dominated by noise | Noise dominated (total time) | Noise dominated (detector-on time) | Marked lightcurve |
|---|---|---|---|---|---|---|---|
| A | 6023 | 4905 | 0 | 0 | 0.00% | 0.00% | 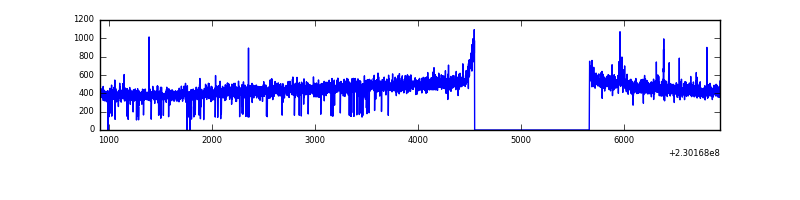 |
| B | 6023 | 4905 | 2 | 2 | 0.03% | 0.04% | 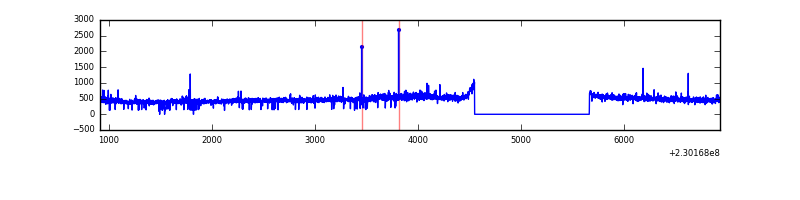 |
| C | 6023 | 4903 | 0 | 0 | 0.00% | 0.00% | 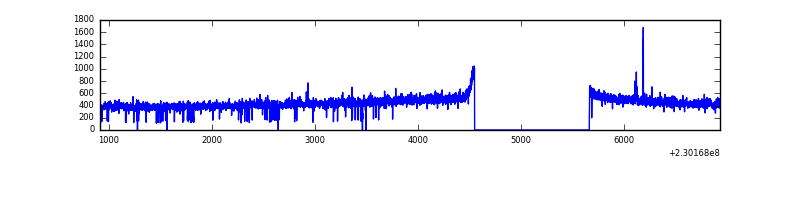 |
| D | 6023 | 4906 | 136 | 136 | 2.26% | 2.77% | 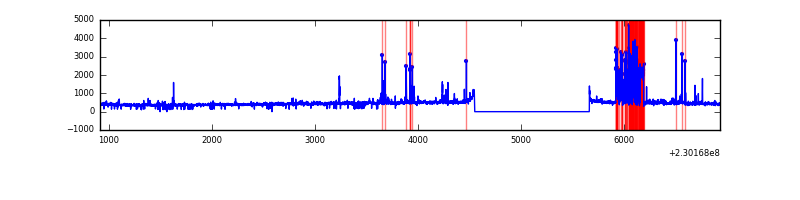 |
Top three noisy pixels from each quadrant. If the there are fewer than three noisy pixels in the level2.evt file, extra rows are filled as -1
| Pixel properties | Quadrant properties | ||||||
|---|---|---|---|---|---|---|---|
| Quadrant | DetID | PixID | Counts | Sigma | Mean | Median | Sigma |
| A | 13 | 251 | 8313 | 66.27 | 565 | 552 | 117.1 |
| A | 13 | 248 | 5375 | 41.18 | 565 | 552 | 117.1 |
| A | 0 | 226 | 5293 | 40.48 | 565 | 552 | 117.1 |
| B | 0 | 214 | 71778 | 655.55 | 568 | 555 | 108.6 |
| B | 12 | 111 | 11743 | 102.97 | 568 | 555 | 108.6 |
| B | 11 | 111 | 9357 | 81.01 | 568 | 555 | 108.6 |
| C | 1 | 16 | 6912 | 49.43 | 549 | 552 | 128.7 |
| C | 13 | 61 | 4201 | 28.36 | 549 | 552 | 128.7 |
| C | 8 | 222 | 1966 | 10.99 | 549 | 552 | 128.7 |
| D | 1 | 52 | 402220 | 3080.91 | 532 | 515 | 130.4 |
| D | 4 | 95 | 50553 | 383.77 | 532 | 515 | 130.4 |
| D | 7 | 71 | 43054 | 326.26 | 532 | 515 | 130.4 |
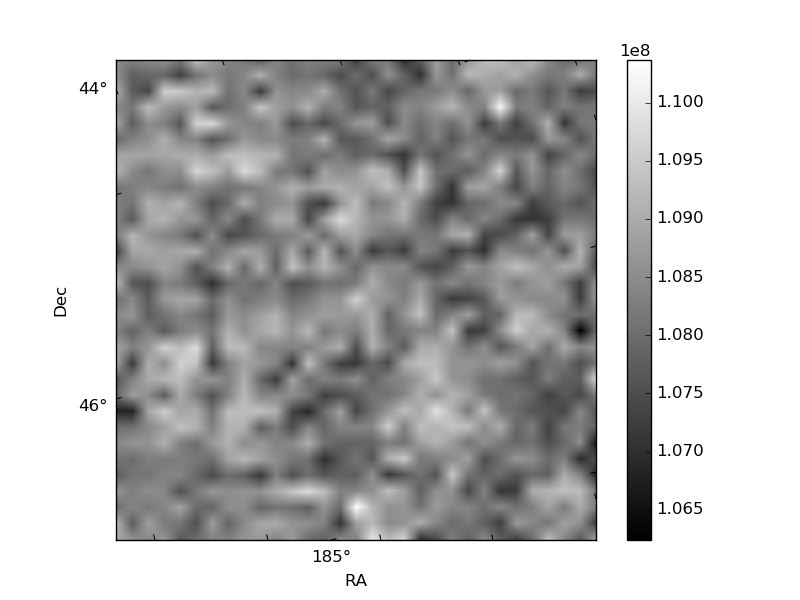
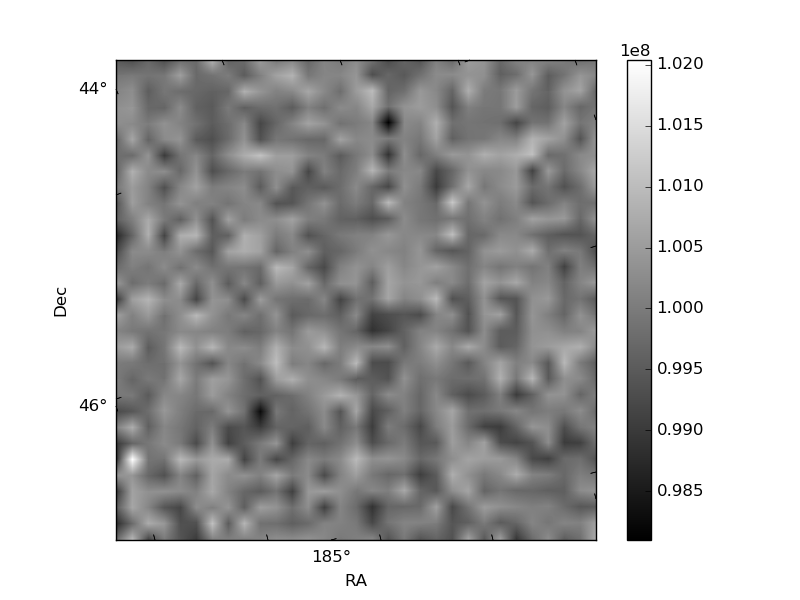
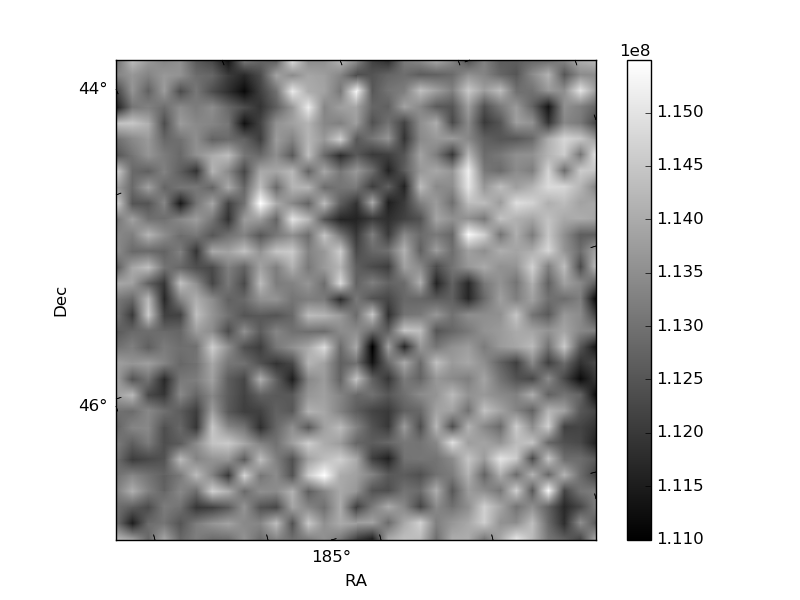
Histogram calculated using DETX and DETY for each event in the final _common_clean file
| Quadrant A | 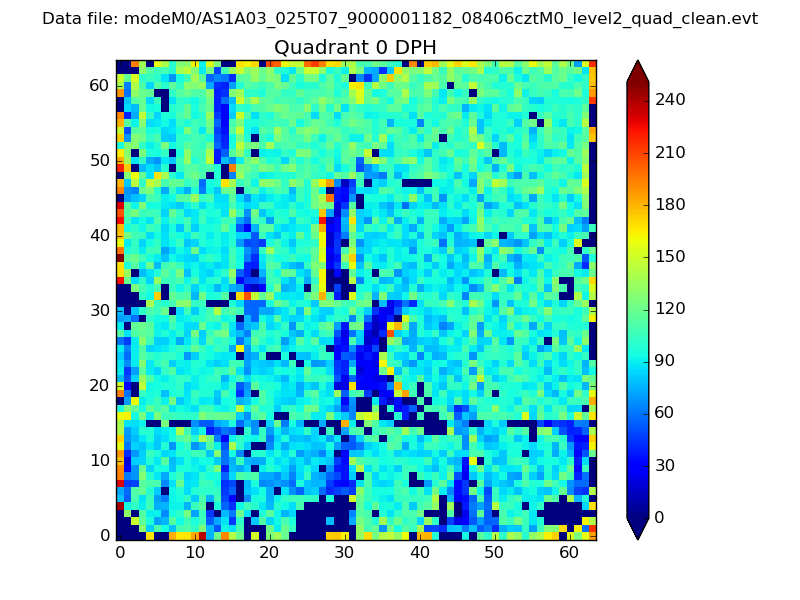 |
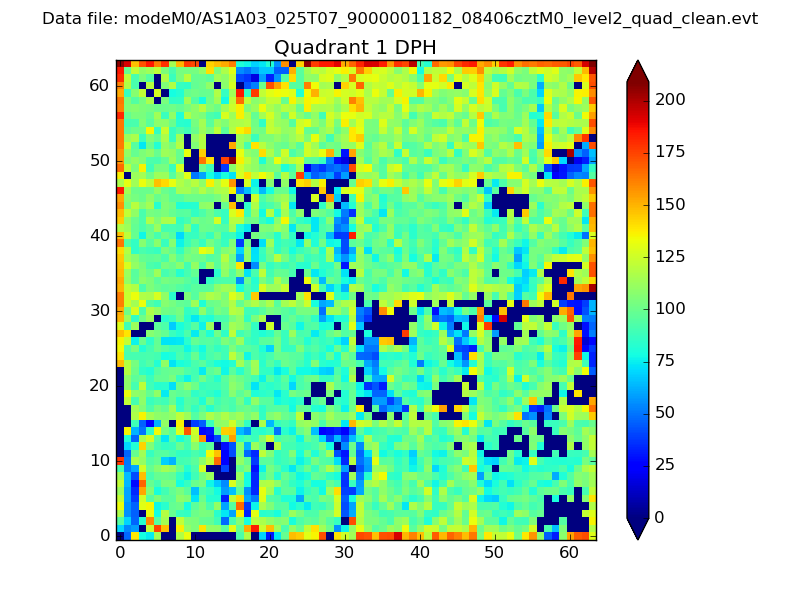 |
Quadrant B |
|---|---|---|---|
| Quadrant D | 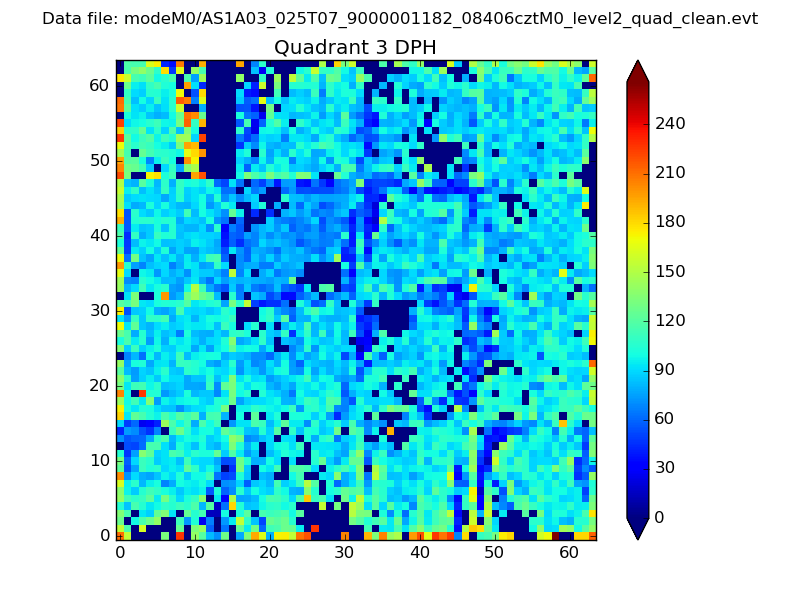 |
 |
Quadrant C |
| Plot type | Count rate plots | Images |
|---|---|---|
| Comparison with Poisson distribution Blue bars denote a histogram of data divided into 1 sec bins. Red curve is a Poisson curve with rate = median count rate of data. |
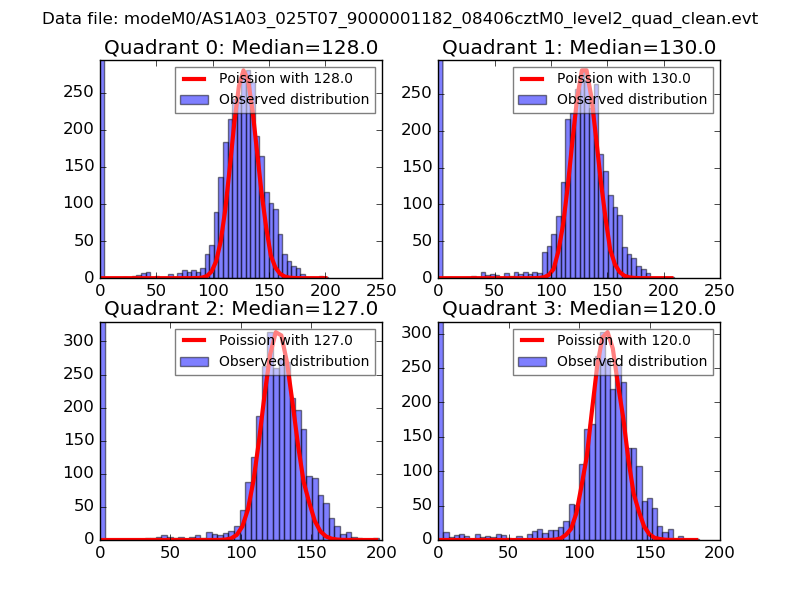 |
 |
| Quadrant-wise count rates Data is divided into 100 sec bins |
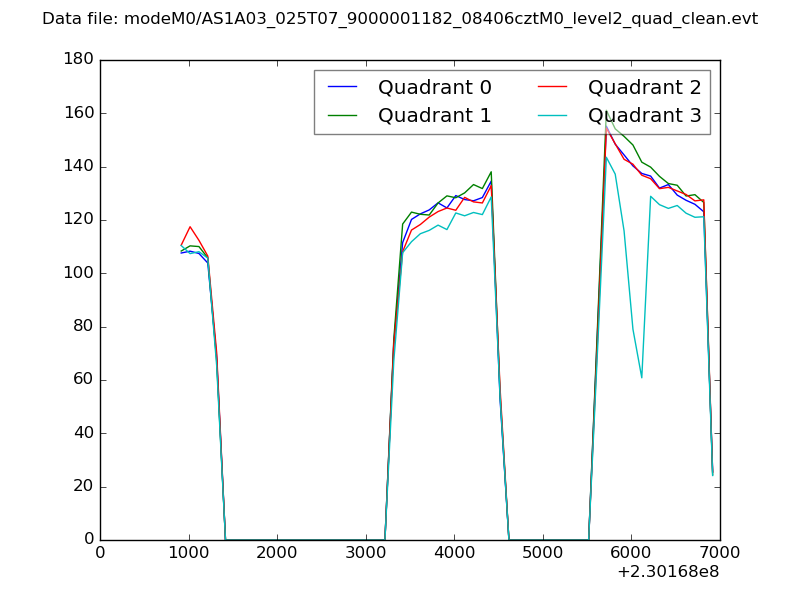 |
|
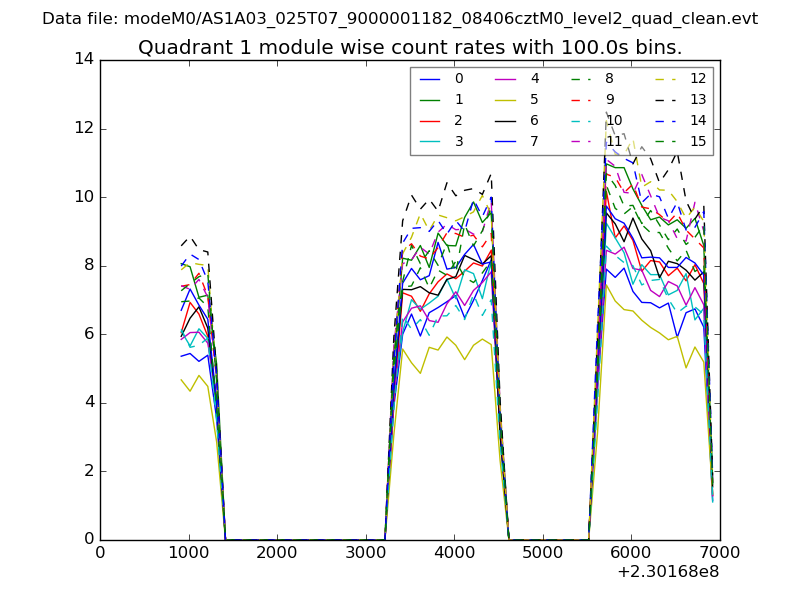
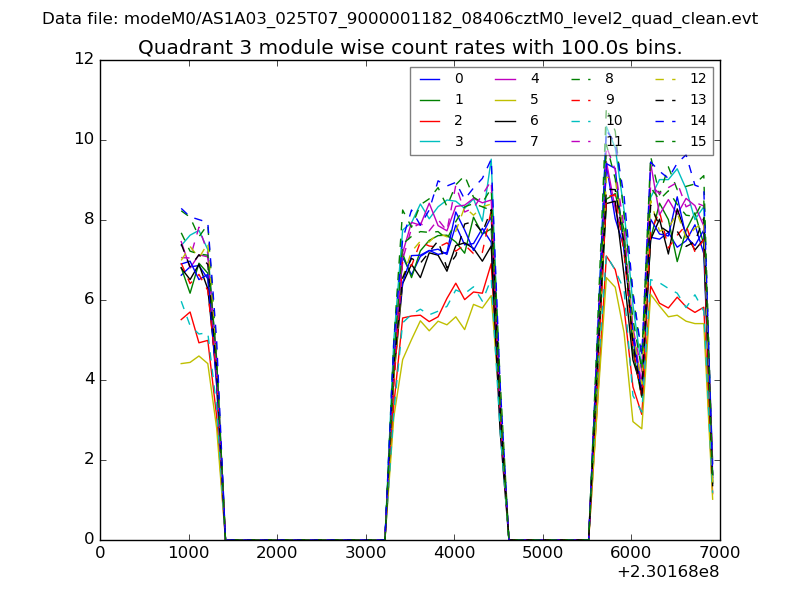
| Module-wise count rates for Quadrant A Data is divided into 100 sec bins |
 |
 |
| Module-wise count rates for Quadrant B Data is divided into 100 sec bins |
 |
 |
| Module-wise count rates for Quadrant C Data is divided into 100 sec bins |
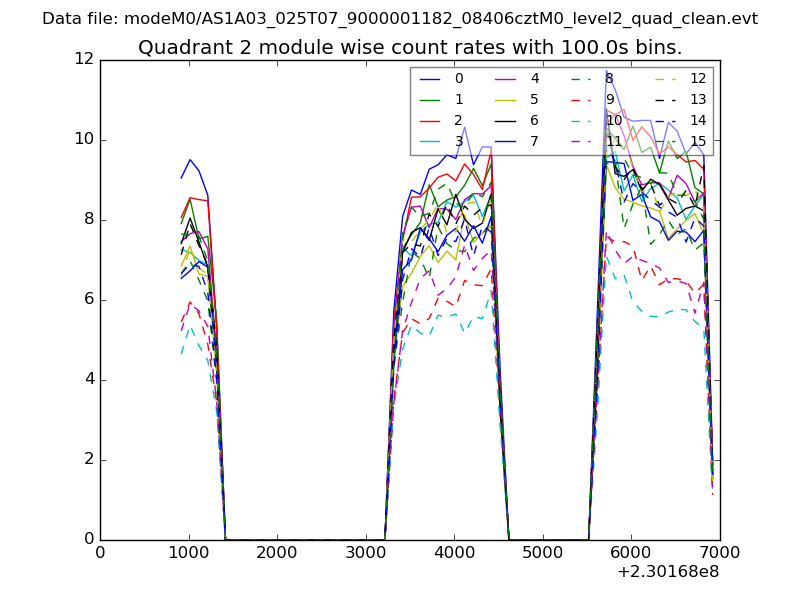 |
 |
| Module-wise count rates for Quadrant D Data is divided into 100 sec bins |
 |
 |
| Parameter | Plot |
|---|---|
| CZT HV Monitor |  |
| D_VDD | 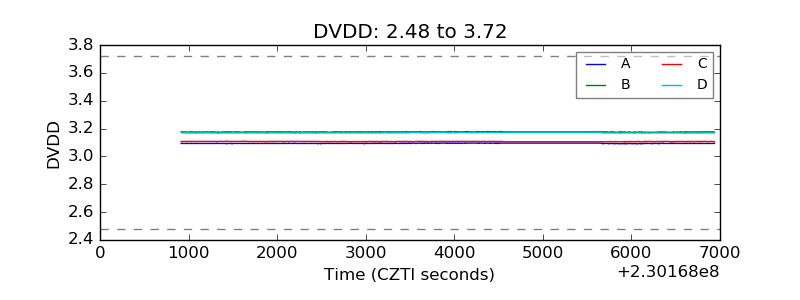 |
| Temperature 1 | 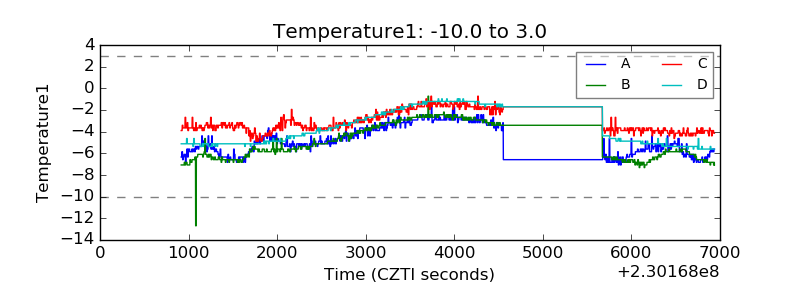 |
| Veto HV Monitor | 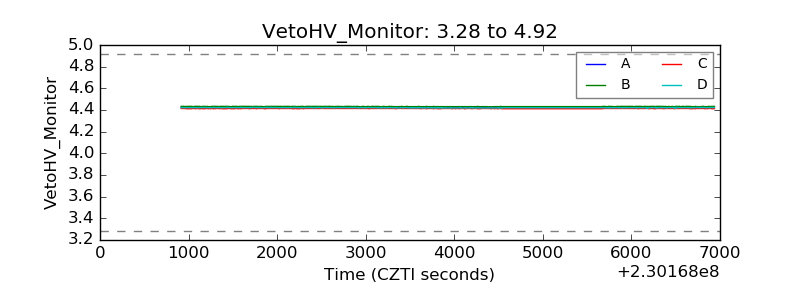 |
| Veto LLD | 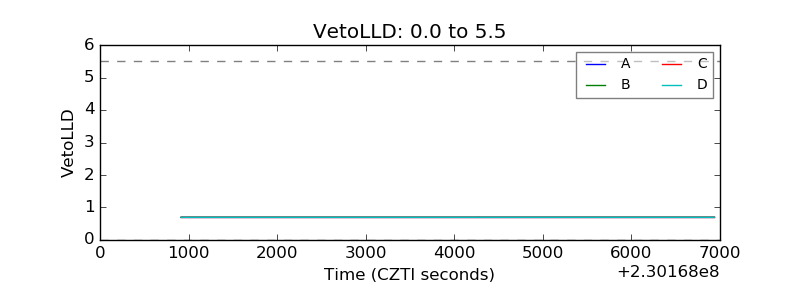 |
| Alpha Counter | 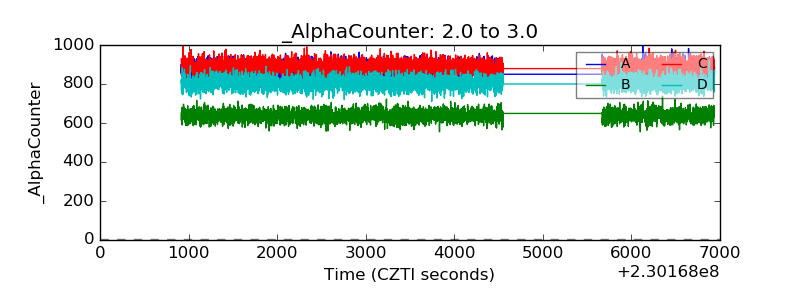 |
| _CPM_Rate | 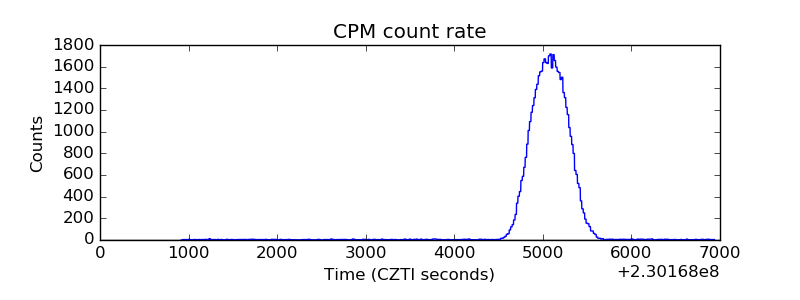 |
| CZT Counter | 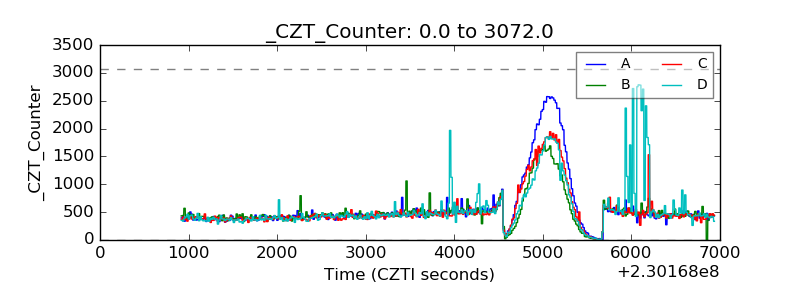 |
| +2.5 Volts monitor |  |
| +5 Volts monitor |  |
| _ROLL_ROT | 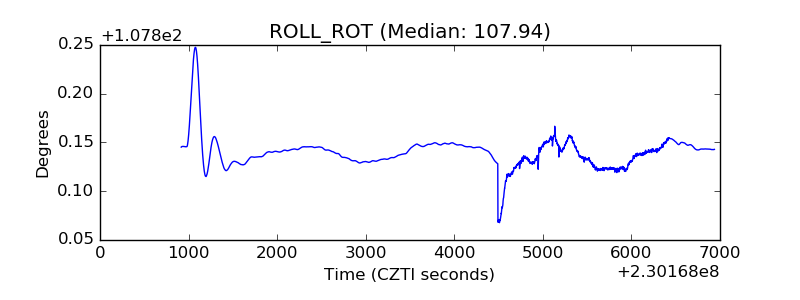 |
| _Roll_DEC | 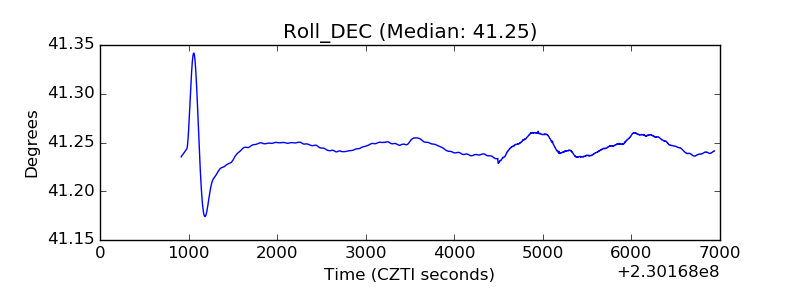 |
| _Roll_RA |  |
| Veto Counter | 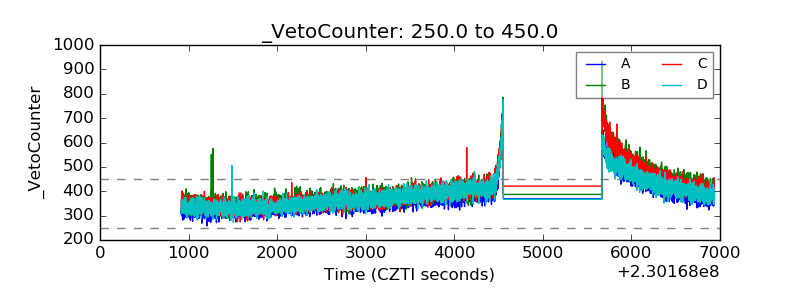 |