| Param | Original file | Final file |
|---|---|---|
| Filename | modeM0/AS1A03_025T07_9000001182_08407cztM0_level2.evt | modeM0/AS1A03_025T07_9000001182_08407cztM0_level2_quad_clean.evt |
| Size (bytes) | 438,304,320 | 91,267,200 |
| Size | 418.0 MB | 87.0 MB |
| Events in quadrant A | 2,991,324 | 590,091 |
| Events in quadrant B | 3,146,511 | 603,739 |
| Events in quadrant C | 2,972,728 | 583,384 |
| Events in quadrant D | 3,730,399 | 542,288 |
| Mode M9 | |||
|---|---|---|---|
| Quadrant | BADHDUFLAG | Total packets | Discarded packets |
| A | 0 | 23 | 0 |
| B | 0 | 23 | 0 |
| C | 0 | 23 | 0 |
| D | 0 | 23 | 0 |
| Mode SS | |||
|---|---|---|---|
| Quadrant | BADHDUFLAG | Total packets | Discarded packets |
| A | 0 | 132 | 2 |
| B | 0 | 132 | 0 |
| C | 0 | 132 | 0 |
| D | 0 | 132 | 0 |
| Mode M0 | |||
|---|---|---|---|
| Quadrant | BADHDUFLAG | Total packets | Discarded packets |
| A | 0 | 13092 | 16 |
| B | 0 | 13372 | 23 |
| C | 0 | 13164 | 19 |
| D | 0 | 15298 | 14 |
| Quadrant | Total seconds | Saturated seconds | Saturation percentage |
|---|---|---|---|
| A | 6370 | 44 | 0.690738% |
| B | 6367 | 56 | 0.879535% |
| C | 6369 | 26 | 0.408227% |
| D | 6371 | 243 | 3.814158% |
Noise dominated data is calculated using 1-second bins in cleaned event files. If a bin has >2000 counts, and if more than 50% of those come from <1% of pixels, then it is considered to be noise-dominated and hence unusable.
| Quadrant | # 1 sec bins | Bins with >0 counts | Bins with >2000 counts | High rate bins dominated by noise | Noise dominated (total time) | Noise dominated (detector-on time) | Marked lightcurve |
|---|---|---|---|---|---|---|---|
| A | 8716 | 6379 | 0 | 0 | 0.00% | 0.00% | 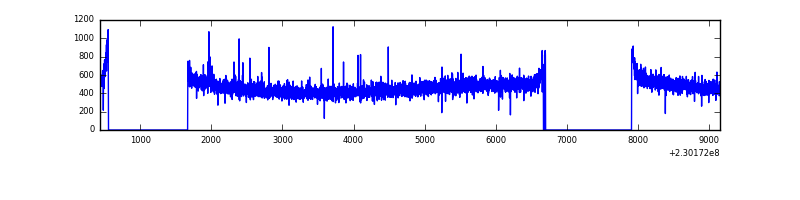 |
| B | 8716 | 6379 | 3 | 3 | 0.03% | 0.05% | 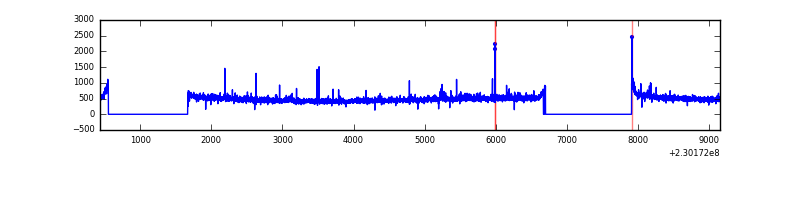 |
| C | 8716 | 6379 | 2 | 2 | 0.02% | 0.03% | 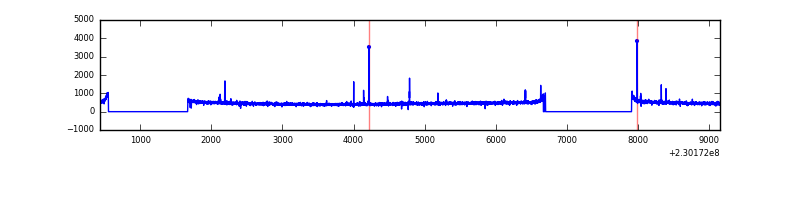 |
| D | 8716 | 6379 | 191 | 191 | 2.19% | 2.99% | 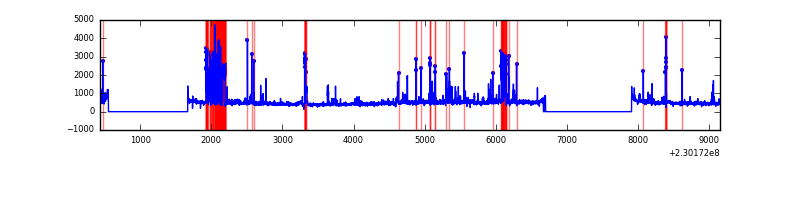 |
Top three noisy pixels from each quadrant. If the there are fewer than three noisy pixels in the level2.evt file, extra rows are filled as -1
| Pixel properties | Quadrant properties | ||||||
|---|---|---|---|---|---|---|---|
| Quadrant | DetID | PixID | Counts | Sigma | Mean | Median | Sigma |
| A | 13 | 251 | 9576 | 55.84 | 774 | 759 | 157.9 |
| A | 0 | 226 | 7346 | 41.72 | 774 | 759 | 157.9 |
| A | 12 | 194 | 6766 | 38.04 | 774 | 759 | 157.9 |
| B | 0 | 214 | 73461 | 492.92 | 780 | 760 | 147.5 |
| B | 12 | 111 | 15784 | 101.86 | 780 | 760 | 147.5 |
| B | 5 | 255 | 13942 | 89.37 | 780 | 760 | 147.5 |
| C | 1 | 16 | 43320 | 243.74 | 749 | 753 | 174.6 |
| C | 13 | 61 | 5568 | 27.57 | 749 | 753 | 174.6 |
| C | 12 | 4 | 4934 | 23.94 | 749 | 753 | 174.6 |
| D | 1 | 52 | 606285 | 3294.61 | 725 | 707 | 183.8 |
| D | 7 | 71 | 141491 | 765.93 | 725 | 707 | 183.8 |
| D | 12 | 221 | 65338 | 351.62 | 725 | 707 | 183.8 |
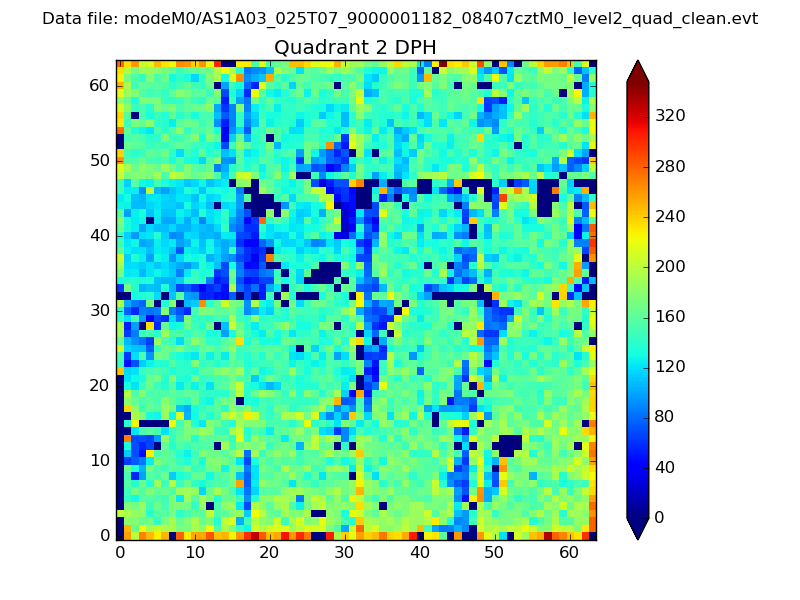
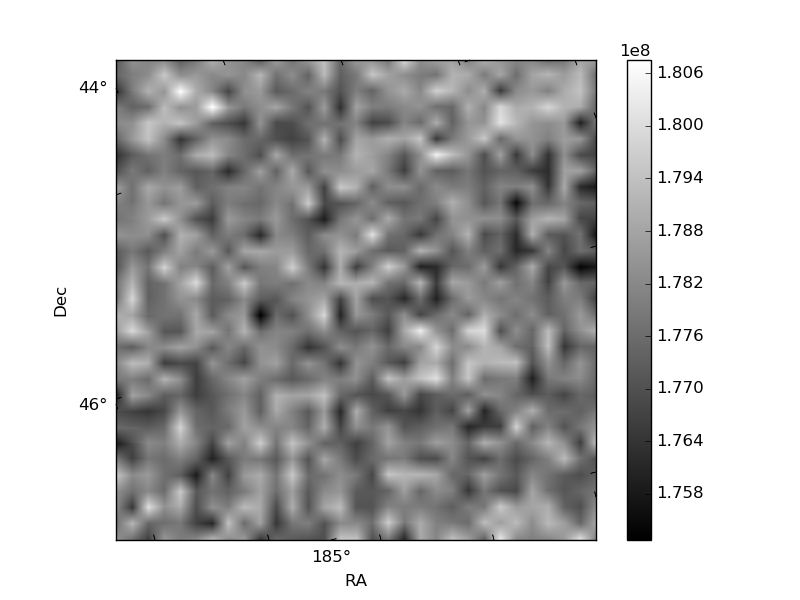
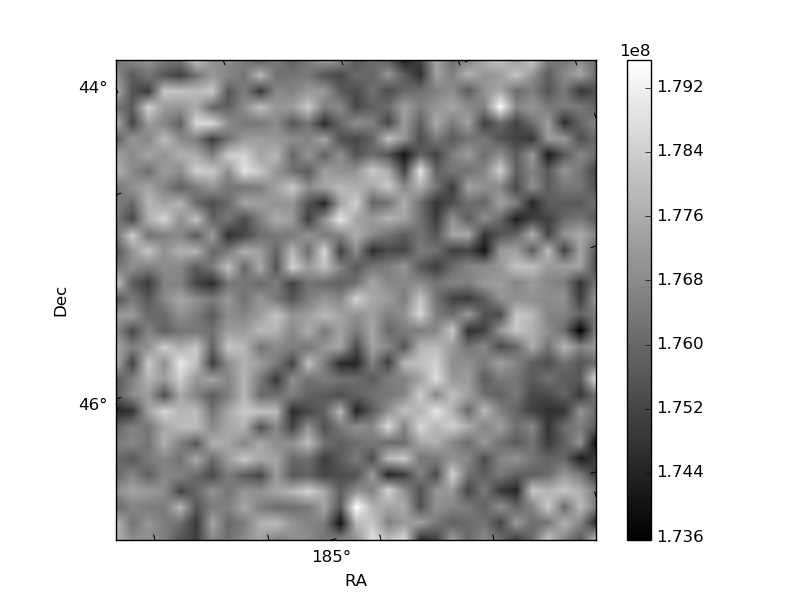
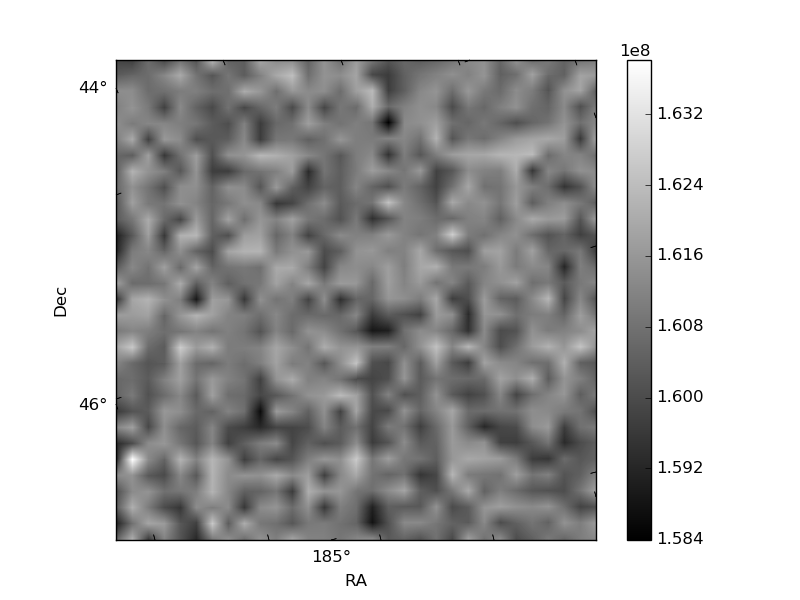
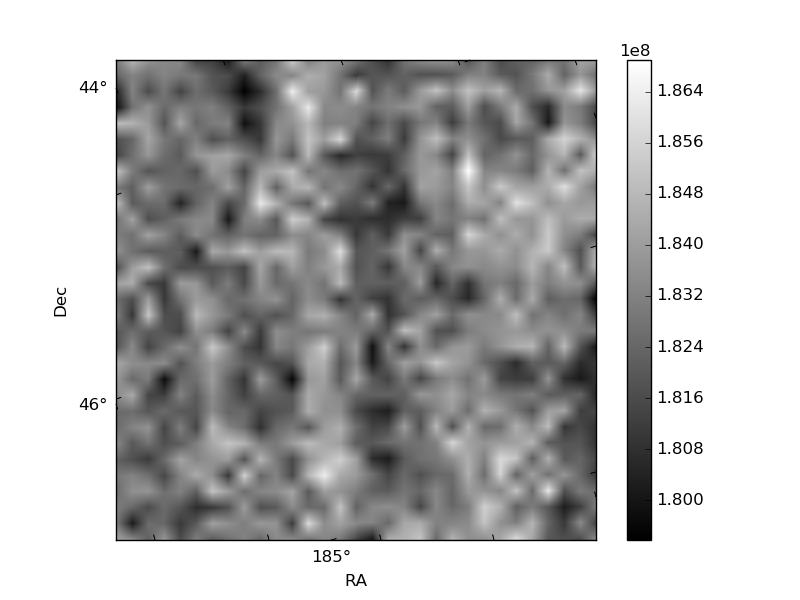
Histogram calculated using DETX and DETY for each event in the final _common_clean file
| Quadrant A | 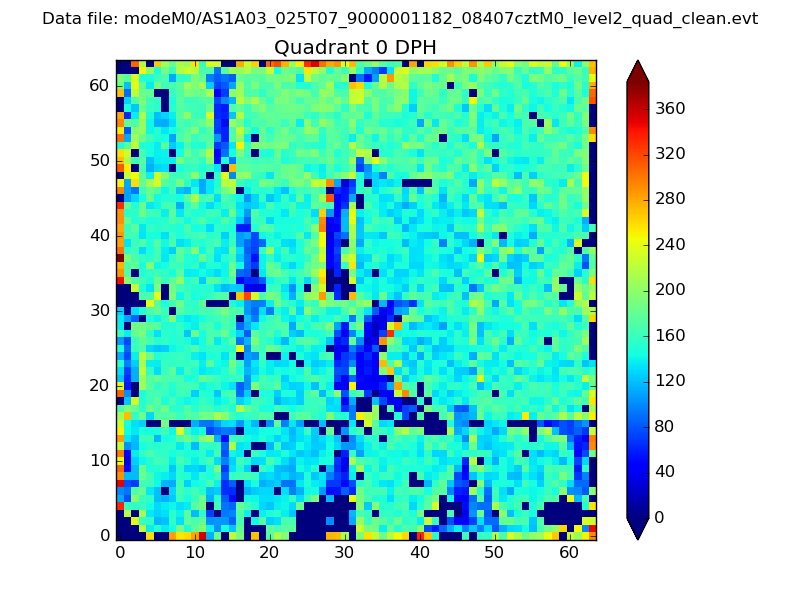 |
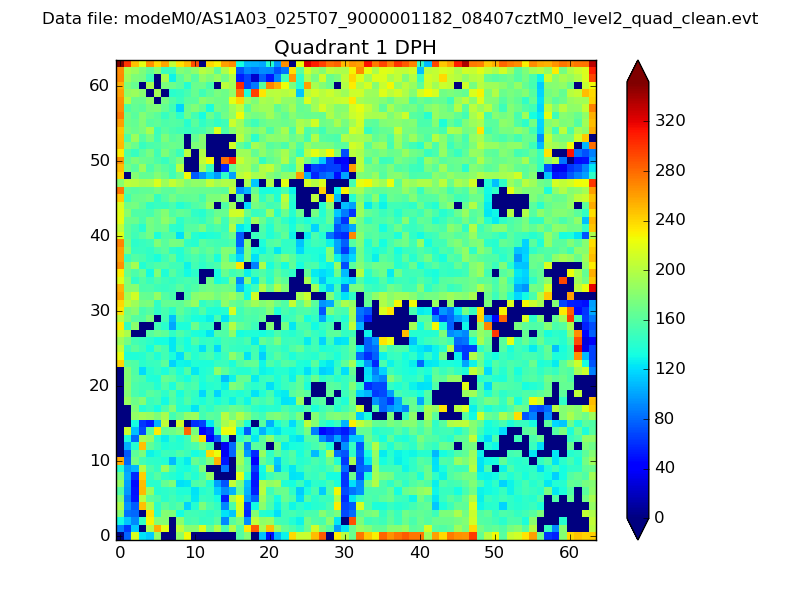 |
Quadrant B |
|---|---|---|---|
| Quadrant D | 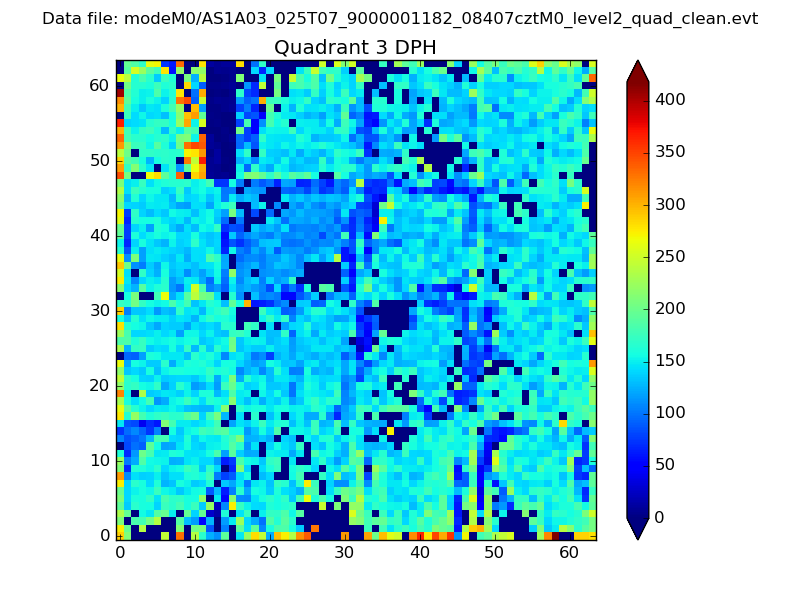 |
 |
Quadrant C |
| Plot type | Count rate plots | Images |
|---|---|---|
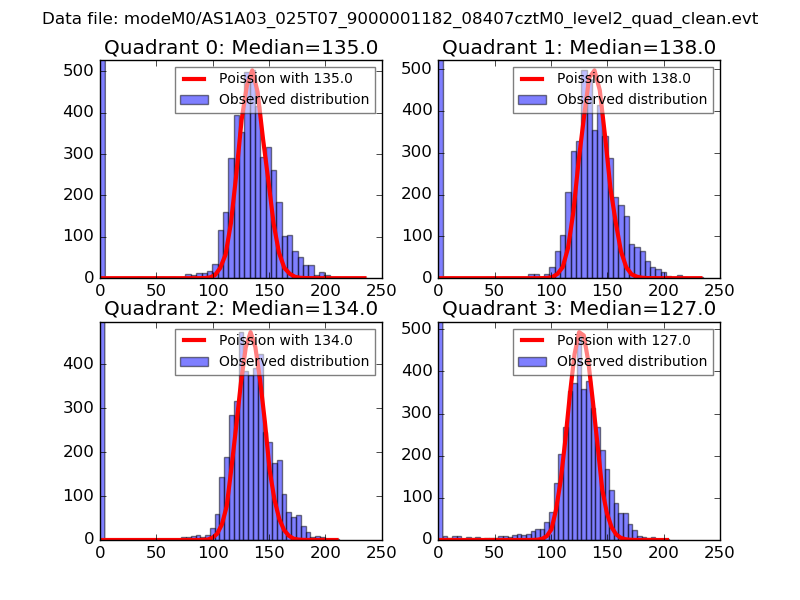
| Comparison with Poisson distribution Blue bars denote a histogram of data divided into 1 sec bins. Red curve is a Poisson curve with rate = median count rate of data. |
 |
 |
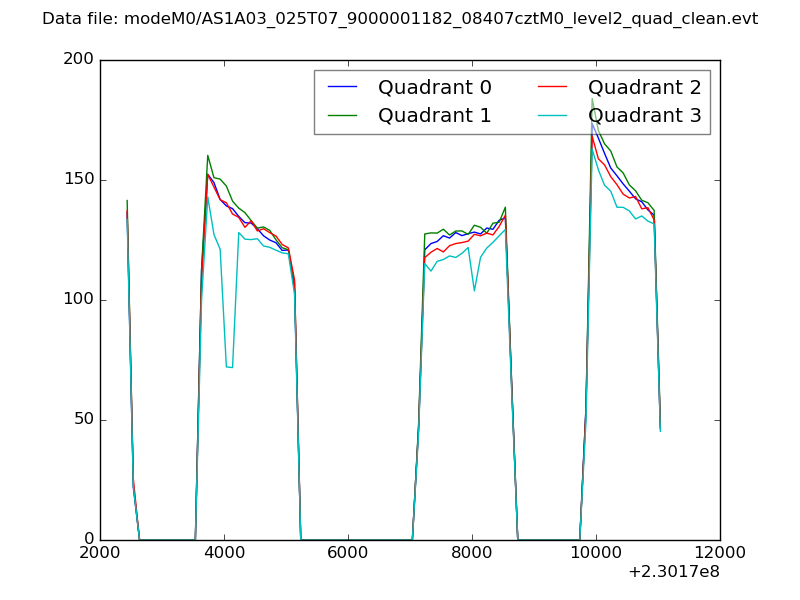
| Quadrant-wise count rates Data is divided into 100 sec bins |
 |
|
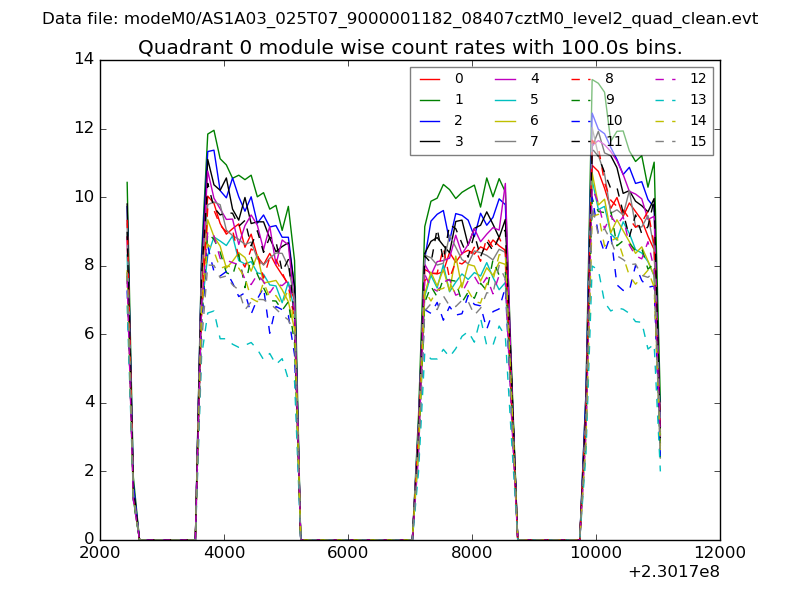
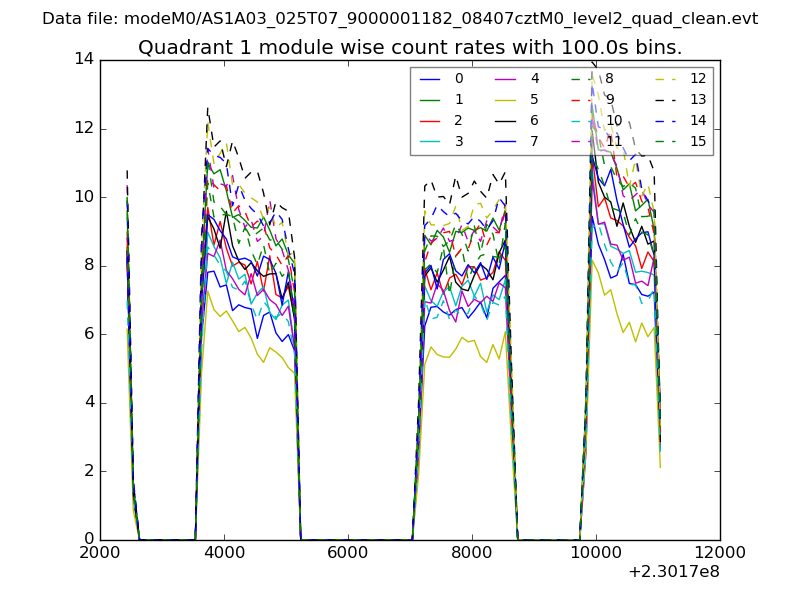
| Module-wise count rates for Quadrant A Data is divided into 100 sec bins |
 |
 |
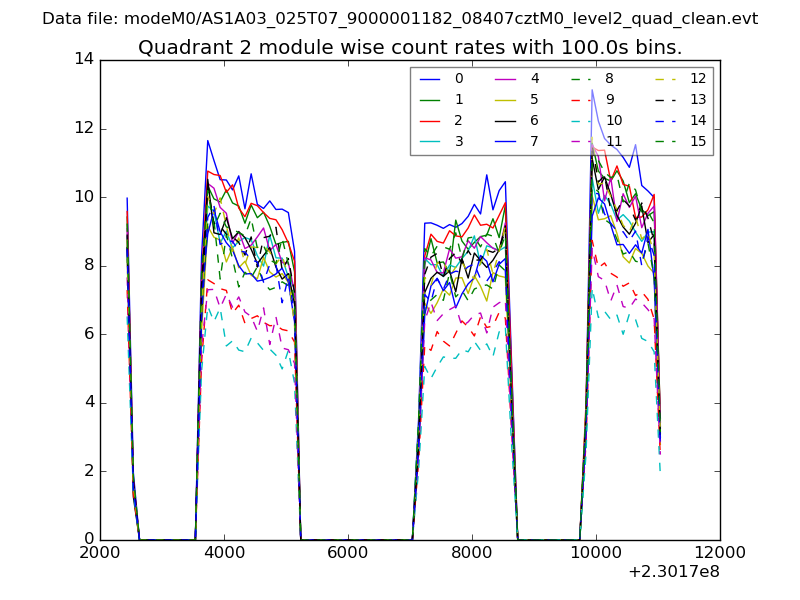
| Module-wise count rates for Quadrant B Data is divided into 100 sec bins |
 |
 |
| Module-wise count rates for Quadrant C Data is divided into 100 sec bins |
 |
 |
| Module-wise count rates for Quadrant D Data is divided into 100 sec bins |
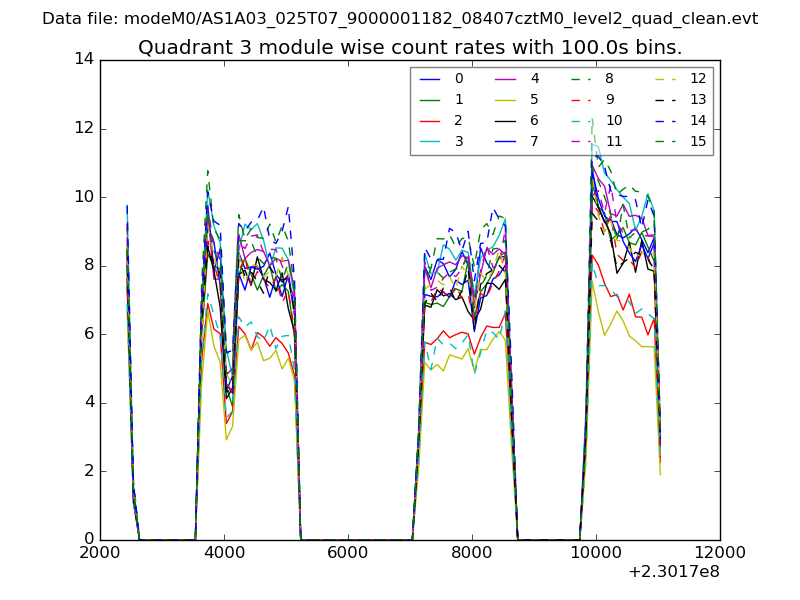 |
 |
| Parameter | Plot |
|---|---|
| CZT HV Monitor | 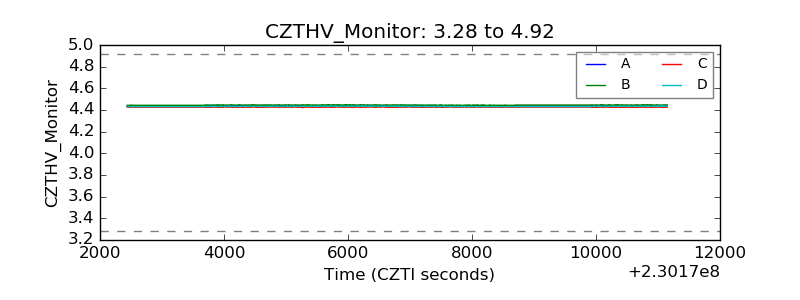 |
| D_VDD | 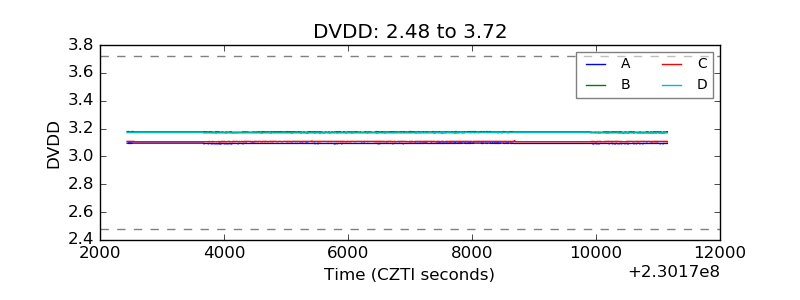 |
| Temperature 1 | 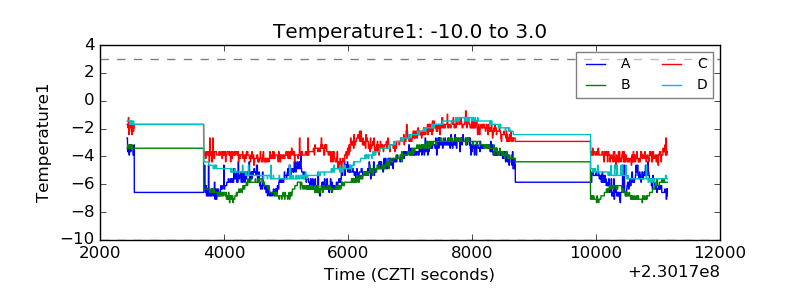 |
| Veto HV Monitor | 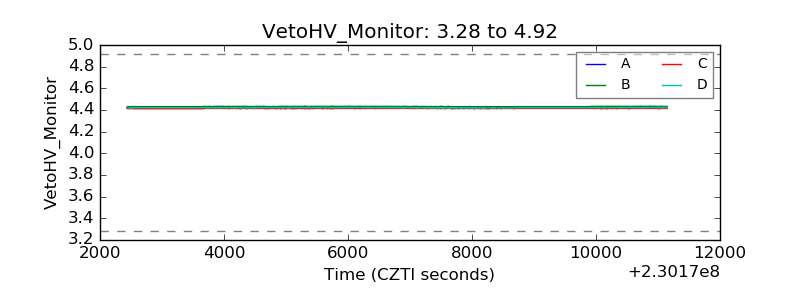 |
| Veto LLD | 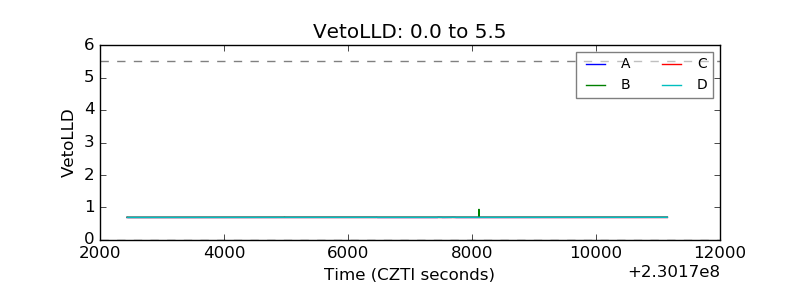 |
| Alpha Counter | 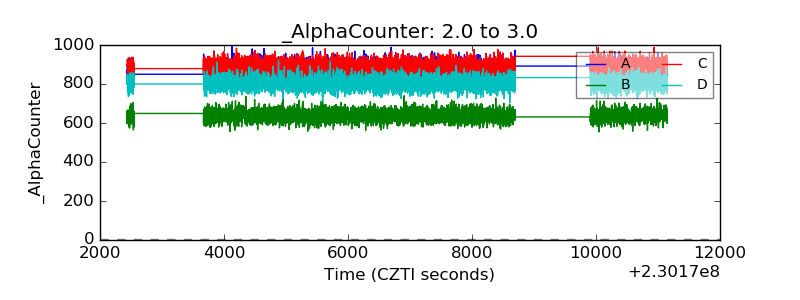 |
| _CPM_Rate | 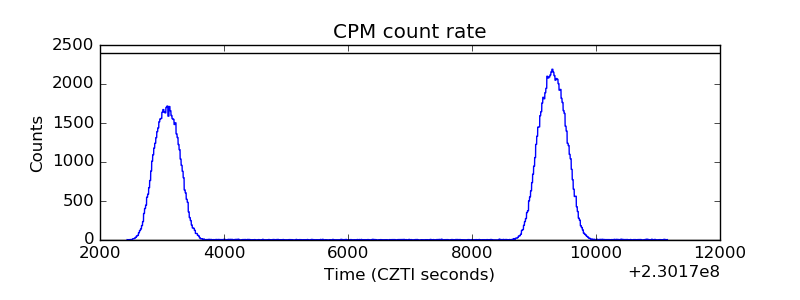 |
| CZT Counter | 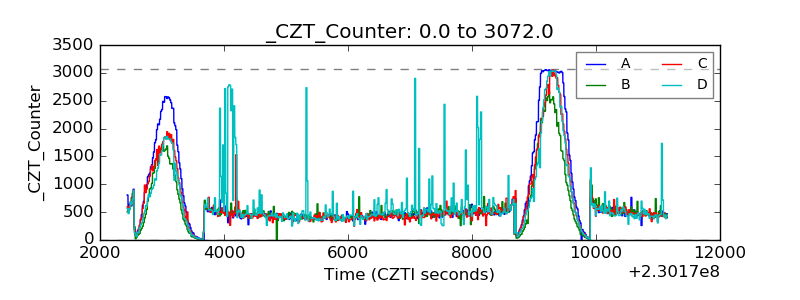 |
| +2.5 Volts monitor |  |
| +5 Volts monitor |  |
| _ROLL_ROT | 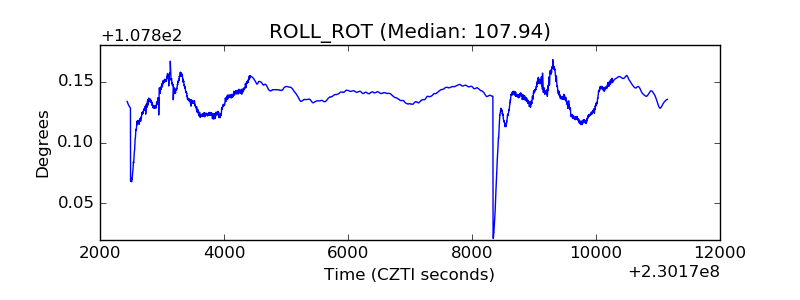 |
| _Roll_DEC | 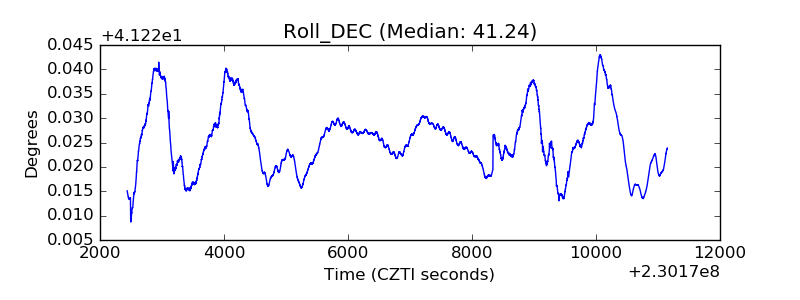 |
| _Roll_RA | 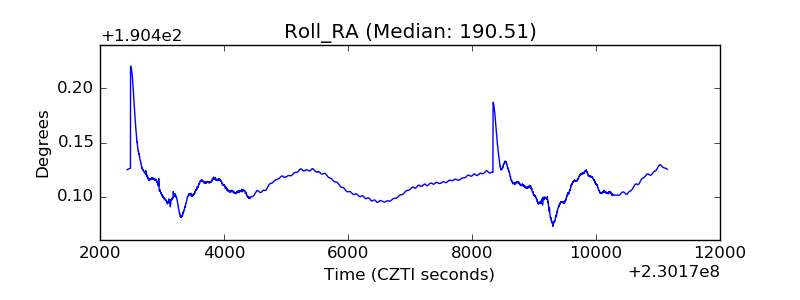 |
| Veto Counter | 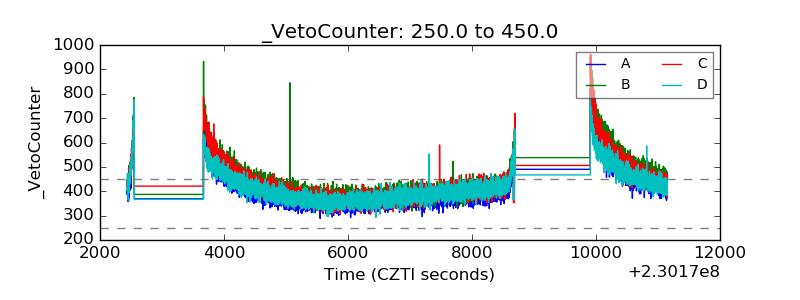 |