| Param | Original file | Final file |
|---|---|---|
| Filename | modeM0/AS1A03_025T07_9000001182_08409cztM0_level2.evt | modeM0/AS1A03_025T07_9000001182_08409cztM0_level2_quad_clean.evt |
| Size (bytes) | 455,846,400 | 76,674,240 |
| Size | 434.7 MB | 73.1 MB |
| Events in quadrant A | 3,286,361 | 476,980 |
| Events in quadrant B | 3,381,572 | 485,556 |
| Events in quadrant C | 3,069,946 | 465,965 |
| Events in quadrant D | 3,634,793 | 448,896 |
| Mode M9 | |||
|---|---|---|---|
| Quadrant | BADHDUFLAG | Total packets | Discarded packets |
| A | 0 | 23 | 0 |
| B | 0 | 23 | 0 |
| C | 0 | 23 | 0 |
| D | 0 | 24 | 0 |
| Mode SS | |||
|---|---|---|---|
| Quadrant | BADHDUFLAG | Total packets | Discarded packets |
| A | 0 | 130 | 0 |
| B | 0 | 130 | 0 |
| C | 0 | 130 | 0 |
| D | 0 | 130 | 0 |
| Mode M0 | |||
|---|---|---|---|
| Quadrant | BADHDUFLAG | Total packets | Discarded packets |
| A | 0 | 13573 | 3 |
| B | 0 | 13764 | 2 |
| C | 0 | 13144 | 2 |
| D | 0 | 14894 | 2 |
| Quadrant | Total seconds | Saturated seconds | Saturation percentage |
|---|---|---|---|
| A | 6365 | 52 | 0.816968% |
| B | 6365 | 49 | 0.769835% |
| C | 6365 | 22 | 0.345640% |
| D | 6365 | 183 | 2.875098% |
Noise dominated data is calculated using 1-second bins in cleaned event files. If a bin has >2000 counts, and if more than 50% of those come from <1% of pixels, then it is considered to be noise-dominated and hence unusable.
| Quadrant | # 1 sec bins | Bins with >0 counts | Bins with >2000 counts | High rate bins dominated by noise | Noise dominated (total time) | Noise dominated (detector-on time) | Marked lightcurve |
|---|---|---|---|---|---|---|---|
| A | 7715 | 6366 | 19 | 19 | 0.25% | 0.30% | 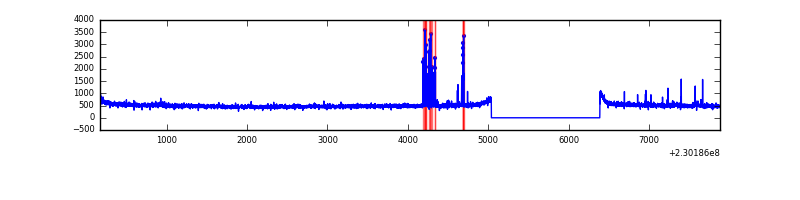 |
| B | 7715 | 6366 | 6 | 6 | 0.08% | 0.09% | 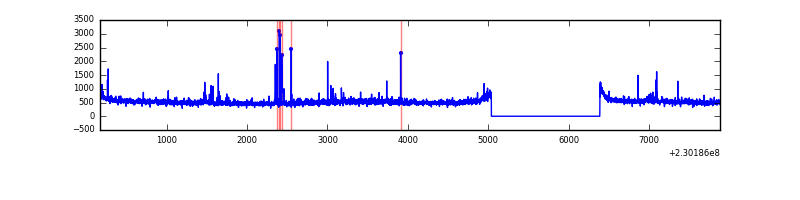 |
| C | 7715 | 6366 | 0 | 0 | 0.00% | 0.00% | 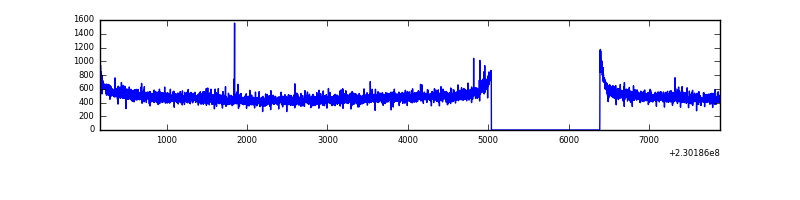 |
| D | 7715 | 6366 | 146 | 146 | 1.89% | 2.29% | 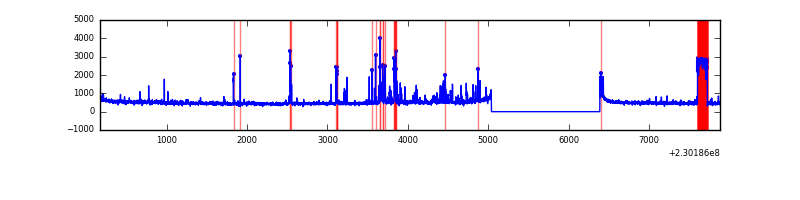 |
Top three noisy pixels from each quadrant. If the there are fewer than three noisy pixels in the level2.evt file, extra rows are filled as -1
| Pixel properties | Quadrant properties | ||||||
|---|---|---|---|---|---|---|---|
| Quadrant | DetID | PixID | Counts | Sigma | Mean | Median | Sigma |
| A | 4 | 2 | 127881 | 775.49 | 817 | 802 | 163.9 |
| A | 0 | 226 | 7703 | 42.11 | 817 | 802 | 163.9 |
| A | 12 | 194 | 7217 | 39.15 | 817 | 802 | 163.9 |
| B | 0 | 214 | 84345 | 544.07 | 822 | 804 | 153.5 |
| B | 4 | 81 | 71907 | 463.07 | 822 | 804 | 153.5 |
| B | 4 | 48 | 29307 | 185.63 | 822 | 804 | 153.5 |
| C | 1 | 16 | 10078 | 52.0 | 781 | 788 | 178.6 |
| C | 9 | 160 | 6283 | 30.76 | 781 | 788 | 178.6 |
| C | 13 | 61 | 5918 | 28.72 | 781 | 788 | 178.6 |
| D | 1 | 7 | 304010 | 1576.53 | 768 | 749 | 192.4 |
| D | 7 | 71 | 122940 | 635.22 | 768 | 749 | 192.4 |
| D | 12 | 221 | 69109 | 355.37 | 768 | 749 | 192.4 |
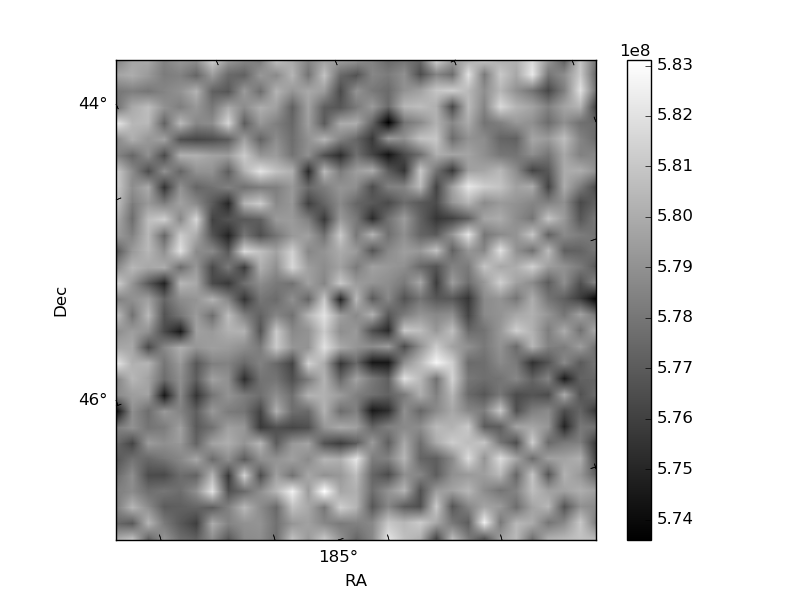
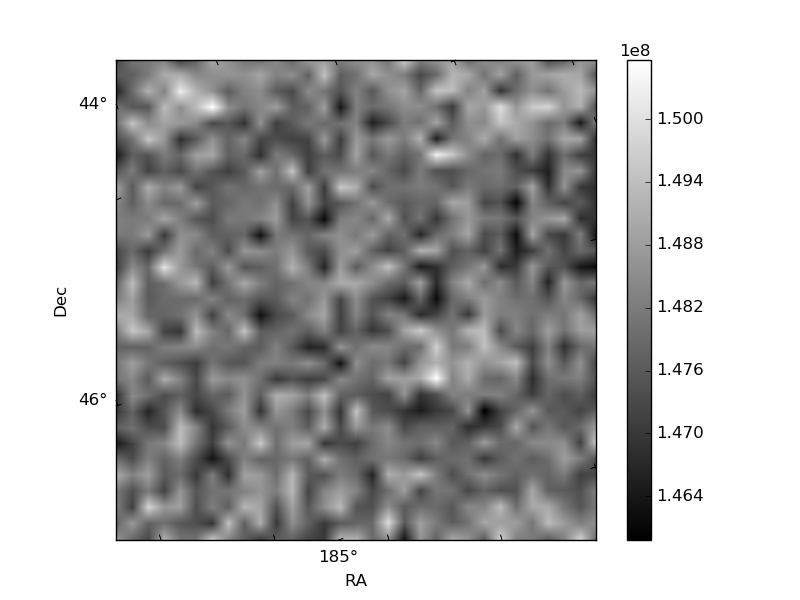
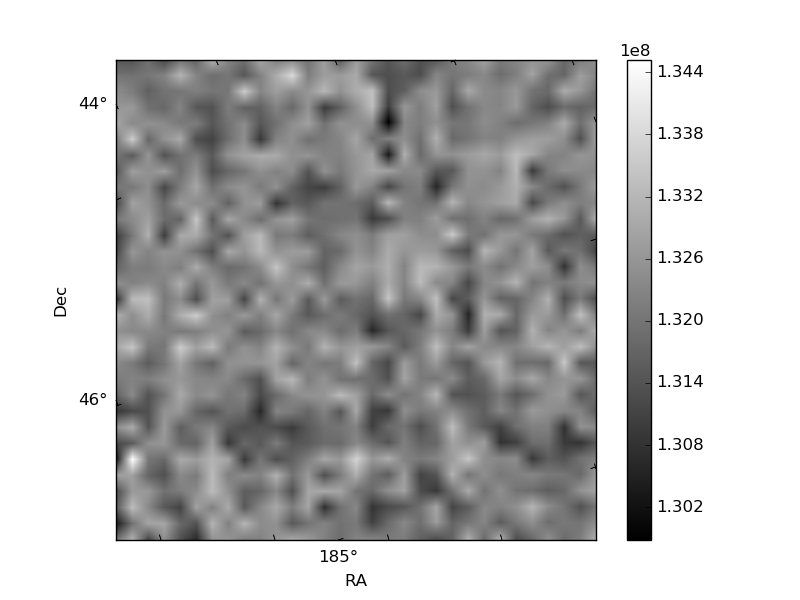
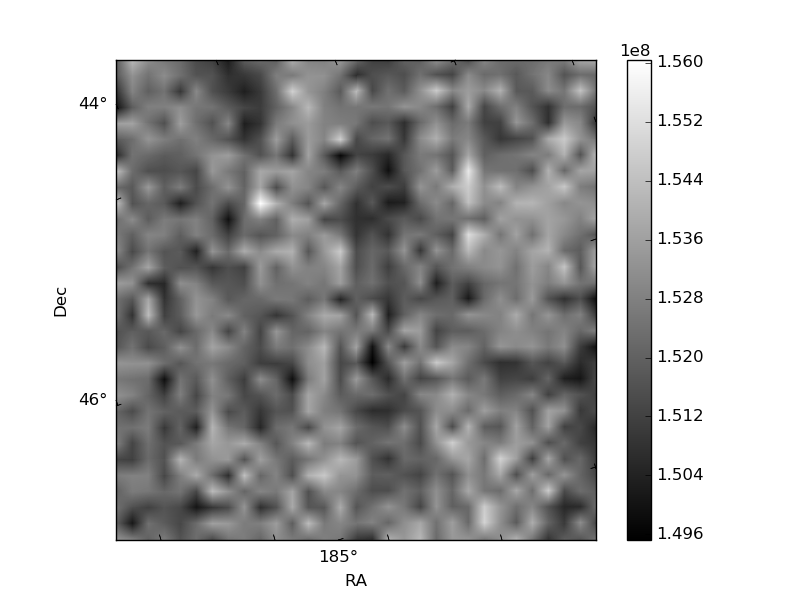
Histogram calculated using DETX and DETY for each event in the final _common_clean file
| Quadrant A | 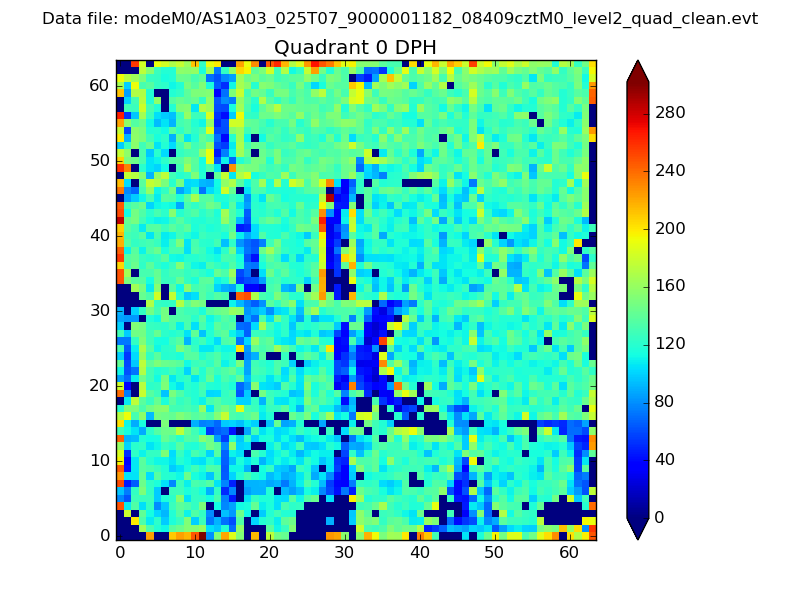 |
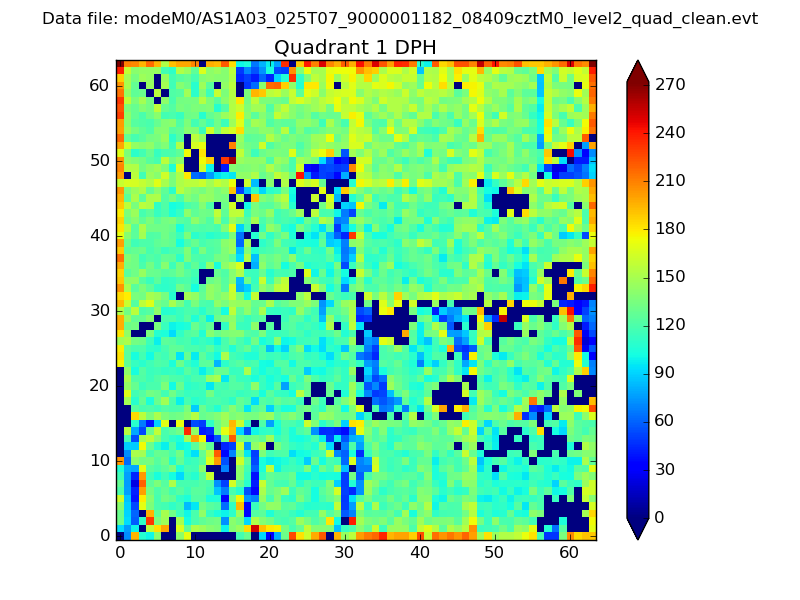 |
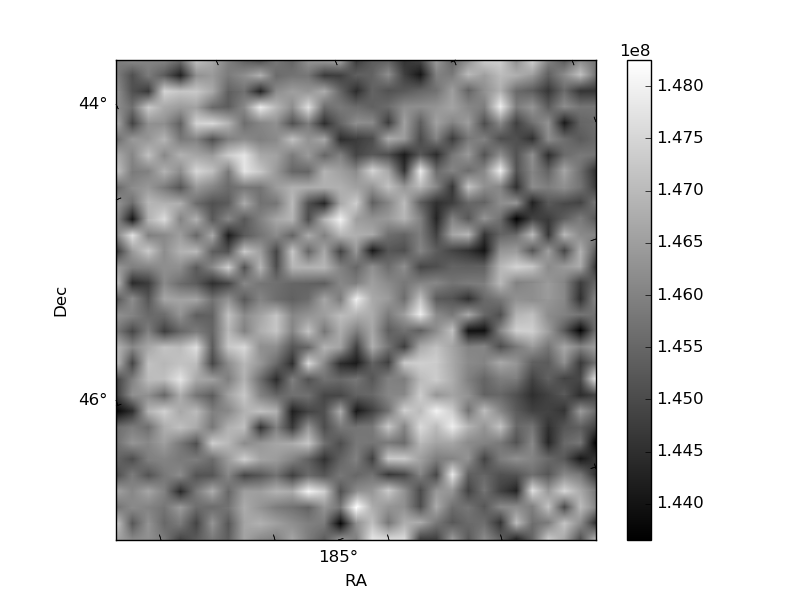
Quadrant B |
|---|---|---|---|
| Quadrant D | 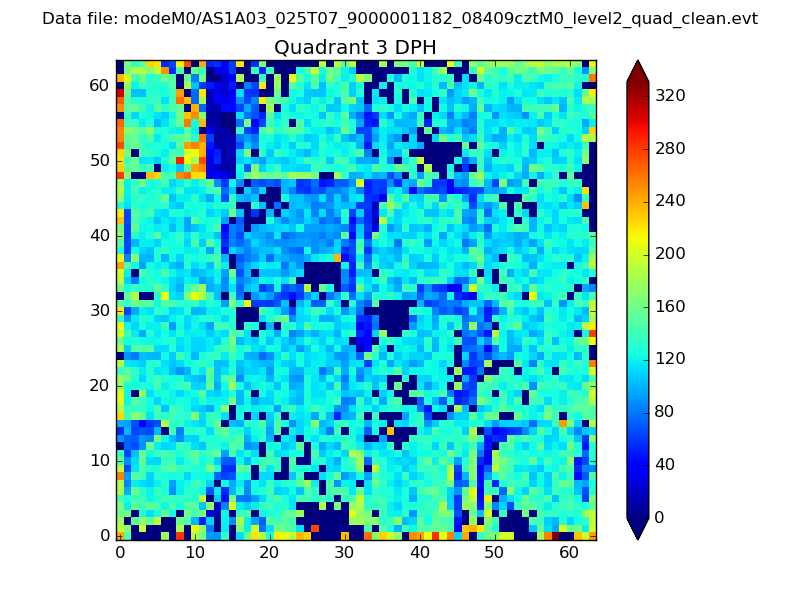 |
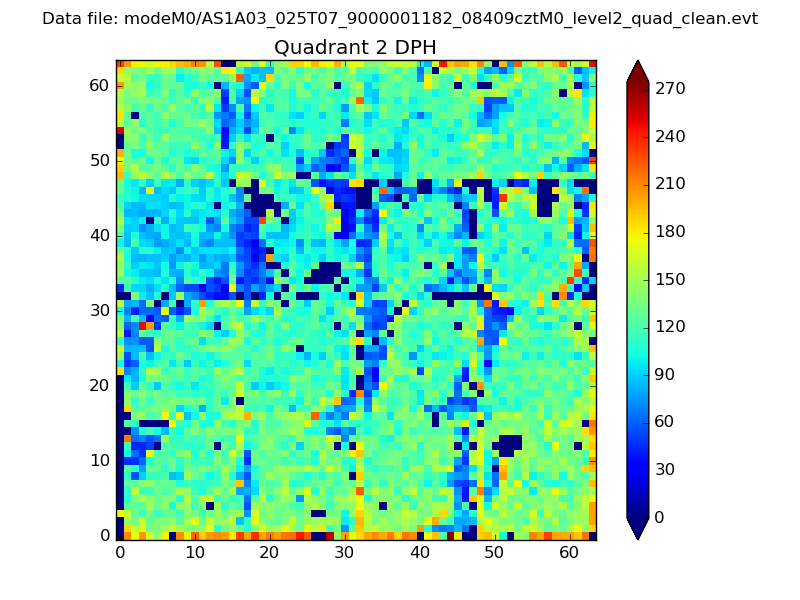 |
Quadrant C |
| Plot type | Count rate plots | Images |
|---|---|---|
| Comparison with Poisson distribution Blue bars denote a histogram of data divided into 1 sec bins. Red curve is a Poisson curve with rate = median count rate of data. |
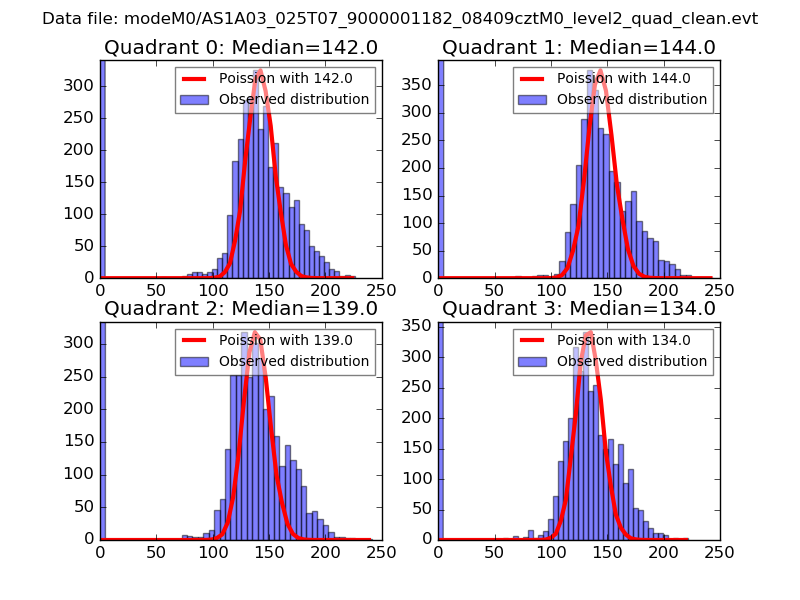 |
 |
| Quadrant-wise count rates Data is divided into 100 sec bins |
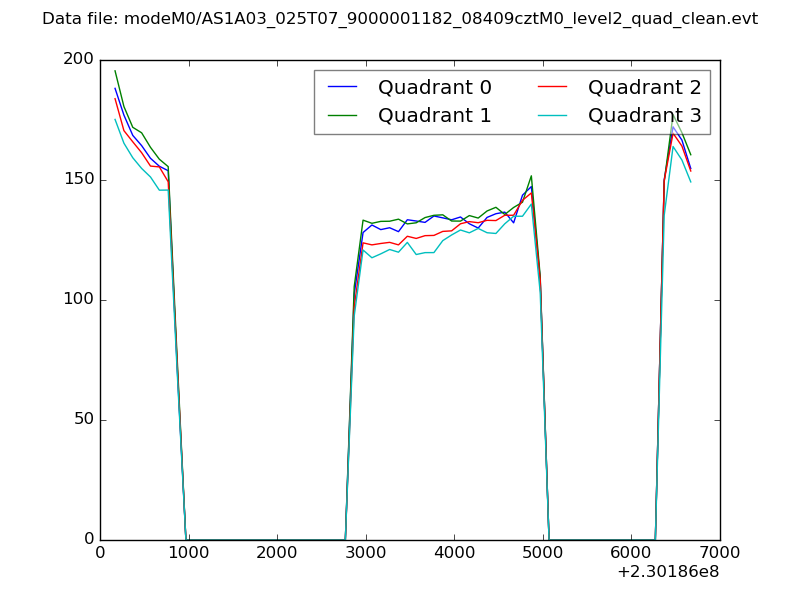 |
|
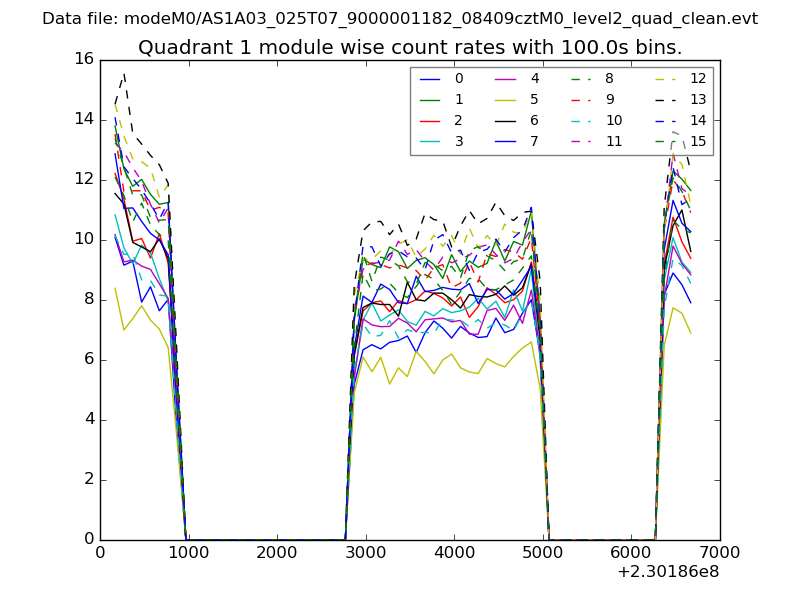
| Module-wise count rates for Quadrant A Data is divided into 100 sec bins |
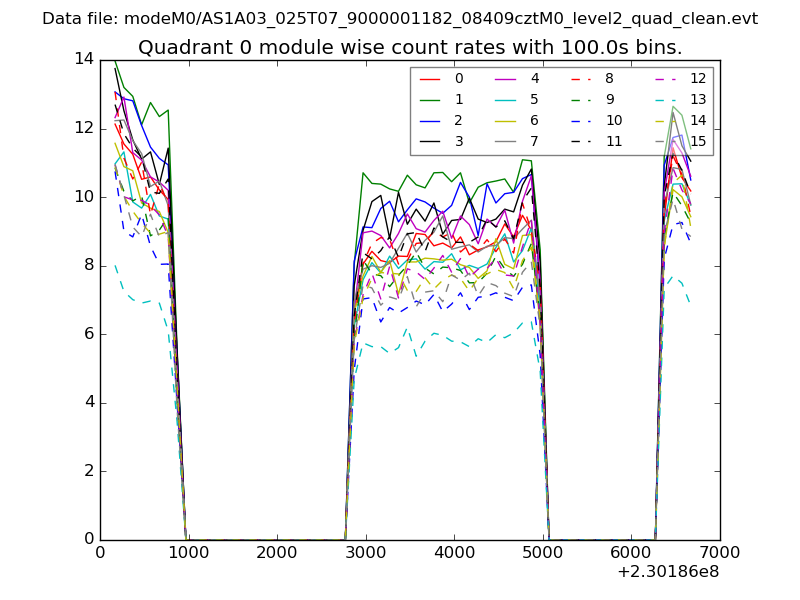 |
 |
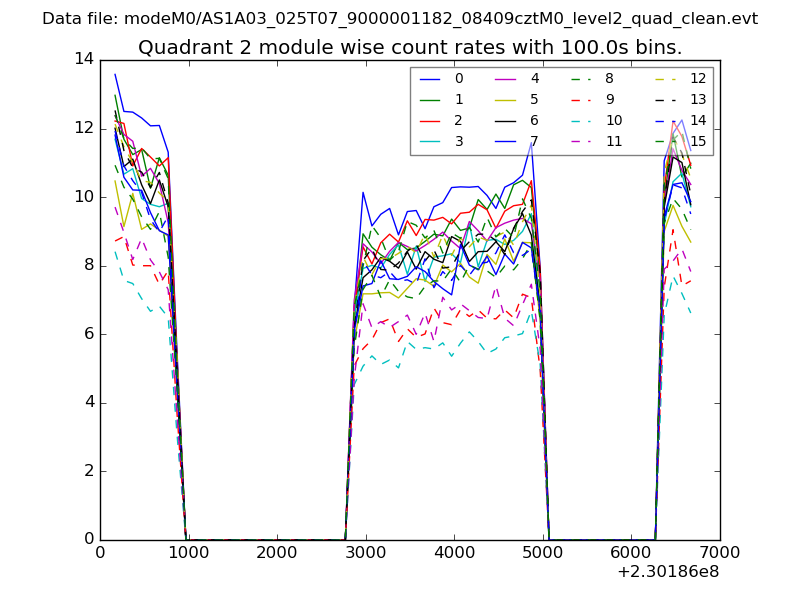
| Module-wise count rates for Quadrant B Data is divided into 100 sec bins |
 |
 |
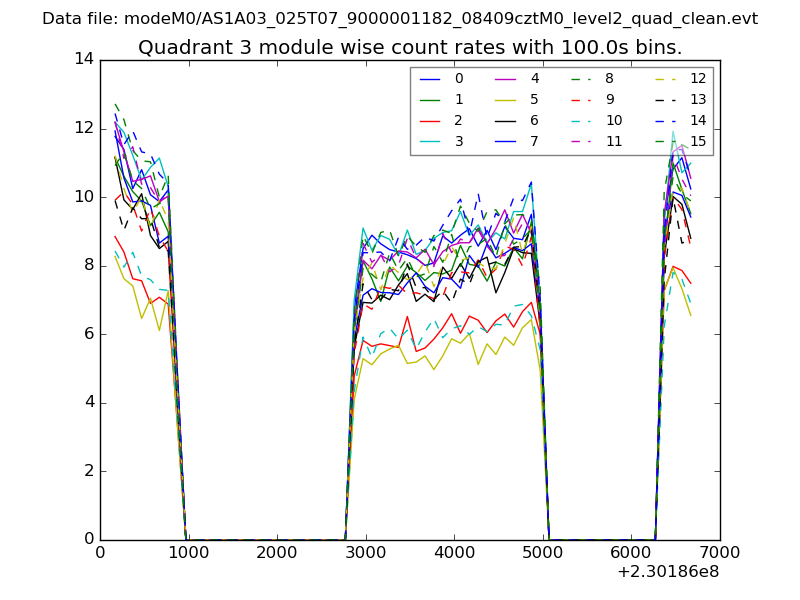
| Module-wise count rates for Quadrant C Data is divided into 100 sec bins |
 |
 |
| Module-wise count rates for Quadrant D Data is divided into 100 sec bins |
 |
 |
| Parameter | Plot |
|---|---|
| CZT HV Monitor | 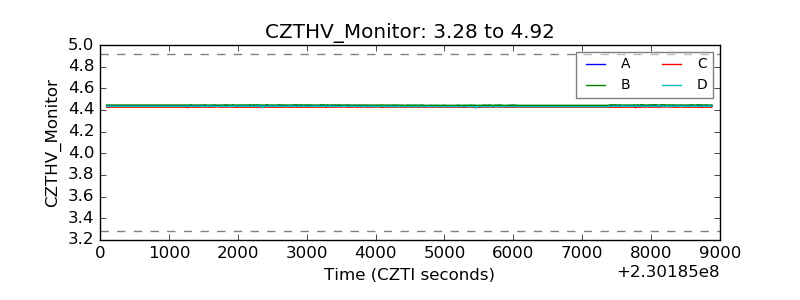 |
| D_VDD | 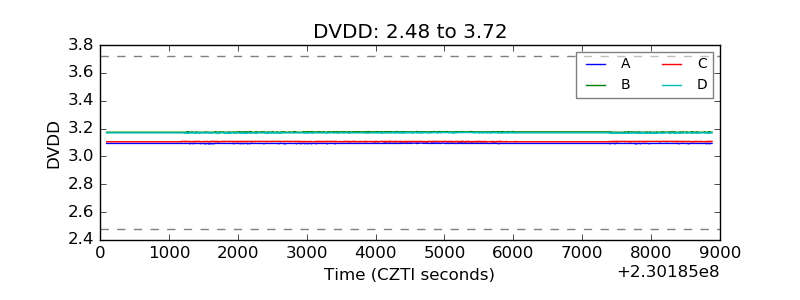 |
| Temperature 1 |  |
| Veto HV Monitor | 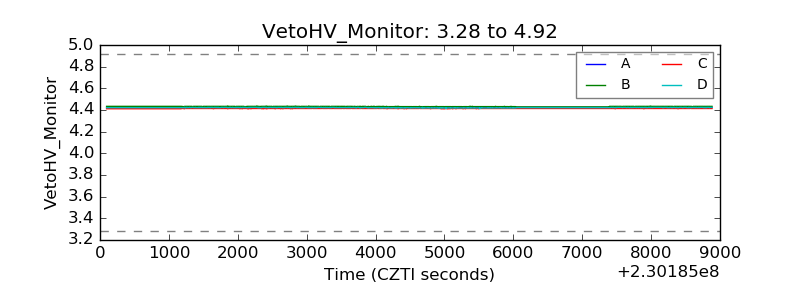 |
| Veto LLD |  |
| Alpha Counter | 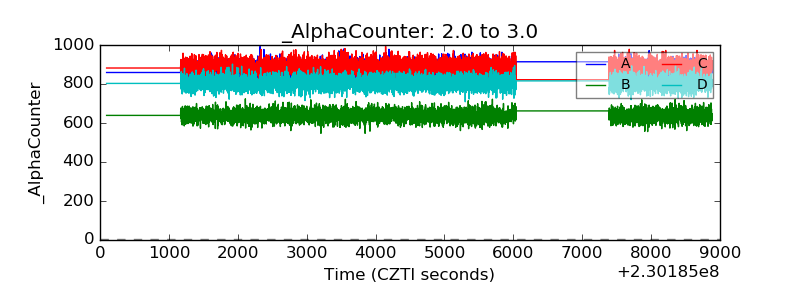 |
| _CPM_Rate | 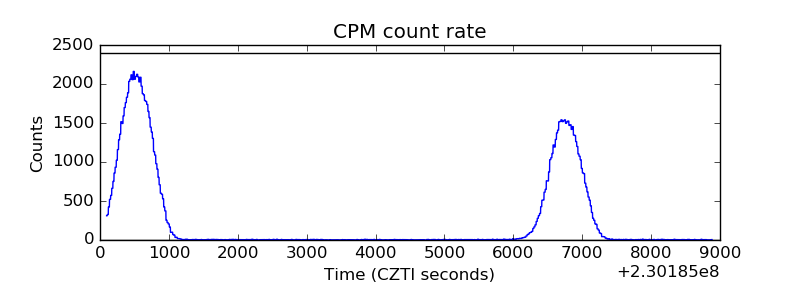 |
| CZT Counter | 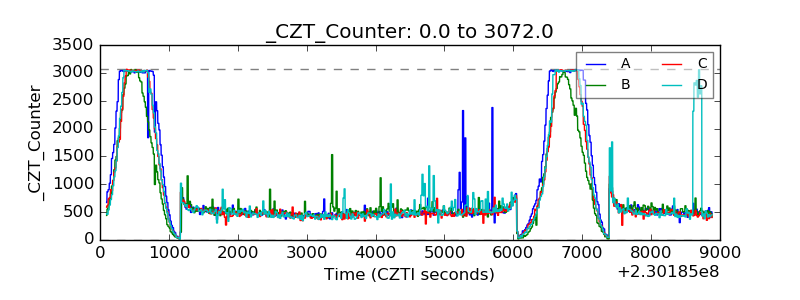 |
| +2.5 Volts monitor |  |
| +5 Volts monitor |  |
| _ROLL_ROT | 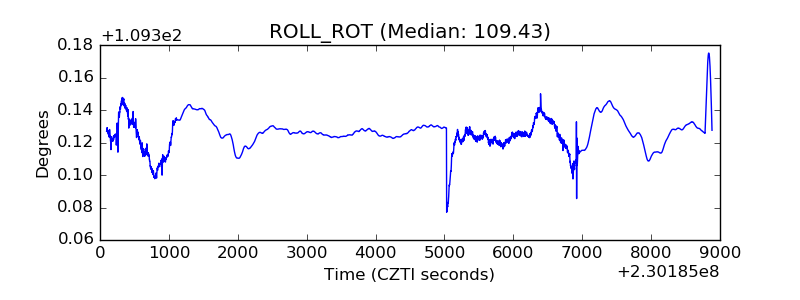 |
| _Roll_DEC | 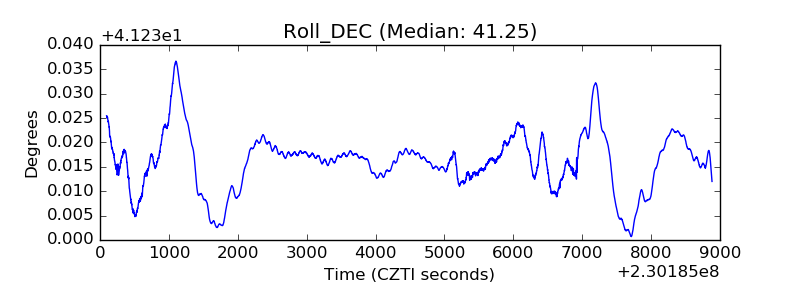 |
| _Roll_RA | 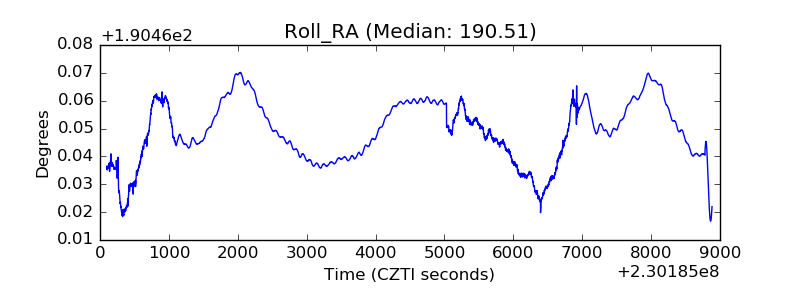 |
| Veto Counter | 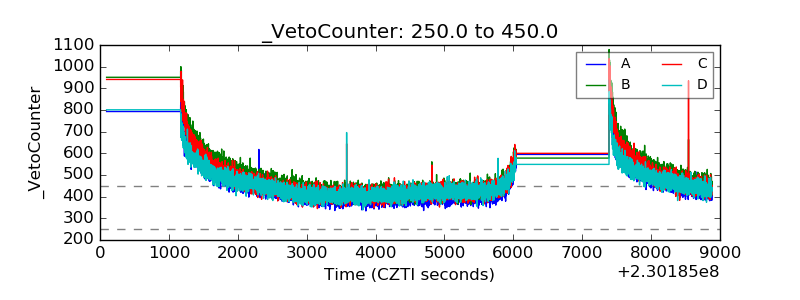 |