| Param | Original file | Final file |
|---|---|---|
| Filename | modeM0/AS1A03_025T07_9000001182_08412cztM0_level2.evt | modeM0/AS1A03_025T07_9000001182_08412cztM0_level2_quad_clean.evt |
| Size (bytes) | 477,259,200 | 86,492,160 |
| Size | 455.1 MB | 82.5 MB |
| Events in quadrant A | 3,426,388 | 534,738 |
| Events in quadrant B | 3,534,415 | 541,816 |
| Events in quadrant C | 3,292,603 | 527,842 |
| Events in quadrant D | 3,709,604 | 512,090 |
| Mode M9 | |||
|---|---|---|---|
| Quadrant | BADHDUFLAG | Total packets | Discarded packets |
| A | 0 | 15 | 0 |
| B | 0 | 15 | 0 |
| C | 0 | 15 | 0 |
| D | 0 | 15 | 0 |
| Mode SS | |||
|---|---|---|---|
| Quadrant | BADHDUFLAG | Total packets | Discarded packets |
| A | 0 | 148 | 0 |
| B | 0 | 148 | 0 |
| C | 0 | 148 | 0 |
| D | 0 | 148 | 0 |
| Mode M0 | |||
|---|---|---|---|
| Quadrant | BADHDUFLAG | Total packets | Discarded packets |
| A | 0 | 14955 | 3 |
| B | 0 | 15086 | 2 |
| C | 0 | 14783 | 2 |
| D | 0 | 16053 | 2 |
| Quadrant | Total seconds | Saturated seconds | Saturation percentage |
|---|---|---|---|
| A | 7213 | 182 | 2.523222% |
| B | 7213 | 187 | 2.592541% |
| C | 7213 | 132 | 1.830029% |
| D | 7213 | 184 | 2.550950% |
Noise dominated data is calculated using 1-second bins in cleaned event files. If a bin has >2000 counts, and if more than 50% of those come from <1% of pixels, then it is considered to be noise-dominated and hence unusable.
| Quadrant | # 1 sec bins | Bins with >0 counts | Bins with >2000 counts | High rate bins dominated by noise | Noise dominated (total time) | Noise dominated (detector-on time) | Marked lightcurve |
|---|---|---|---|---|---|---|---|
| A | 7853 | 7214 | 1 | 1 | 0.01% | 0.01% | 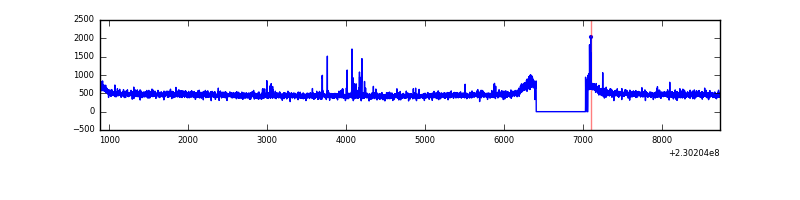 |
| B | 7853 | 7213 | 3 | 3 | 0.04% | 0.04% | 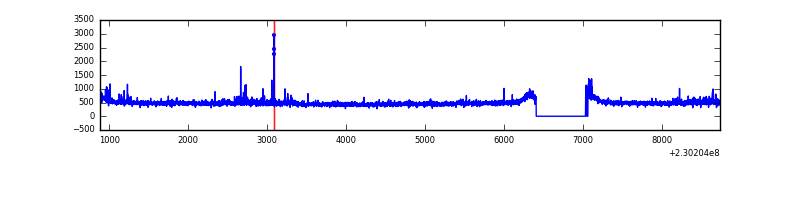 |
| C | 7853 | 7215 | 0 | 0 | 0.00% | 0.00% | 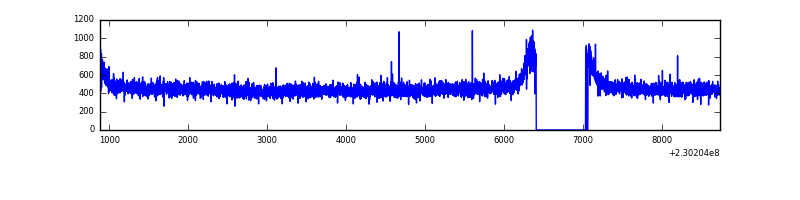 |
| D | 7853 | 7213 | 32 | 32 | 0.41% | 0.44% | 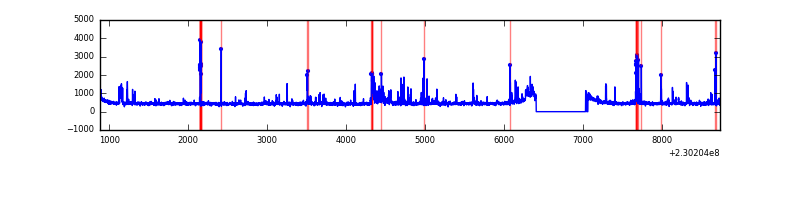 |
Top three noisy pixels from each quadrant. If the there are fewer than three noisy pixels in the level2.evt file, extra rows are filled as -1
| Pixel properties | Quadrant properties | ||||||
|---|---|---|---|---|---|---|---|
| Quadrant | DetID | PixID | Counts | Sigma | Mean | Median | Sigma |
| A | 13 | 251 | 31570 | 172.12 | 870 | 850 | 178.5 |
| A | 5 | 16 | 18370 | 98.16 | 870 | 850 | 178.5 |
| A | 14 | 111 | 17393 | 92.69 | 870 | 850 | 178.5 |
| B | 0 | 214 | 101064 | 599.48 | 871 | 849 | 167.2 |
| B | 4 | 173 | 18706 | 106.82 | 871 | 849 | 167.2 |
| B | 12 | 111 | 18496 | 105.56 | 871 | 849 | 167.2 |
| C | 13 | 61 | 6214 | 27.24 | 843 | 844 | 197.2 |
| C | 8 | 222 | 3545 | 13.7 | 843 | 844 | 197.2 |
| C | 3 | 202 | 2153 | 6.64 | 843 | 844 | 197.2 |
| D | 13 | 122 | 112413 | 510.78 | 835 | 814 | 218.5 |
| D | 7 | 71 | 102453 | 465.2 | 835 | 814 | 218.5 |
| D | 2 | 14 | 70136 | 317.28 | 835 | 814 | 218.5 |
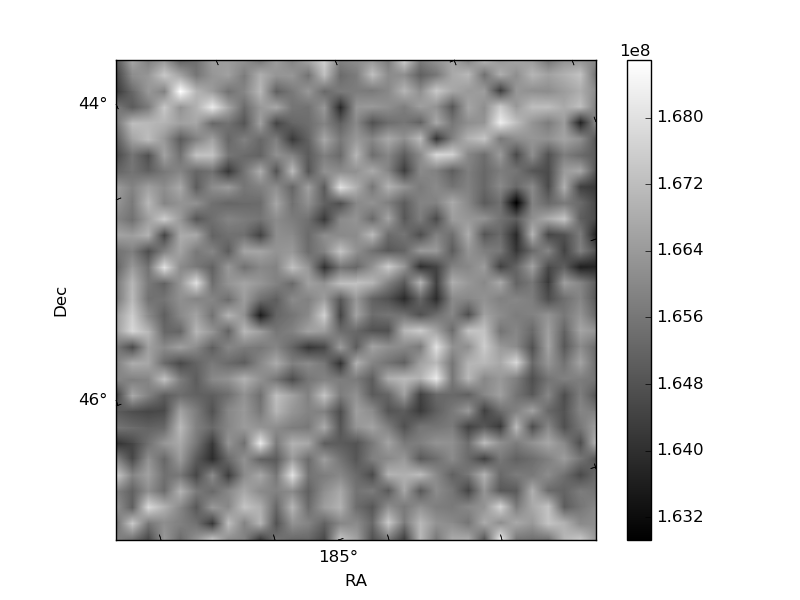
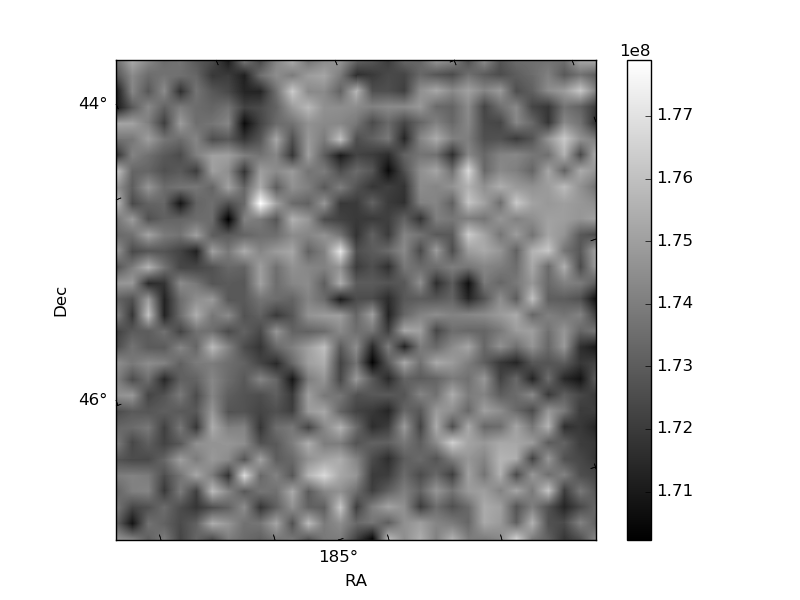
Histogram calculated using DETX and DETY for each event in the final _common_clean file
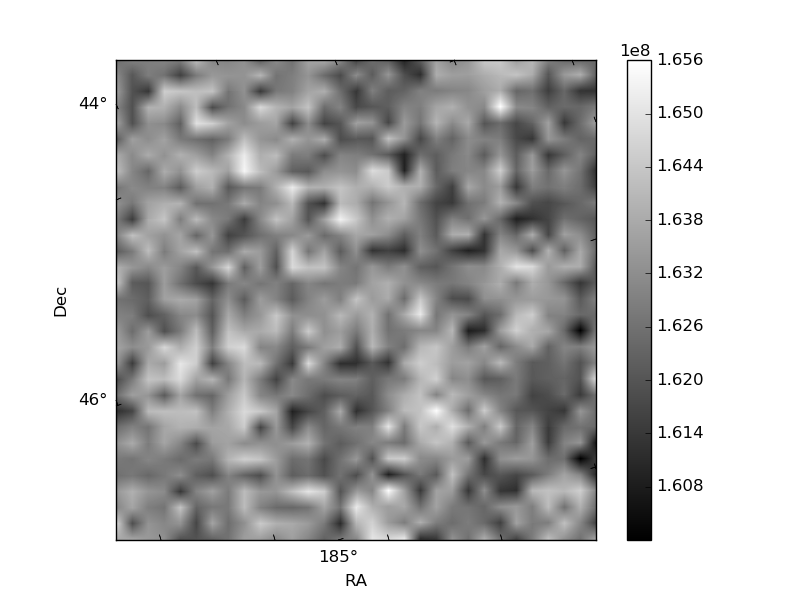
| Quadrant A | 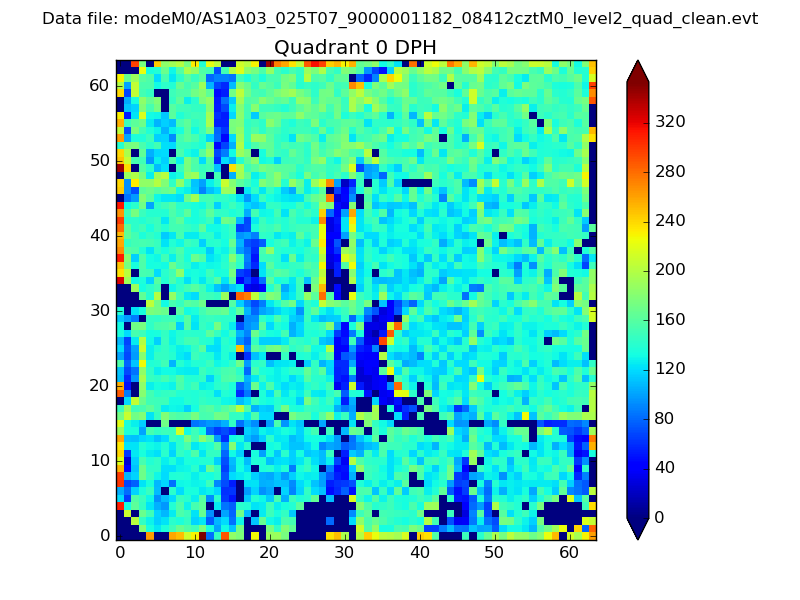 |
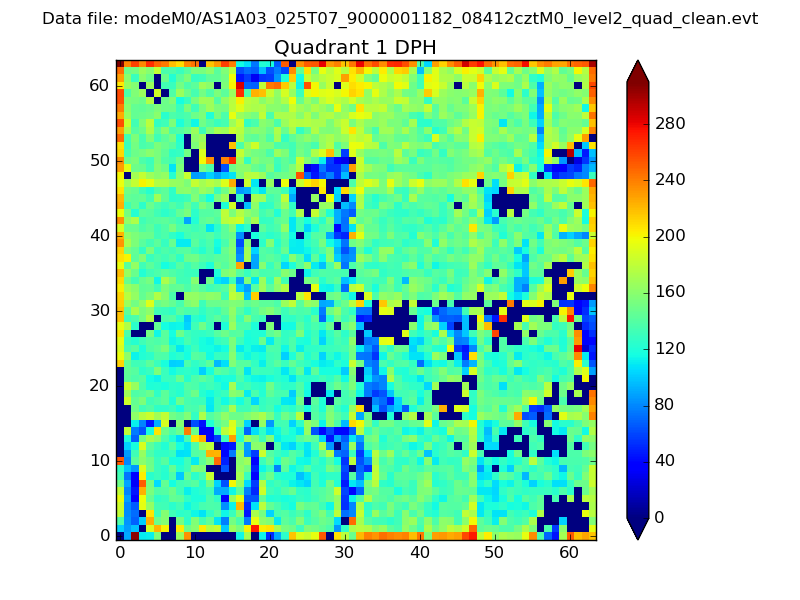 |
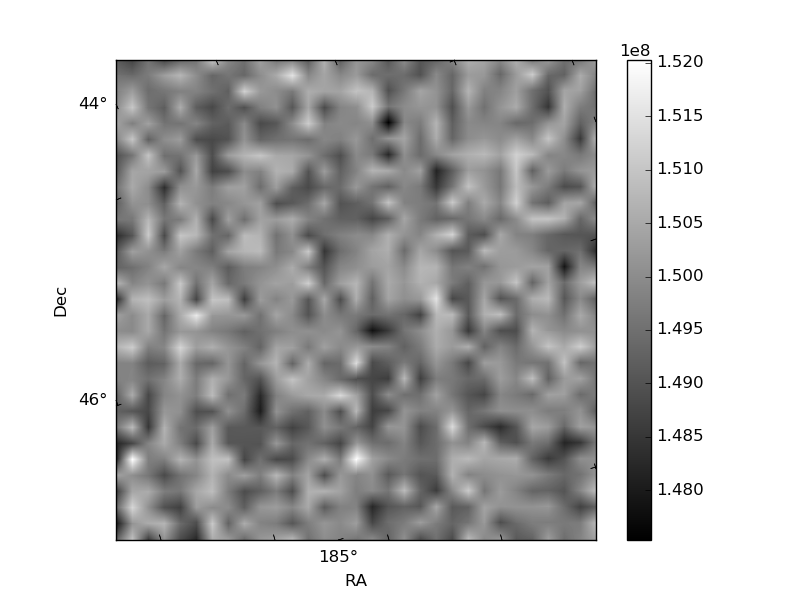
Quadrant B |
|---|---|---|---|
| Quadrant D | 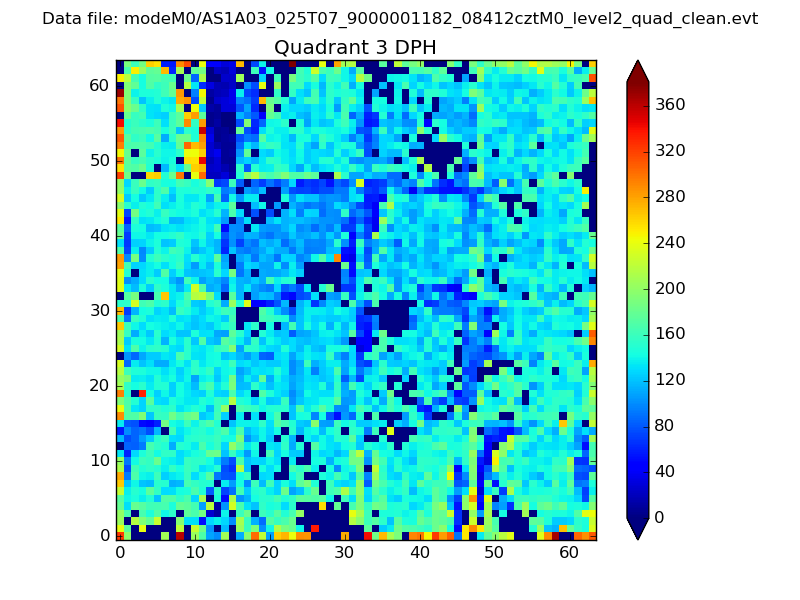 |
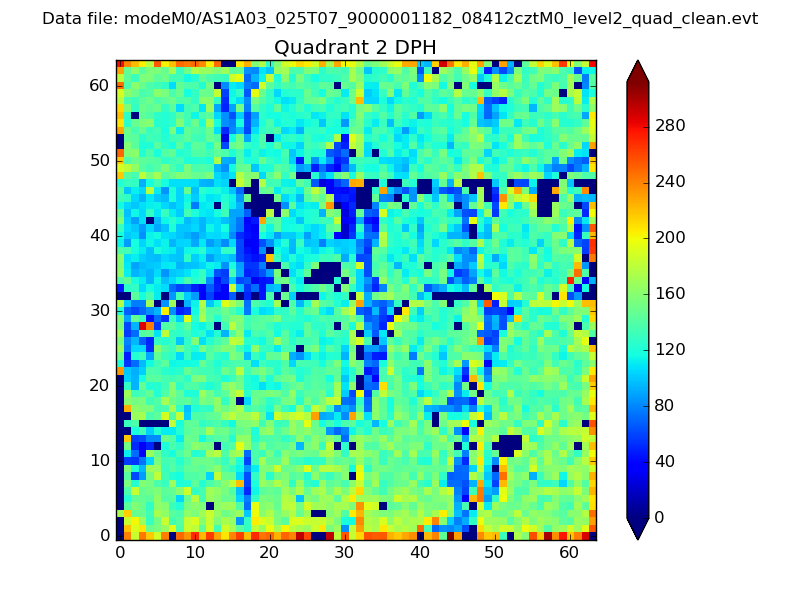 |
Quadrant C |
| Plot type | Count rate plots | Images |
|---|---|---|
| Comparison with Poisson distribution Blue bars denote a histogram of data divided into 1 sec bins. Red curve is a Poisson curve with rate = median count rate of data. |
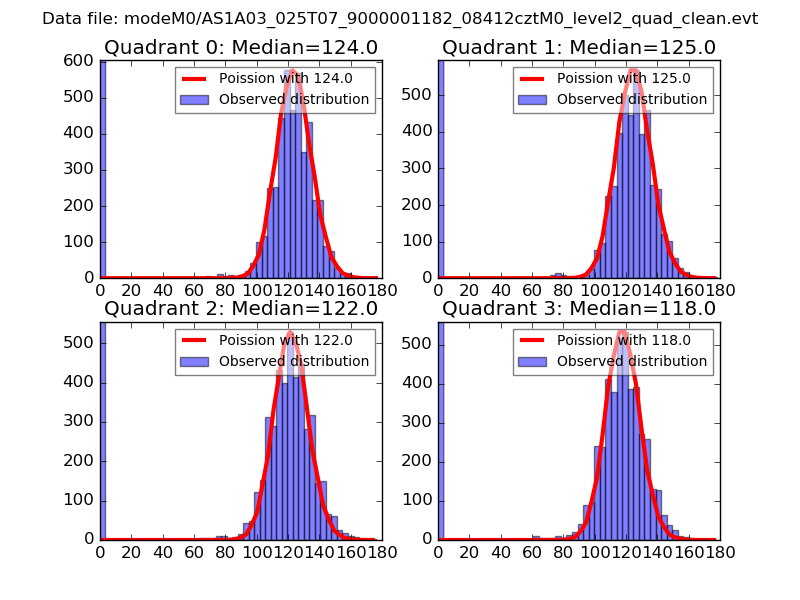 |
 |
| Quadrant-wise count rates Data is divided into 100 sec bins |
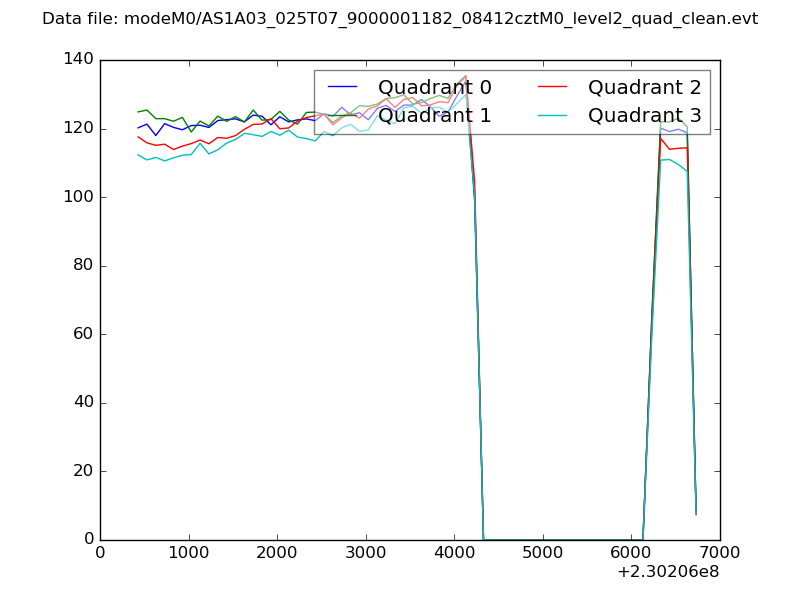 |
|
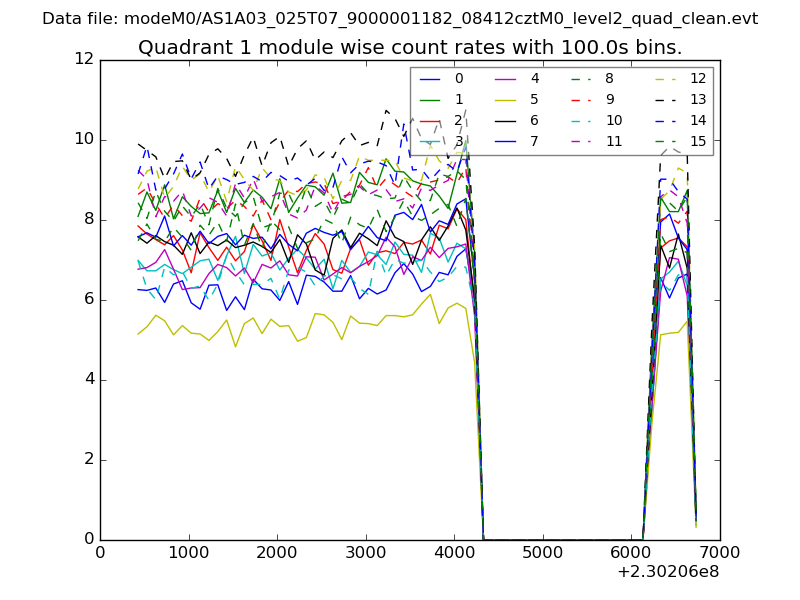
| Module-wise count rates for Quadrant A Data is divided into 100 sec bins |
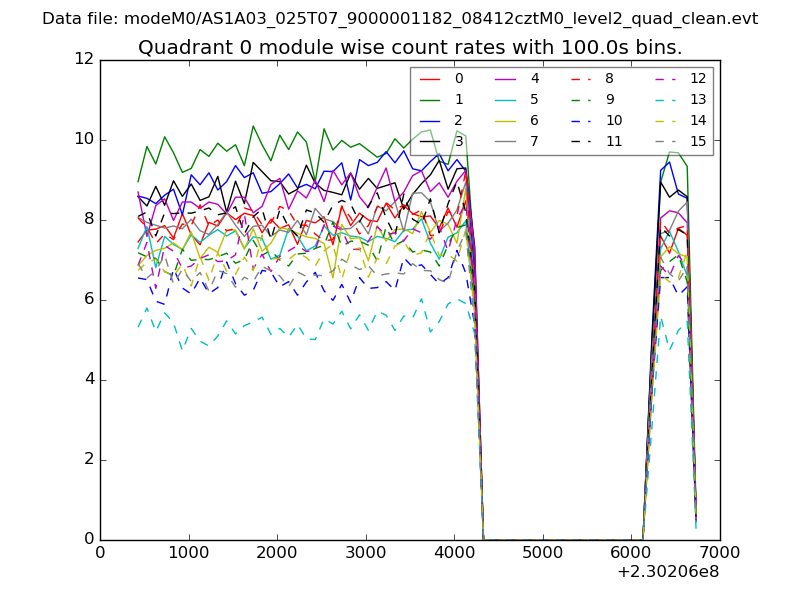 |
 |
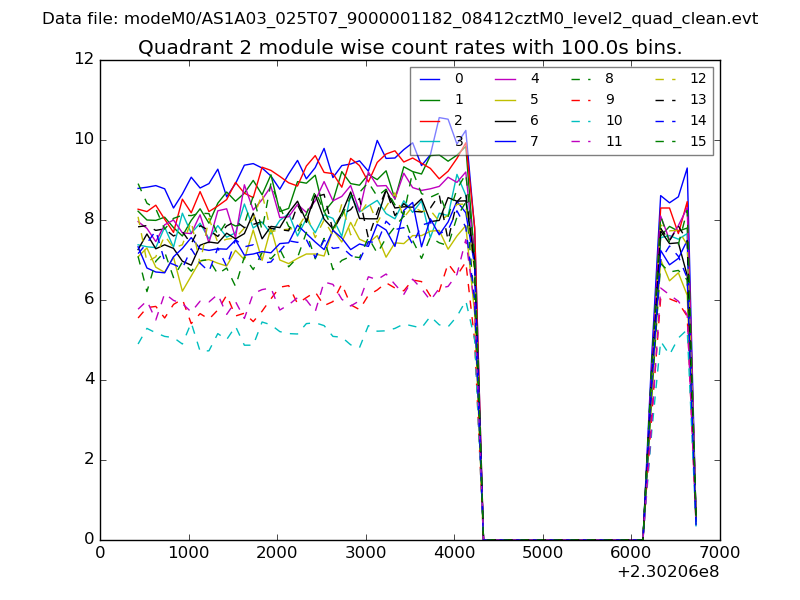
| Module-wise count rates for Quadrant B Data is divided into 100 sec bins |
 |
 |
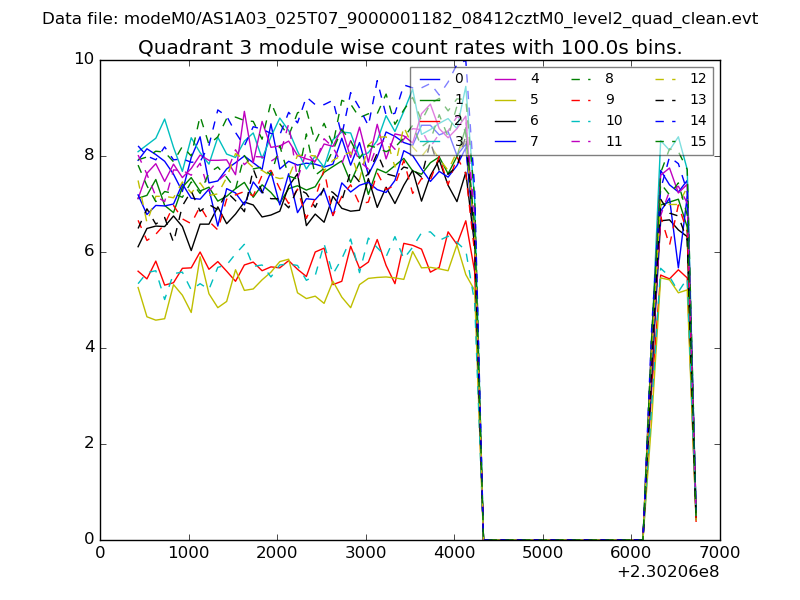
| Module-wise count rates for Quadrant C Data is divided into 100 sec bins |
 |
 |
| Module-wise count rates for Quadrant D Data is divided into 100 sec bins |
 |
 |
| Parameter | Plot |
|---|---|
| CZT HV Monitor | 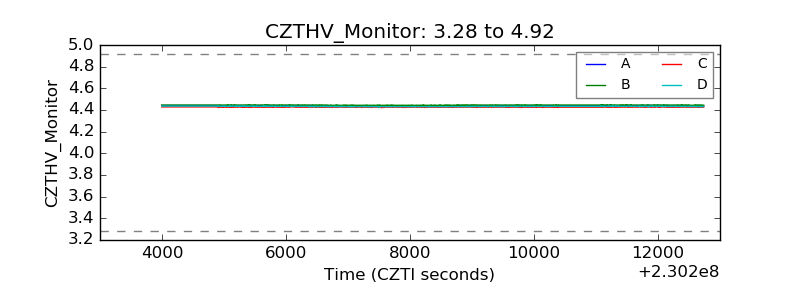 |
| D_VDD |  |
| Temperature 1 | 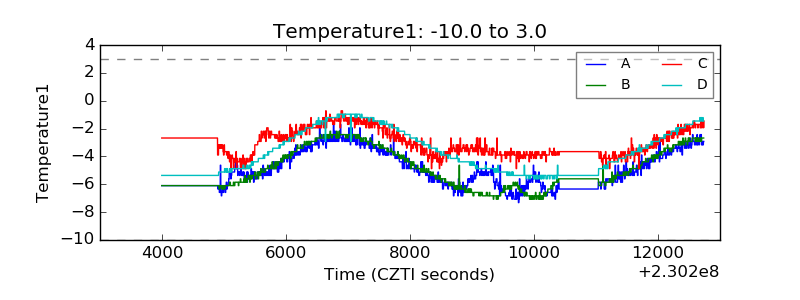 |
| Veto HV Monitor | 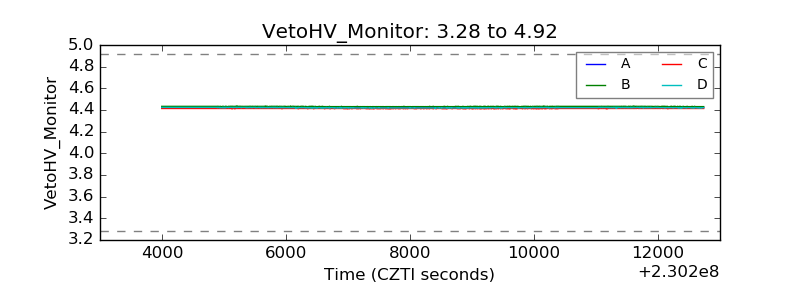 |
| Veto LLD | 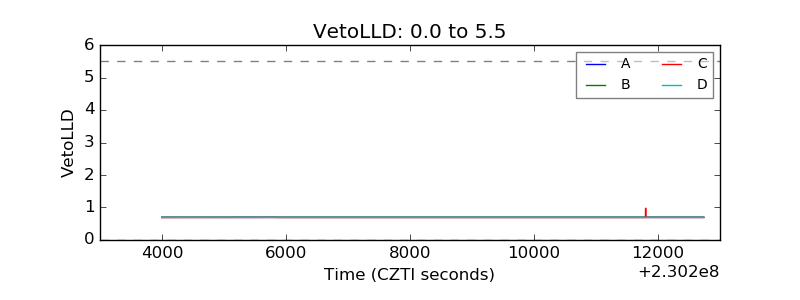 |
| Alpha Counter | 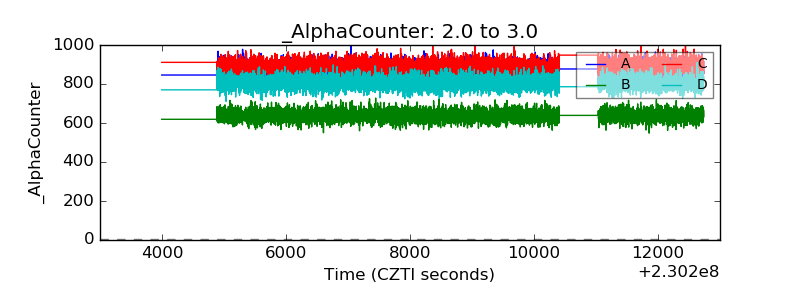 |
| _CPM_Rate | 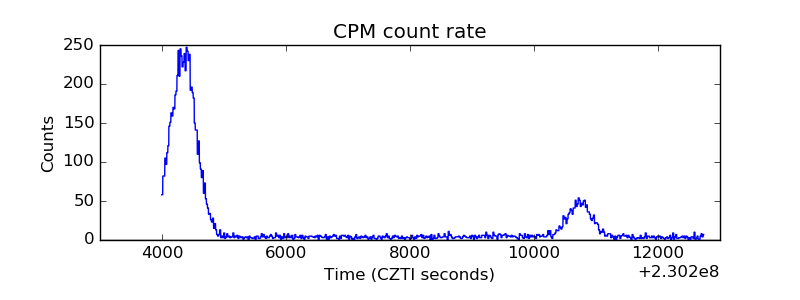 |
| CZT Counter | 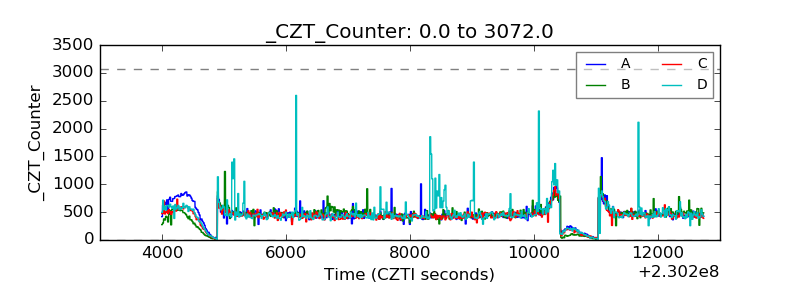 |
| +2.5 Volts monitor |  |
| +5 Volts monitor |  |
| _ROLL_ROT | 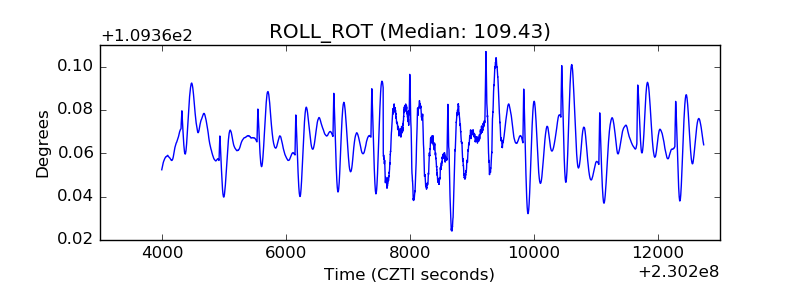 |
| _Roll_DEC | 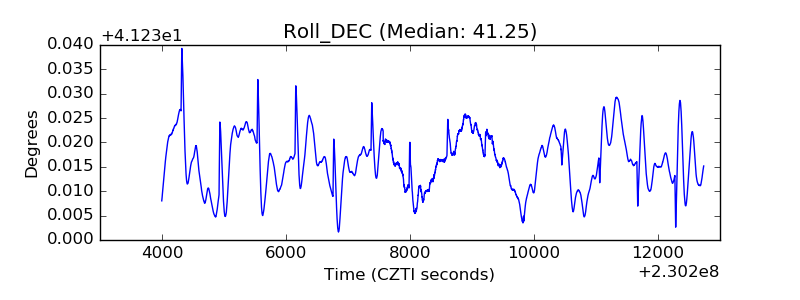 |
| _Roll_RA | 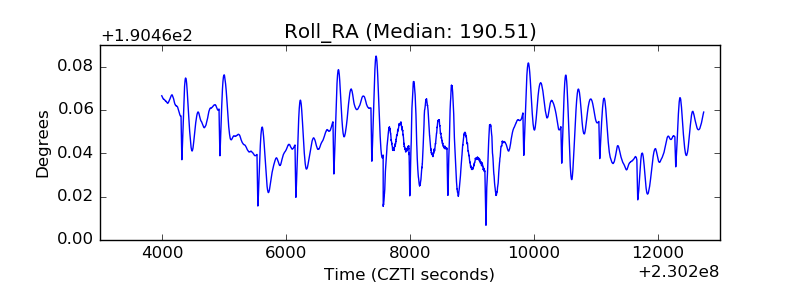 |
| Veto Counter | 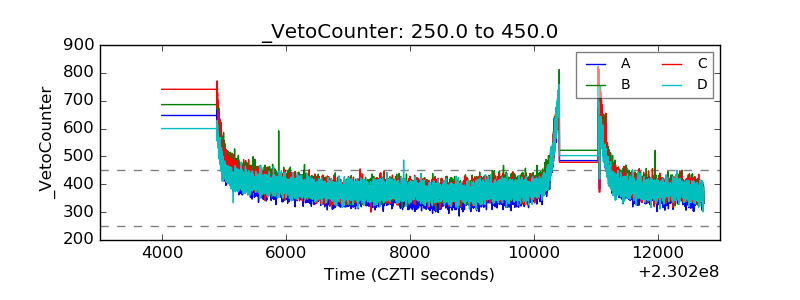 |