| Param | Original file | Final file |
|---|---|---|
| Filename | modeM0/AS1A03_025T07_9000001182_08413cztM0_level2.evt | modeM0/AS1A03_025T07_9000001182_08413cztM0_level2_quad_clean.evt |
| Size (bytes) | 178,439,040 | 36,339,840 |
| Size | 170.2 MB | 34.7 MB |
| Events in quadrant A | 1,254,792 | 230,189 |
| Events in quadrant B | 1,330,044 | 231,245 |
| Events in quadrant C | 1,210,430 | 223,112 |
| Events in quadrant D | 1,415,119 | 214,372 |
| Mode SS | |||
|---|---|---|---|
| Quadrant | BADHDUFLAG | Total packets | Discarded packets |
| A | 0 | 56 | 0 |
| B | 0 | 56 | 0 |
| C | 0 | 56 | 0 |
| D | 0 | 56 | 0 |
| Mode M0 | |||
|---|---|---|---|
| Quadrant | BADHDUFLAG | Total packets | Discarded packets |
| A | 0 | 5641 | 0 |
| B | 0 | 5769 | 0 |
| C | 0 | 5633 | 0 |
| D | 0 | 6136 | 0 |
| Quadrant | Total seconds | Saturated seconds | Saturation percentage |
|---|---|---|---|
| A | 2814 | 2 | 0.071073% |
| B | 2814 | 5 | 0.177683% |
| C | 2814 | 1 | 0.035537% |
| D | 2814 | 29 | 1.030561% |
Noise dominated data is calculated using 1-second bins in cleaned event files. If a bin has >2000 counts, and if more than 50% of those come from <1% of pixels, then it is considered to be noise-dominated and hence unusable.
| Quadrant | # 1 sec bins | Bins with >0 counts | Bins with >2000 counts | High rate bins dominated by noise | Noise dominated (total time) | Noise dominated (detector-on time) | Marked lightcurve |
|---|---|---|---|---|---|---|---|
| A | 2814 | 2814 | 0 | 0 | 0.00% | 0.00% |  |
| B | 2814 | 2814 | 1 | 1 | 0.04% | 0.04% | 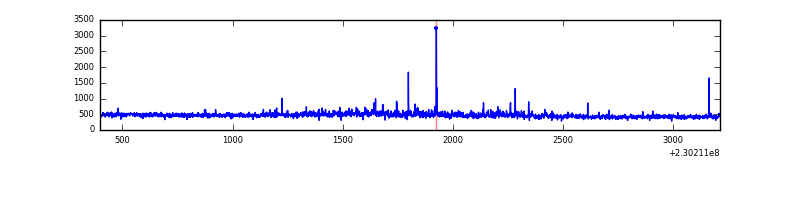 |
| C | 2814 | 2814 | 0 | 0 | 0.00% | 0.00% | 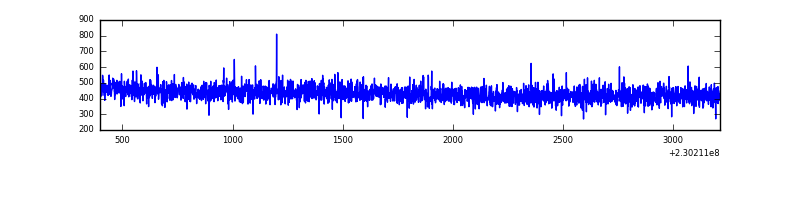 |
| D | 2814 | 2814 | 22 | 22 | 0.78% | 0.78% | 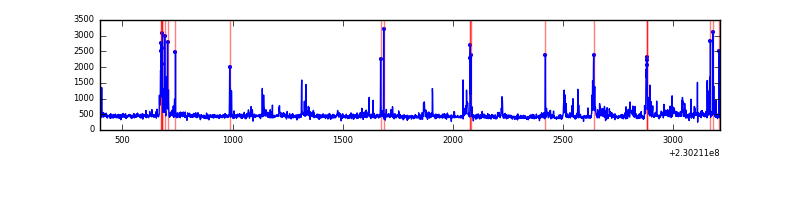 |
Top three noisy pixels from each quadrant. If the there are fewer than three noisy pixels in the level2.evt file, extra rows are filled as -1
| Pixel properties | Quadrant properties | ||||||
|---|---|---|---|---|---|---|---|
| Quadrant | DetID | PixID | Counts | Sigma | Mean | Median | Sigma |
| A | 15 | 236 | 5399 | 74.46 | 324 | 316 | 68.3 |
| A | 0 | 226 | 3055 | 40.12 | 324 | 316 | 68.3 |
| A | 12 | 194 | 2856 | 37.21 | 324 | 316 | 68.3 |
| B | 0 | 214 | 68731 | 1090.52 | 321 | 313 | 62.7 |
| B | 12 | 111 | 6630 | 100.69 | 321 | 313 | 62.7 |
| B | 11 | 111 | 5421 | 81.42 | 321 | 313 | 62.7 |
| C | 13 | 61 | 2220 | 26.0 | 309 | 311 | 73.4 |
| C | 8 | 222 | 1214 | 12.3 | 309 | 311 | 73.4 |
| C | 10 | 169 | 992 | 9.28 | 309 | 311 | 73.4 |
| D | 4 | 95 | 155226 | 1982.73 | 313 | 302 | 78.1 |
| D | 7 | 71 | 37104 | 470.99 | 313 | 302 | 78.1 |
| D | 12 | 233 | 22509 | 284.2 | 313 | 302 | 78.1 |
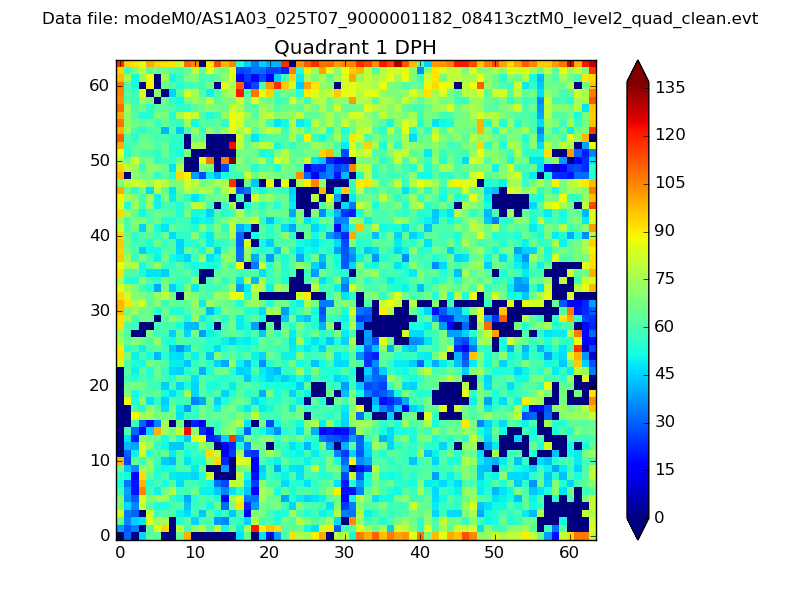
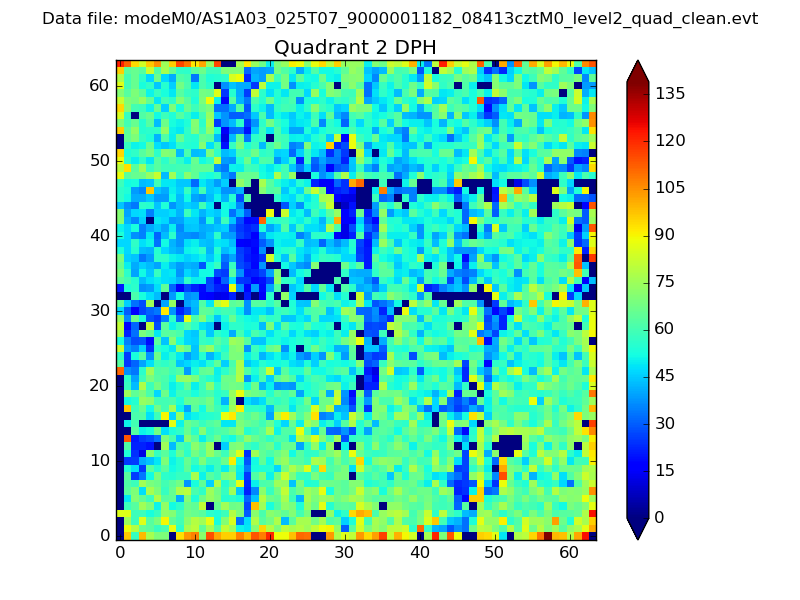
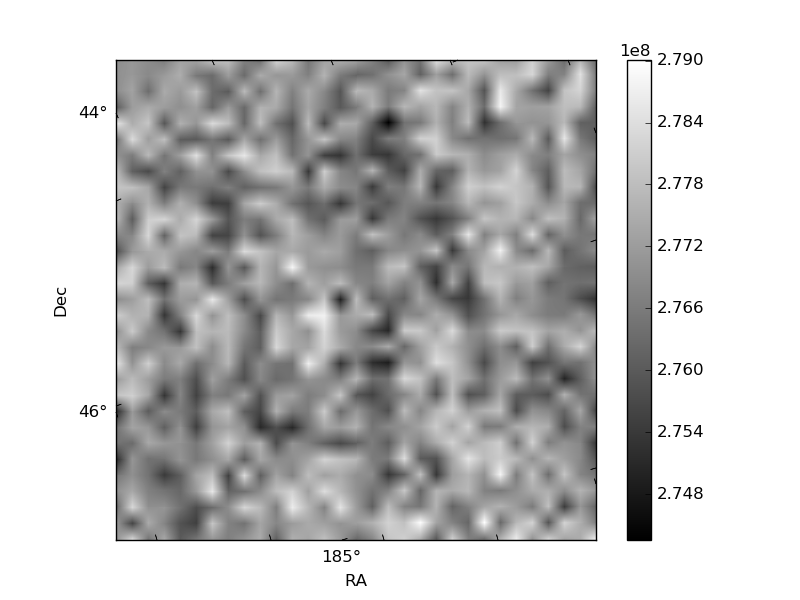
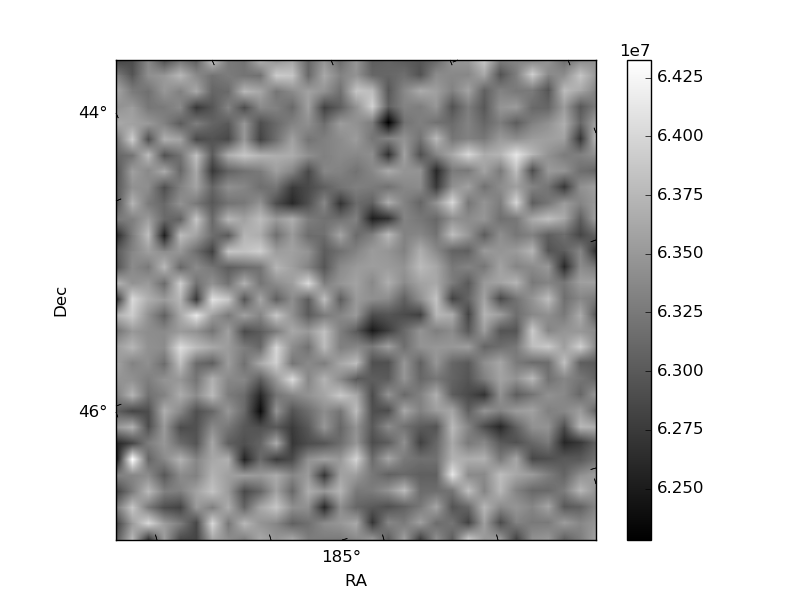
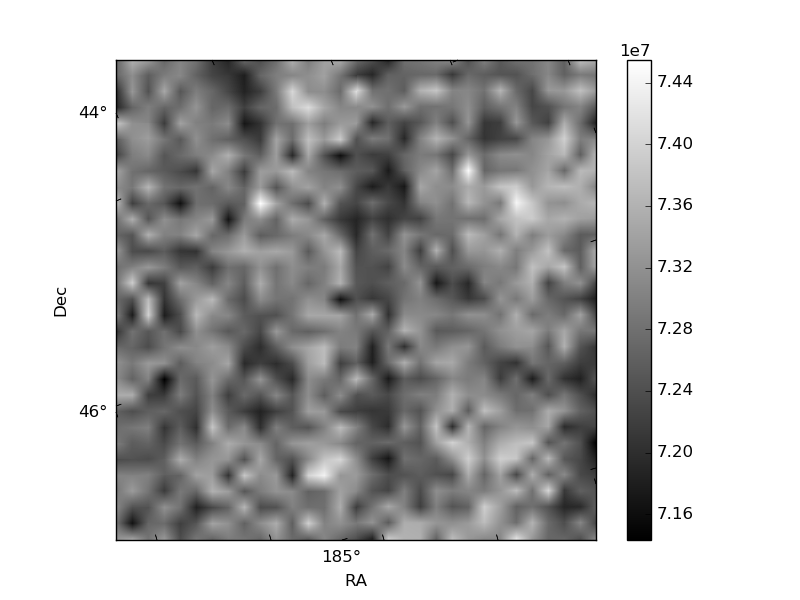
Histogram calculated using DETX and DETY for each event in the final _common_clean file
| Quadrant A | 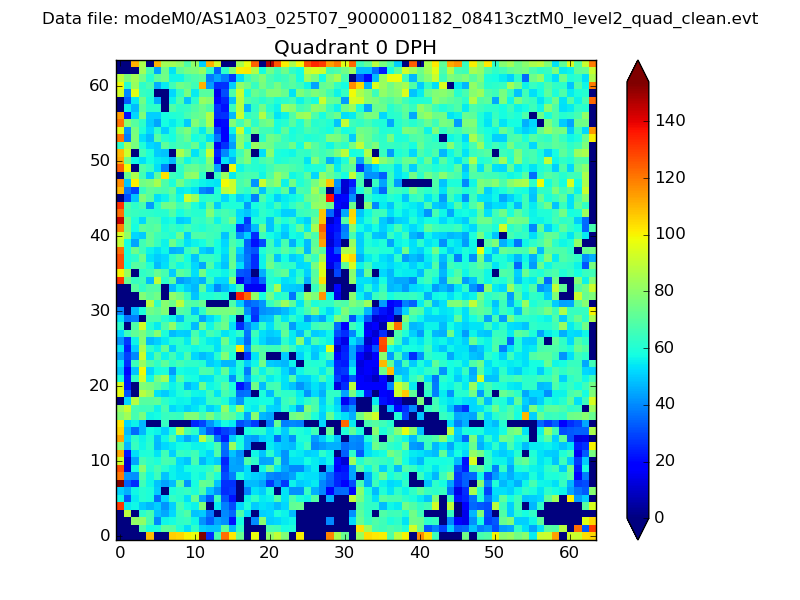 |
 |
Quadrant B |
|---|---|---|---|
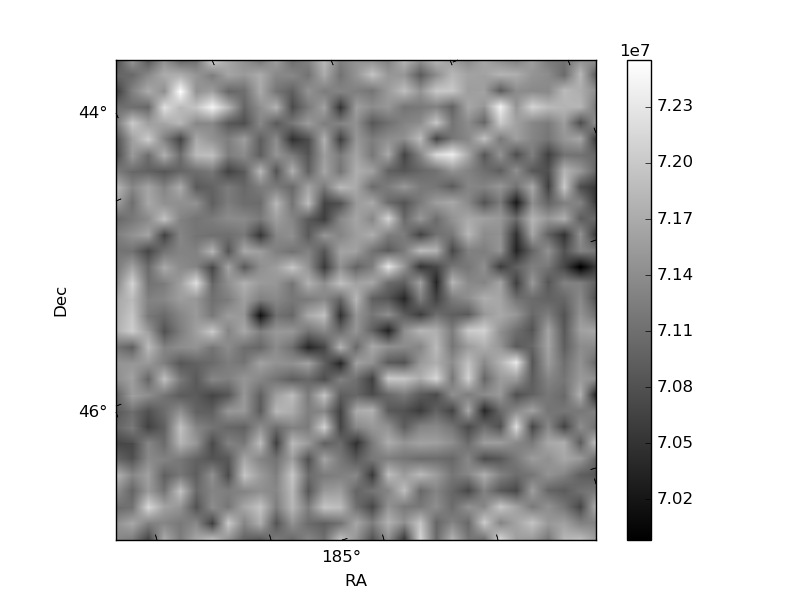
| Quadrant D | 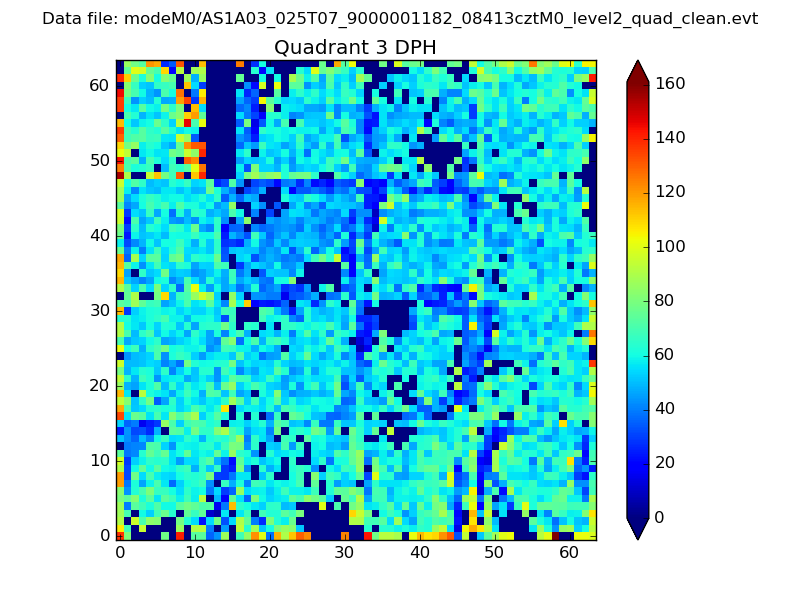 |
 |
Quadrant C |
| Plot type | Count rate plots | Images |
|---|---|---|
| Comparison with Poisson distribution Blue bars denote a histogram of data divided into 1 sec bins. Red curve is a Poisson curve with rate = median count rate of data. |
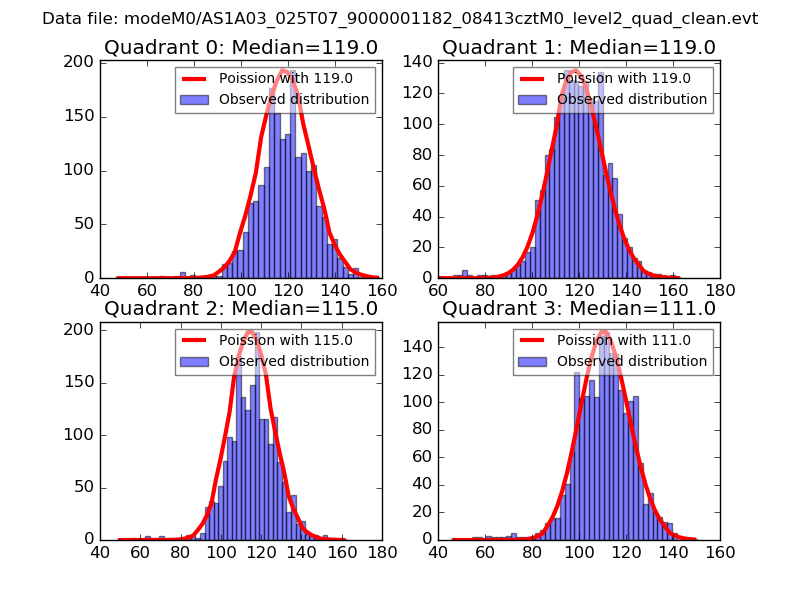 |
 |
| Quadrant-wise count rates Data is divided into 100 sec bins |
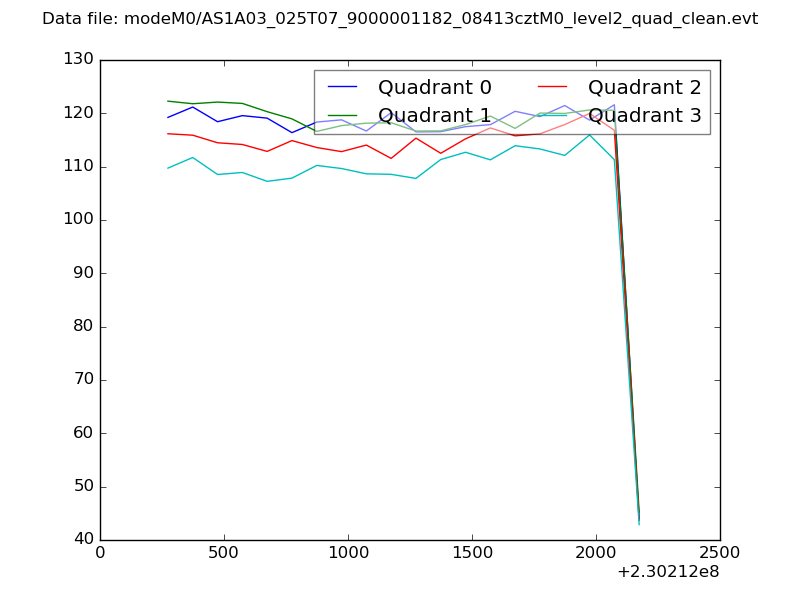 |
|
| Module-wise count rates for Quadrant A Data is divided into 100 sec bins |
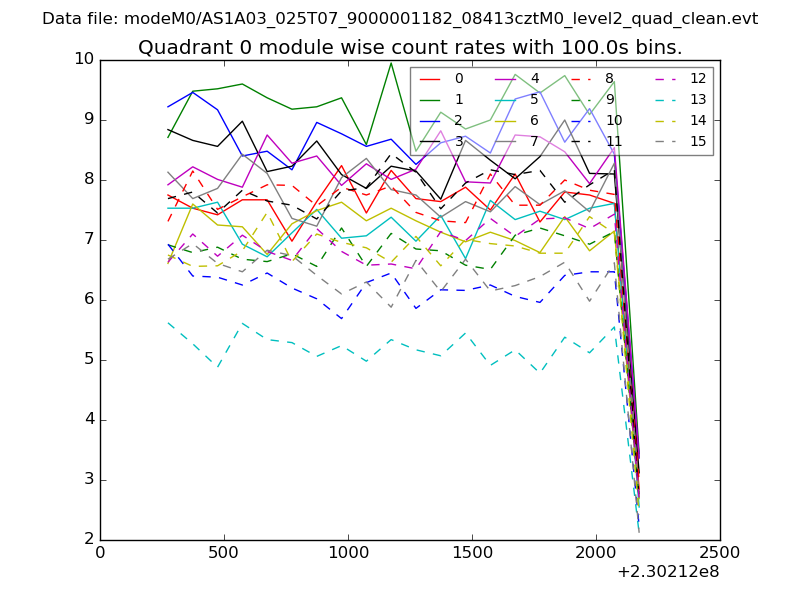 |
 |
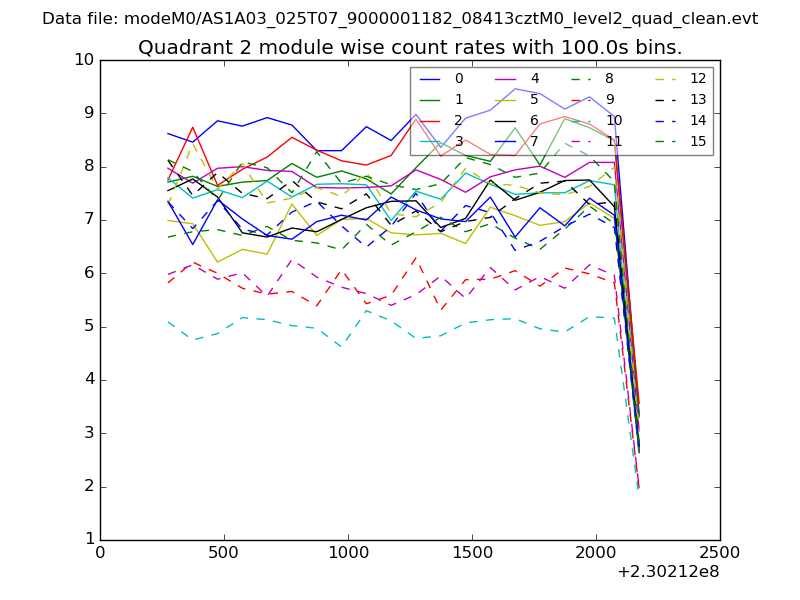
| Module-wise count rates for Quadrant B Data is divided into 100 sec bins |
 |
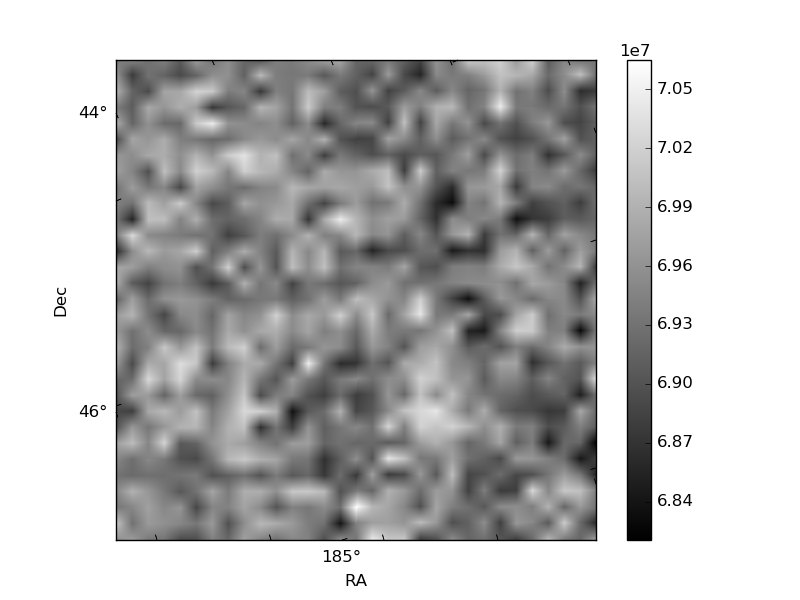 |
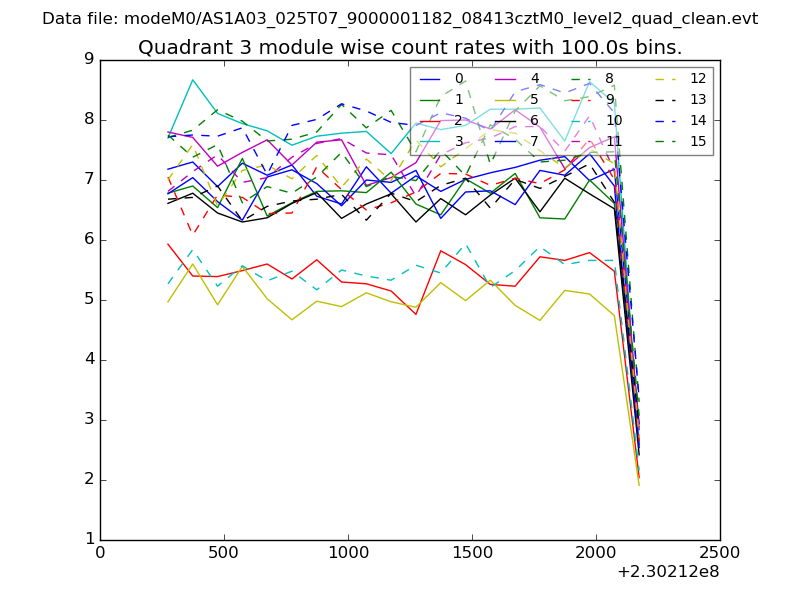
| Module-wise count rates for Quadrant C Data is divided into 100 sec bins |
 |
 |
| Module-wise count rates for Quadrant D Data is divided into 100 sec bins |
 |
 |
| Parameter | Plot |
|---|---|
| CZT HV Monitor | 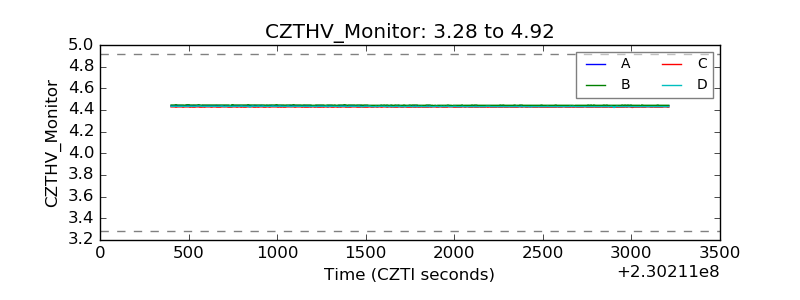 |
| D_VDD | 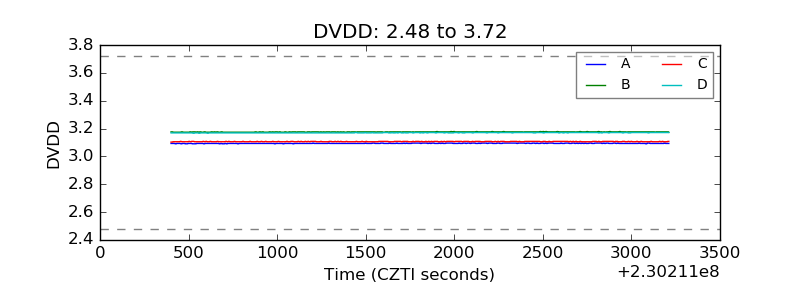 |
| Temperature 1 | 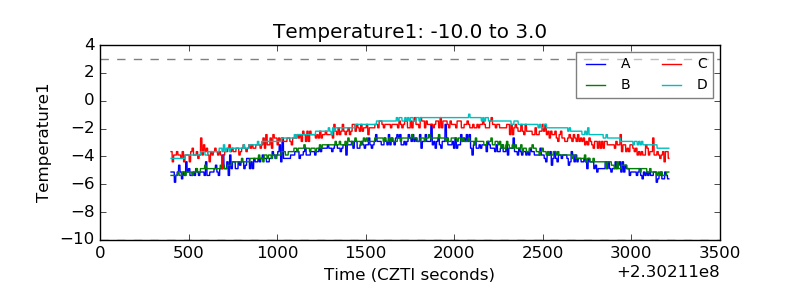 |
| Veto HV Monitor | 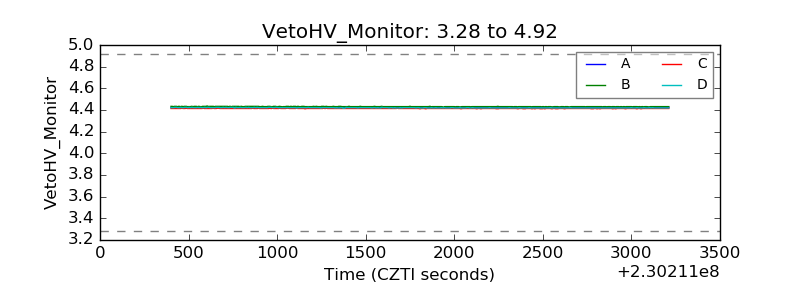 |
| Veto LLD | 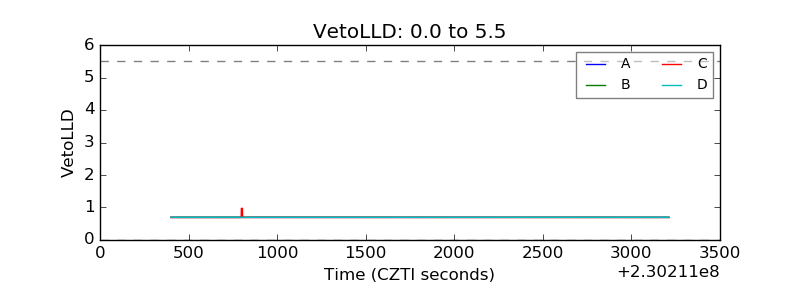 |
| Alpha Counter | 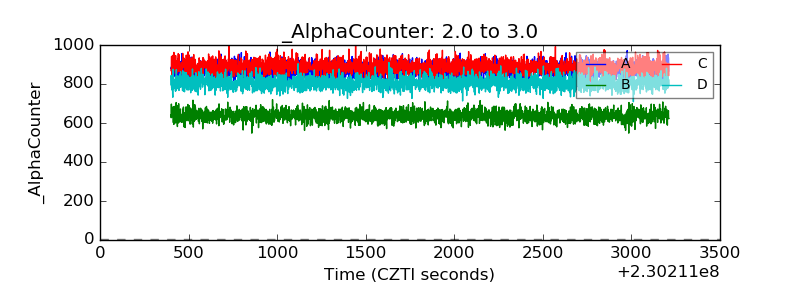 |
| _CPM_Rate | 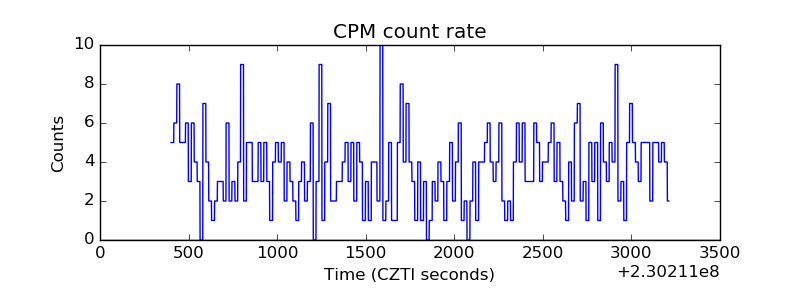 |
| CZT Counter | 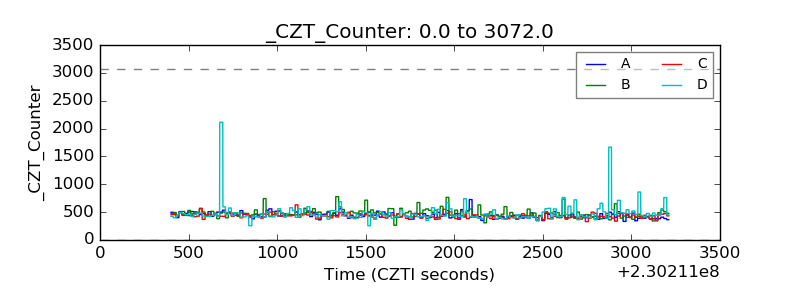 |
| +2.5 Volts monitor |  |
| +5 Volts monitor |  |
| _ROLL_ROT | 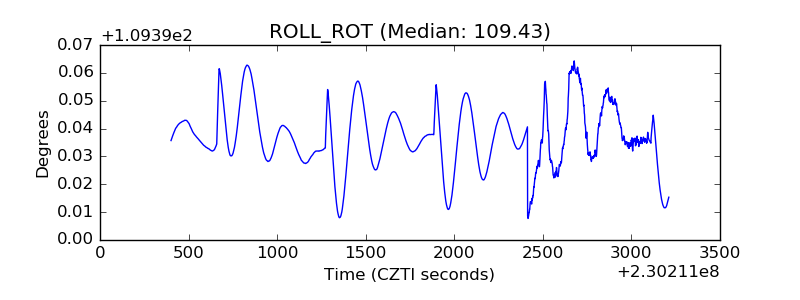 |
| _Roll_DEC | 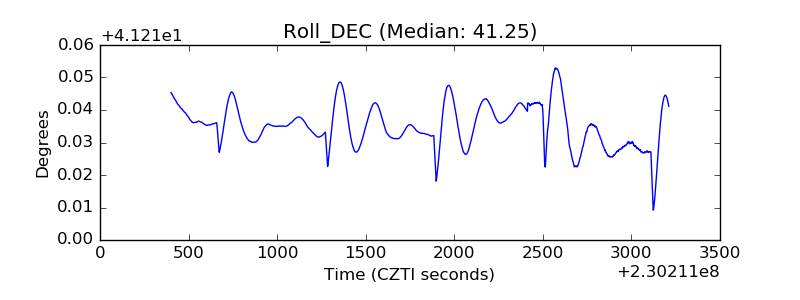 |
| _Roll_RA | 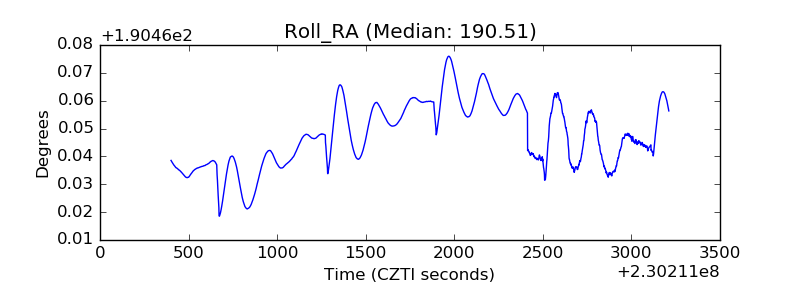 |
| Veto Counter | 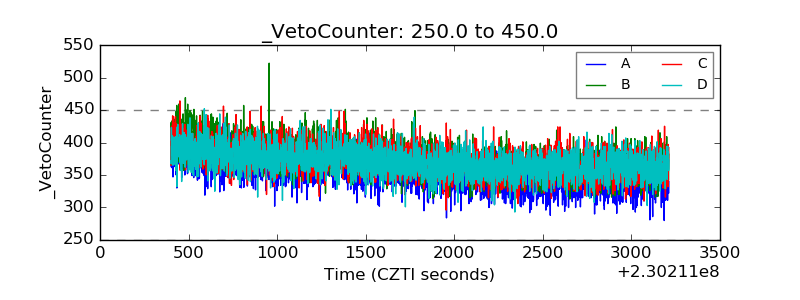 |