| Param | Original file | Final file |
|---|---|---|
| Filename | modeM0/AS1C02_033T01_9000001178cztM0_level2.fits | modeM0/AS1C02_033T01_9000001178cztM0_level2_quad_clean.evt |
| Size (bytes) | 200,836,800 | 186,693,120 |
| Size | 191.5 MB | 178.0 MB |
| Events in quadrant A | 1,208,936 | 1,074,962 |
| Events in quadrant B | 1,169,682 | 1,093,662 |
| Events in quadrant C | 1,192,910 | 1,044,356 |
| Events in quadrant D | 1,025,470 | 955,186 |
| Mode M9 | |||
|---|---|---|---|
| Quadrant | BADHDUFLAG | Total packets | Discarded packets |
| A | 0 | 9 | 0 |
| B | 0 | 9 | 0 |
| C | 0 | 9 | 0 |
| D | 0 | 9 | 0 |
| Mode M0 | |||
|---|---|---|---|
| Quadrant | BADHDUFLAG | Total packets | Discarded packets |
| A | 0 | 46691 | 0 |
| B | 0 | 48046 | 0 |
| C | 0 | 45218 | 0 |
| D | 0 | 48672 | 0 |
| Mode SS | |||
|---|---|---|---|
| Quadrant | BADHDUFLAG | Total packets | Discarded packets |
| A | 0 | 438 | 0 |
| B | 0 | 438 | 0 |
| C | 0 | 438 | 0 |
| D | 0 | 438 | 0 |
| Quadrant | Total seconds | Saturated seconds | Saturation percentage |
|---|---|---|---|
| A | 21570 | 563 | 2.610107% |
| B | 21569 | 572 | 2.651954% |
| C | 21570 | 225 | 1.043115% |
| D | 21570 | 449 | 2.081595% |
Noise dominated data is calculated using 1-second bins in cleaned event files. If a bin has >2000 counts, and if more than 50% of those come from <1% of pixels, then it is considered to be noise-dominated and hence unusable.
| Quadrant | # 1 sec bins | Bins with >0 counts | Bins with >2000 counts | High rate bins dominated by noise | Noise dominated (total time) | Noise dominated (detector-on time) | Marked lightcurve |
|---|---|---|---|---|---|---|---|
| A | 22531 | 21571 | 0 | 0 | 0.00% | 0.00% |  |
| B | 22531 | 21571 | 0 | 0 | 0.00% | 0.00% |  |
| C | 22531 | 21571 | 0 | 0 | 0.00% | 0.00% |  |
| D | 22531 | 21541 | 0 | 0 | 0.00% | 0.00% |  |
Top three noisy pixels from each quadrant. If the there are fewer than three noisy pixels in the level2.evt file, extra rows are filled as -1
| Pixel properties | Quadrant properties | ||||||
|---|---|---|---|---|---|---|---|
| Quadrant | DetID | PixID | Counts | Sigma | Mean | Median | Sigma |
| A | 14 | 188 | 1225 | 11.47 | 312 | 290 | 81.5 |
| A | 0 | 29 | 1181 | 10.93 | 312 | 290 | 81.5 |
| A | 14 | 204 | 1027 | 9.04 | 312 | 290 | 81.5 |
| B | 2 | 9 | 991 | 10.36 | 309 | 292 | 67.5 |
| B | 5 | 225 | 806 | 7.62 | 309 | 292 | 67.5 |
| B | 12 | 226 | 781 | 7.25 | 309 | 292 | 67.5 |
| C | 12 | 241 | 839 | 6.5 | 315 | 290 | 84.5 |
| C | 2 | 191 | 836 | 6.46 | 315 | 290 | 84.5 |
| C | 9 | 242 | 808 | 6.13 | 315 | 290 | 84.5 |
| D | 6 | 231 | 764 | 6.14 | 293 | 264 | 81.4 |
| D | 1 | 19 | 726 | 5.68 | 293 | 264 | 81.4 |
| D | 7 | 5 | 719 | 5.59 | 293 | 264 | 81.4 |
Histogram calculated using DETX and DETY for each event in the final _common_clean file
| Quadrant A | 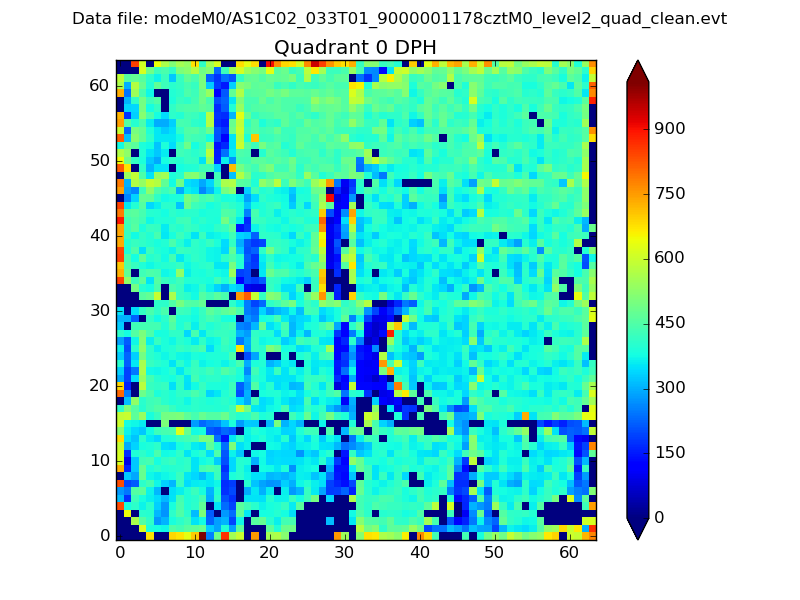 |
 |
Quadrant B |
|---|---|---|---|
| Quadrant D |  |
 |
Quadrant C |
| Plot type | Count rate plots | Images |
|---|---|---|
| Comparison with Poisson distribution Blue bars denote a histogram of data divided into 1 sec bins. Red curve is a Poisson curve with rate = median count rate of data. |
 |
 |
| Quadrant-wise count rates Data is divided into 100 sec bins |
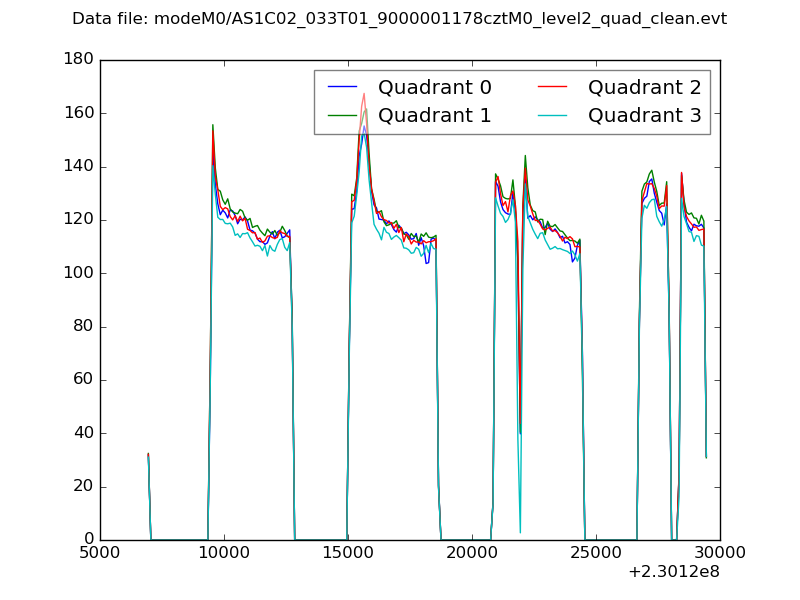 |
|
| Module-wise count rates for Quadrant A Data is divided into 100 sec bins |
 |
 |
| Module-wise count rates for Quadrant B Data is divided into 100 sec bins |
 |
 |
| Module-wise count rates for Quadrant C Data is divided into 100 sec bins |
 |
 |
| Module-wise count rates for Quadrant D Data is divided into 100 sec bins |
 |
 |
| Parameter | Plot |
|---|---|
| CZT HV Monitor |  |
| D_VDD | 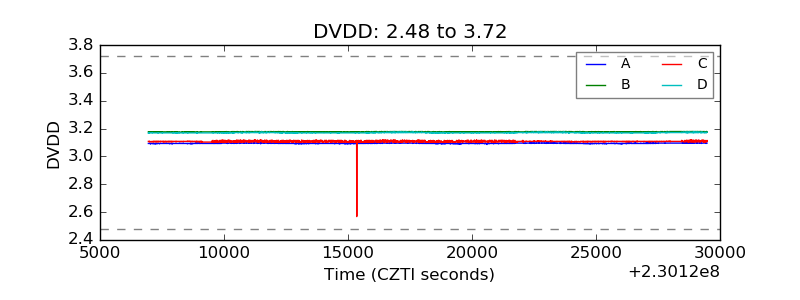 |
| Temperature 1 |  |
| Veto HV Monitor | 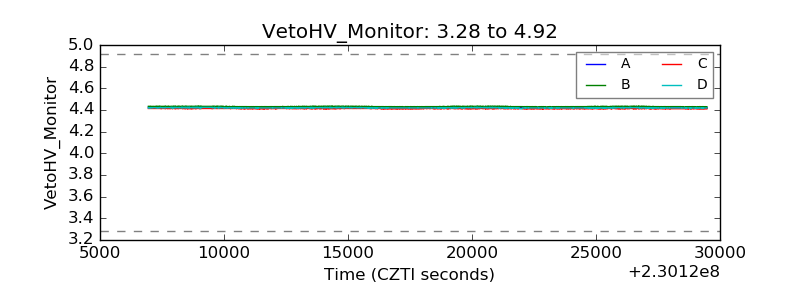 |
| Veto LLD |  |
| Alpha Counter | 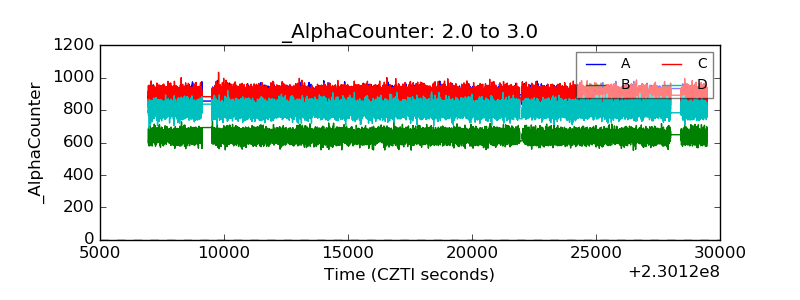 |
| _CPM_Rate |  |
| CZT Counter |  |
| +2.5 Volts monitor |  |
| +5 Volts monitor |  |
| _ROLL_ROT |  |
| _Roll_DEC |  |
| _Roll_RA |  |
| Veto Counter |  |