| Param | Original file | Final file |
|---|---|---|
| Filename | modeM0/AS1C02_033T01_9000001178_08399cztM0_level2.evt | modeM0/AS1C02_033T01_9000001178_08399cztM0_level2_quad_clean.evt |
| Size (bytes) | 534,026,880 | 104,500,800 |
| Size | 509.3 MB | 99.7 MB |
| Events in quadrant A | 3,751,694 | 657,224 |
| Events in quadrant B | 4,179,008 | 672,669 |
| Events in quadrant C | 3,680,889 | 663,365 |
| Events in quadrant D | 4,039,833 | 637,084 |
| Mode M0 | |||
|---|---|---|---|
| Quadrant | BADHDUFLAG | Total packets | Discarded packets |
| A | 0 | 16341 | 1 |
| B | 0 | 17376 | 0 |
| C | 0 | 16188 | 0 |
| D | 0 | 17347 | 0 |
| Mode SS | |||
|---|---|---|---|
| Quadrant | BADHDUFLAG | Total packets | Discarded packets |
| A | 0 | 154 | 0 |
| B | 0 | 154 | 0 |
| C | 0 | 154 | 0 |
| D | 0 | 154 | 0 |
| Quadrant | Total seconds | Saturated seconds | Saturation percentage |
|---|---|---|---|
| A | 7681 | 162 | 2.109100% |
| B | 7681 | 203 | 2.642885% |
| C | 7681 | 57 | 0.742091% |
| D | 7681 | 139 | 1.809660% |
Noise dominated data is calculated using 1-second bins in cleaned event files. If a bin has >2000 counts, and if more than 50% of those come from <1% of pixels, then it is considered to be noise-dominated and hence unusable.
| Quadrant | # 1 sec bins | Bins with >0 counts | Bins with >2000 counts | High rate bins dominated by noise | Noise dominated (total time) | Noise dominated (detector-on time) | Marked lightcurve |
|---|---|---|---|---|---|---|---|
| A | 7681 | 7681 | 7 | 7 | 0.09% | 0.09% | 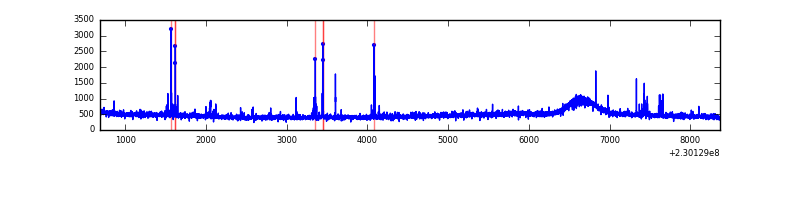 |
| B | 7681 | 7681 | 3 | 3 | 0.04% | 0.04% | 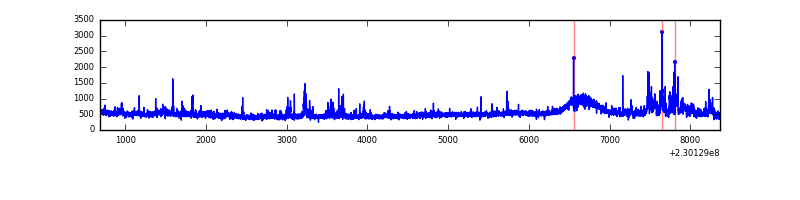 |
| C | 7681 | 7681 | 4 | 4 | 0.05% | 0.05% | 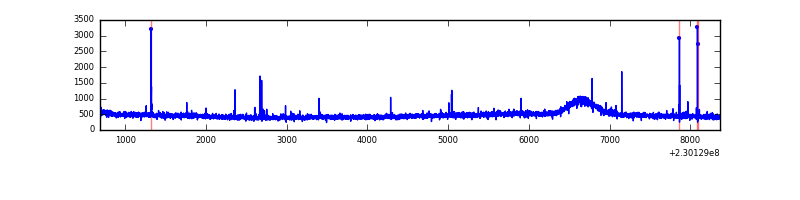 |
| D | 7681 | 7681 | 41 | 41 | 0.53% | 0.53% | 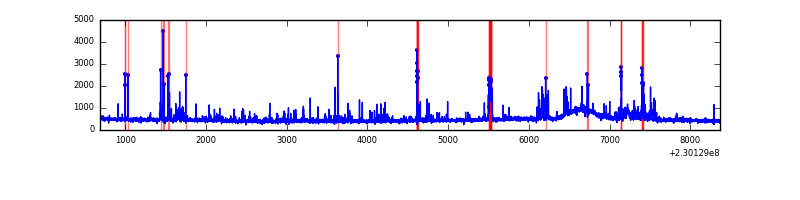 |
Top three noisy pixels from each quadrant. If the there are fewer than three noisy pixels in the level2.evt file, extra rows are filled as -1
| Pixel properties | Quadrant properties | ||||||
|---|---|---|---|---|---|---|---|
| Quadrant | DetID | PixID | Counts | Sigma | Mean | Median | Sigma |
| A | 5 | 16 | 68957 | 342.51 | 951 | 927 | 198.6 |
| A | 14 | 111 | 25042 | 121.41 | 951 | 927 | 198.6 |
| A | 0 | 226 | 9023 | 40.76 | 951 | 927 | 198.6 |
| B | 0 | 219 | 247218 | 1326.02 | 958 | 935 | 185.7 |
| B | 0 | 214 | 92811 | 494.67 | 958 | 935 | 185.7 |
| B | 0 | 230 | 34567 | 181.08 | 958 | 935 | 185.7 |
| C | 1 | 16 | 53951 | 245.38 | 920 | 925 | 216.1 |
| C | 8 | 128 | 17981 | 78.93 | 920 | 925 | 216.1 |
| C | 8 | 112 | 9082 | 37.75 | 920 | 925 | 216.1 |
| D | 7 | 71 | 194005 | 806.74 | 920 | 897 | 239.4 |
| D | 2 | 14 | 132491 | 549.76 | 920 | 897 | 239.4 |
| D | 13 | 122 | 58272 | 239.69 | 920 | 897 | 239.4 |
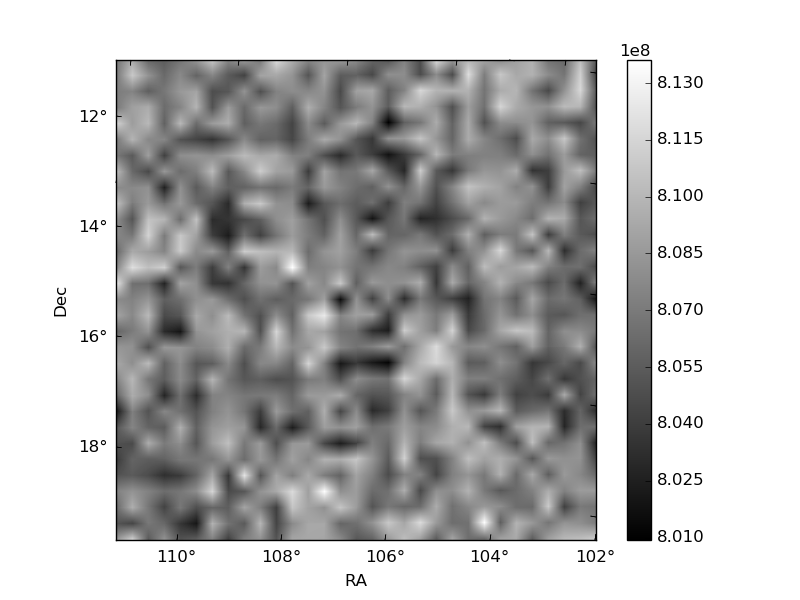
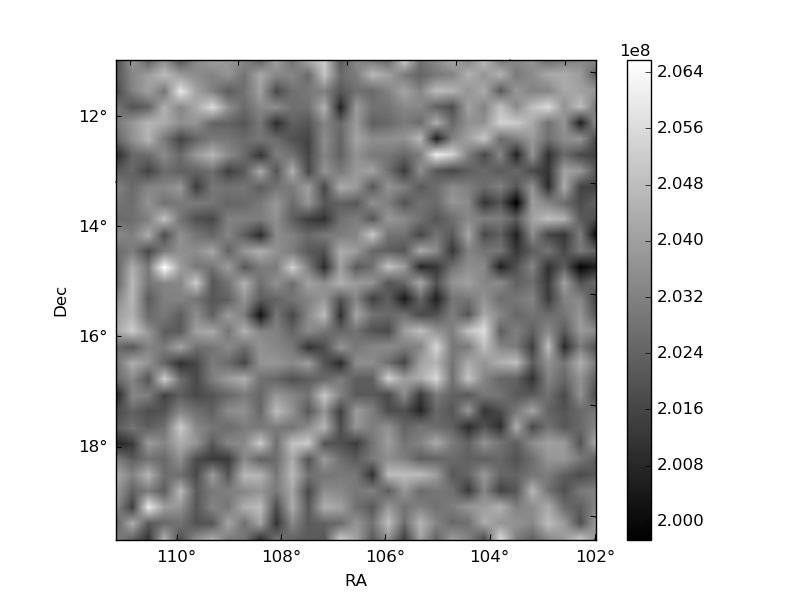
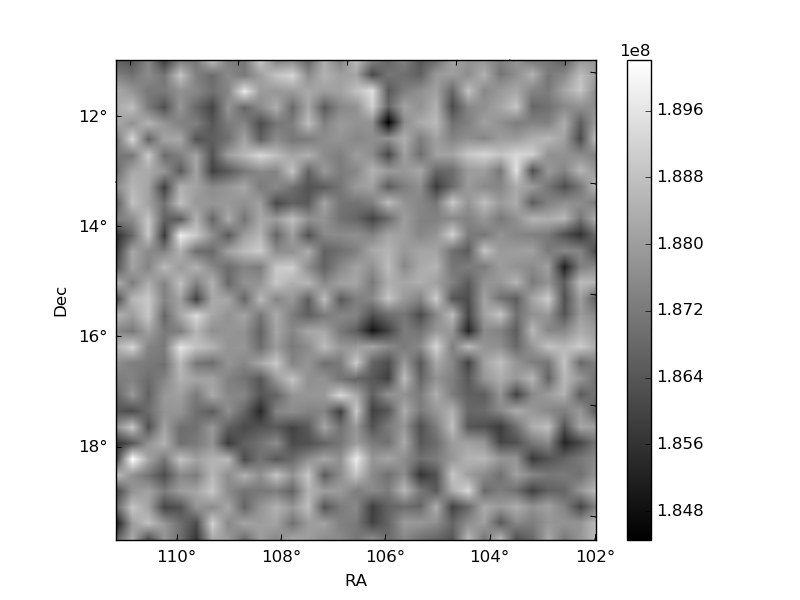
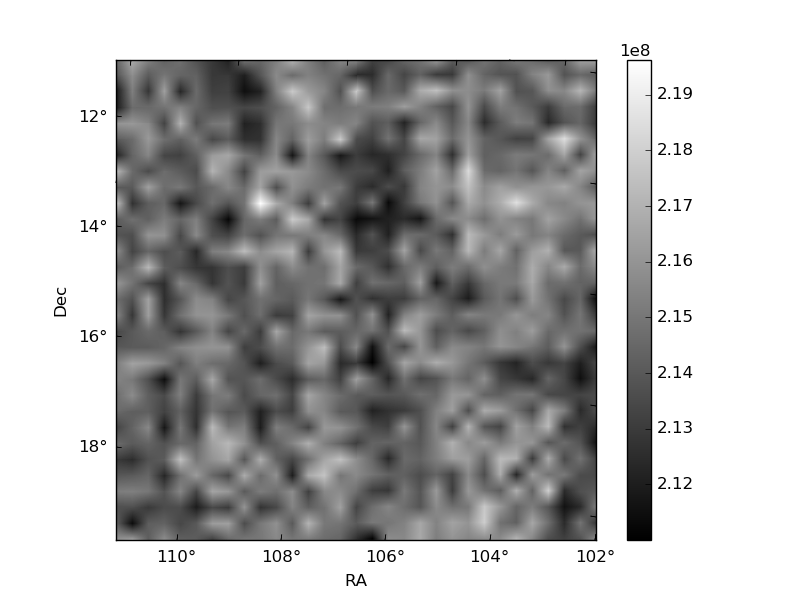
Histogram calculated using DETX and DETY for each event in the final _common_clean file
| Quadrant A | 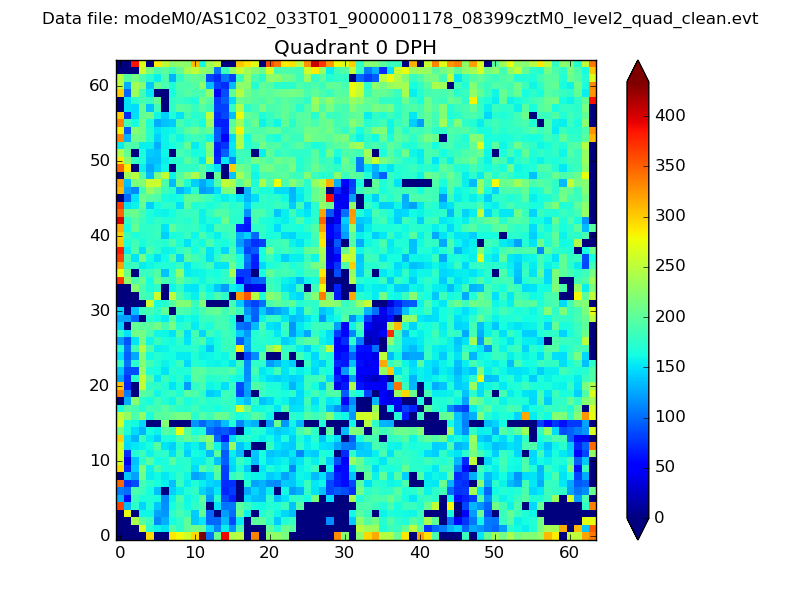 |
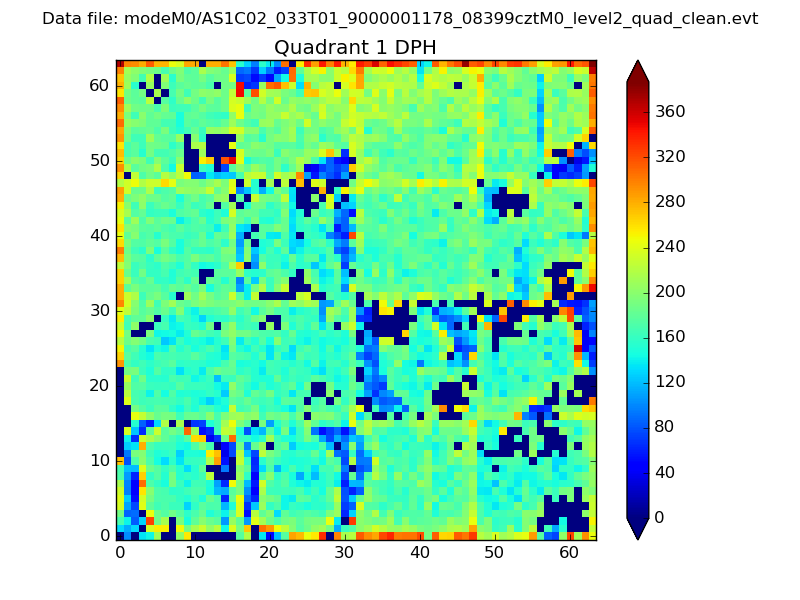 |
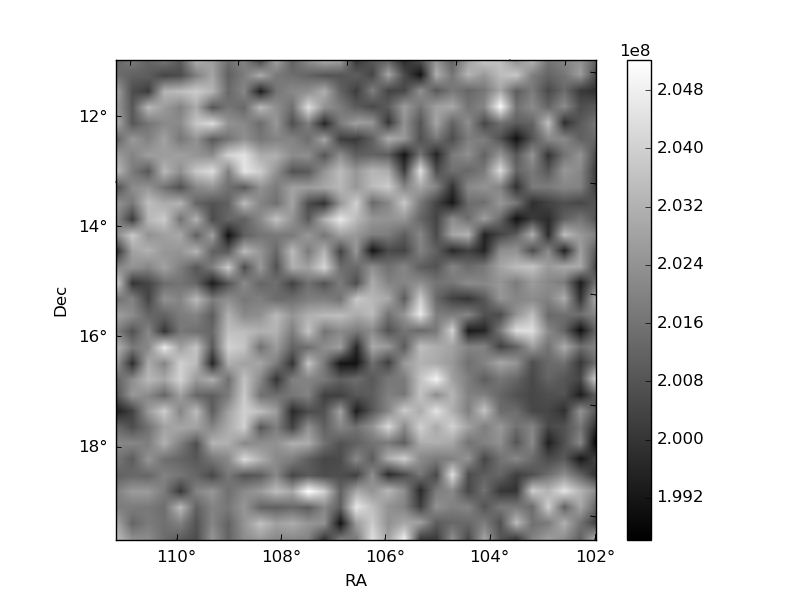
Quadrant B |
|---|---|---|---|
| Quadrant D | 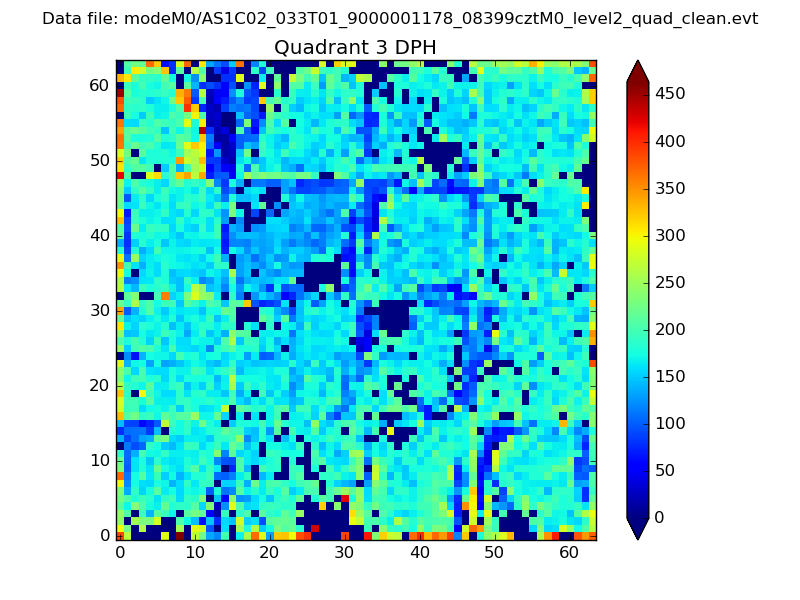 |
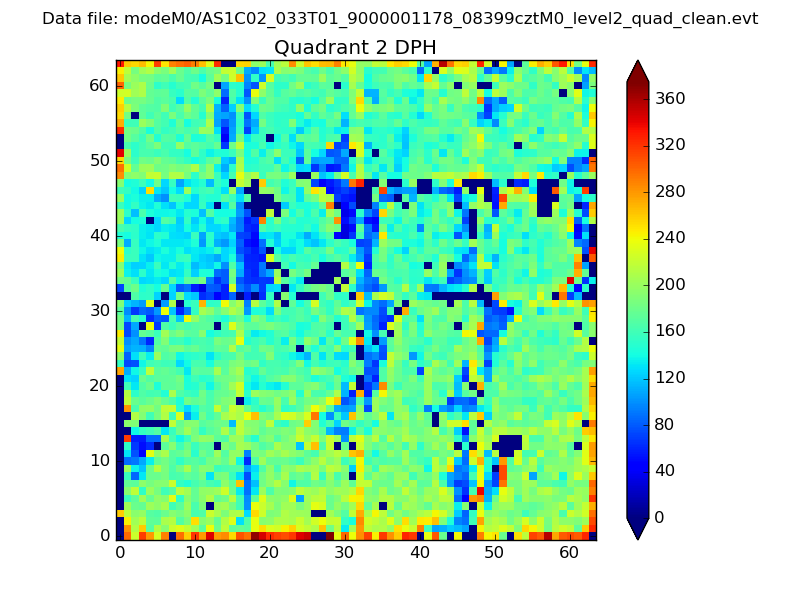 |
Quadrant C |
| Plot type | Count rate plots | Images |
|---|---|---|
| Comparison with Poisson distribution Blue bars denote a histogram of data divided into 1 sec bins. Red curve is a Poisson curve with rate = median count rate of data. |
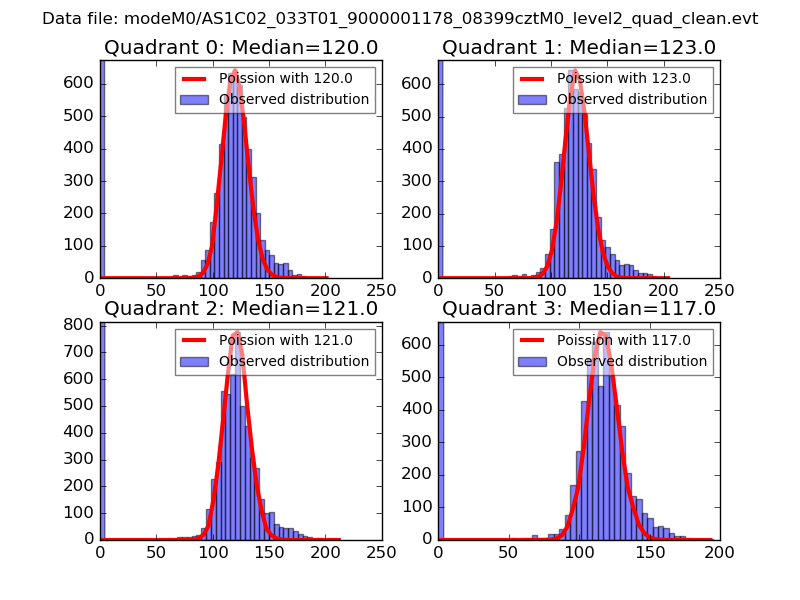 |
 |
| Quadrant-wise count rates Data is divided into 100 sec bins |
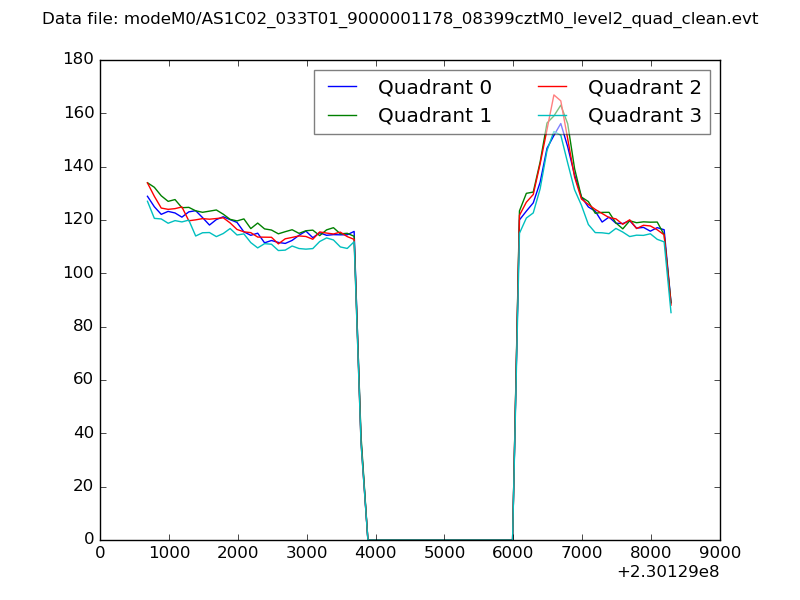 |
|
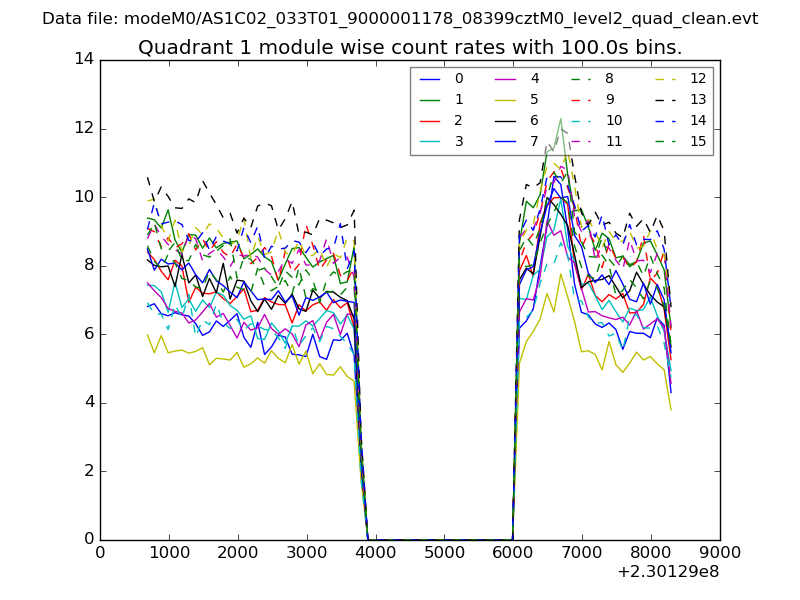
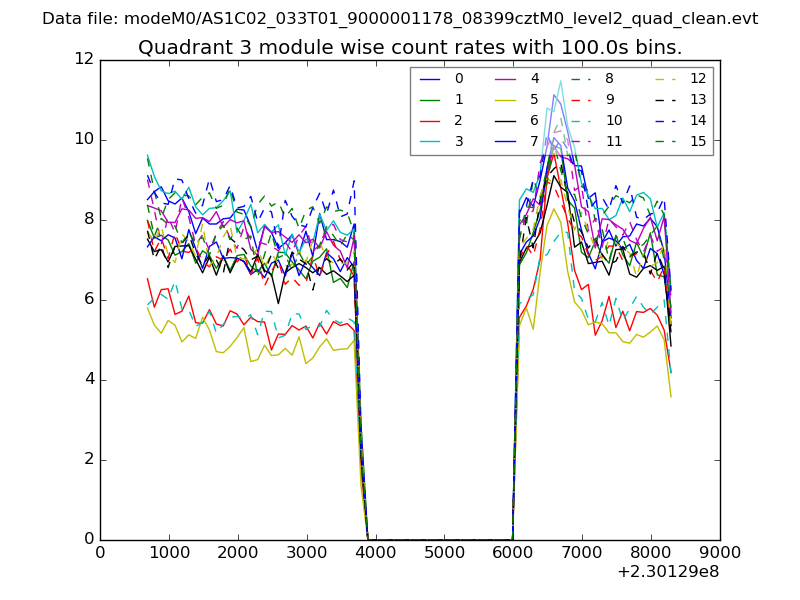
| Module-wise count rates for Quadrant A Data is divided into 100 sec bins |
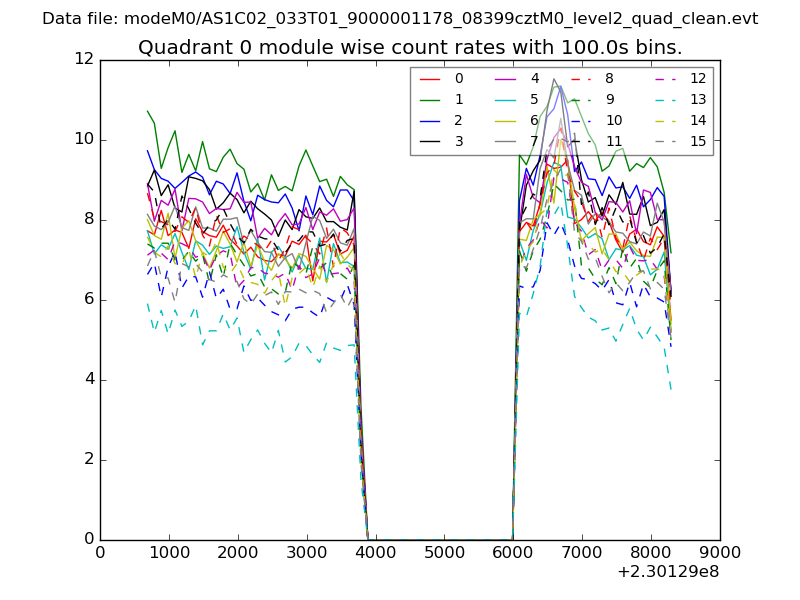 |
 |
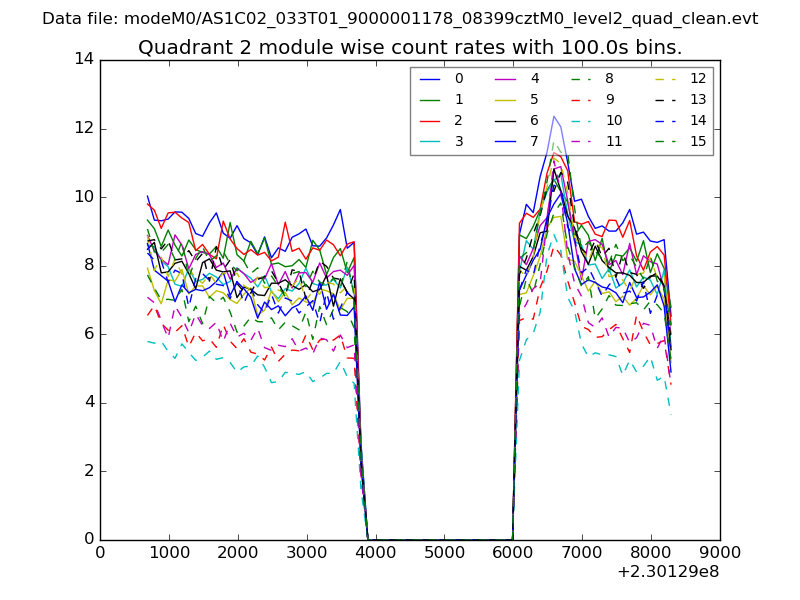
| Module-wise count rates for Quadrant B Data is divided into 100 sec bins |
 |
 |
| Module-wise count rates for Quadrant C Data is divided into 100 sec bins |
 |
 |
| Module-wise count rates for Quadrant D Data is divided into 100 sec bins |
 |
 |
| Parameter | Plot |
|---|---|
| CZT HV Monitor | 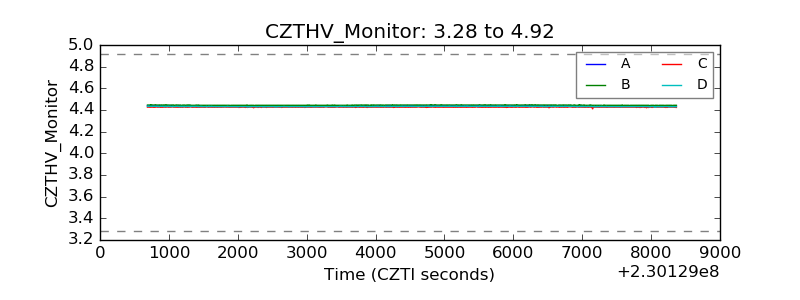 |
| D_VDD | 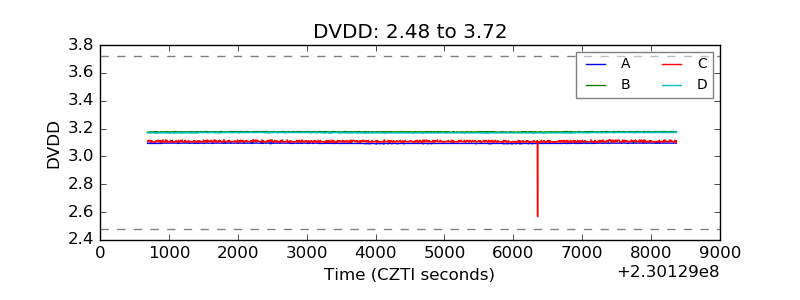 |
| Temperature 1 | 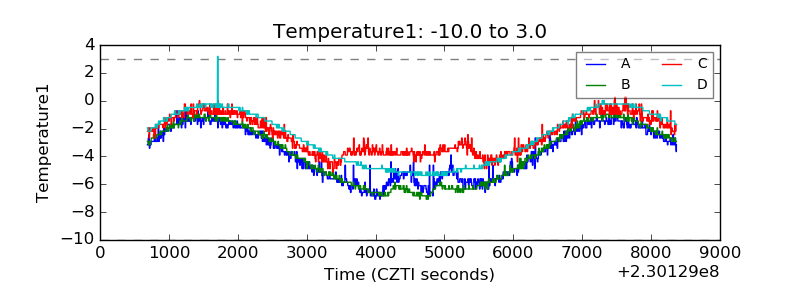 |
| Veto HV Monitor | 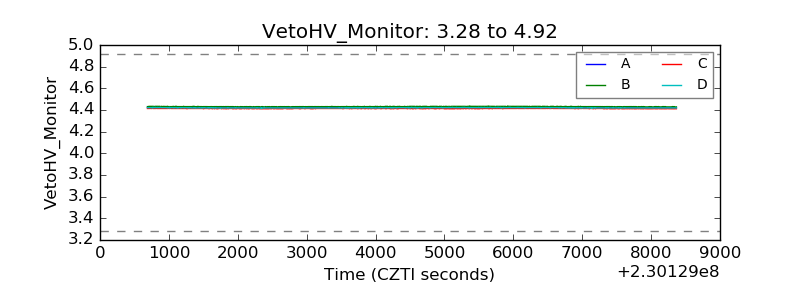 |
| Veto LLD | 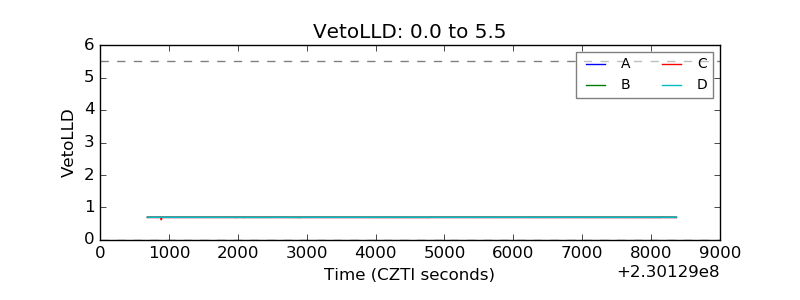 |
| Alpha Counter | 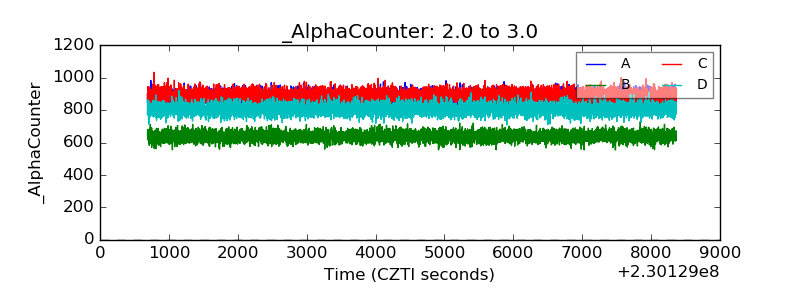 |
| _CPM_Rate | 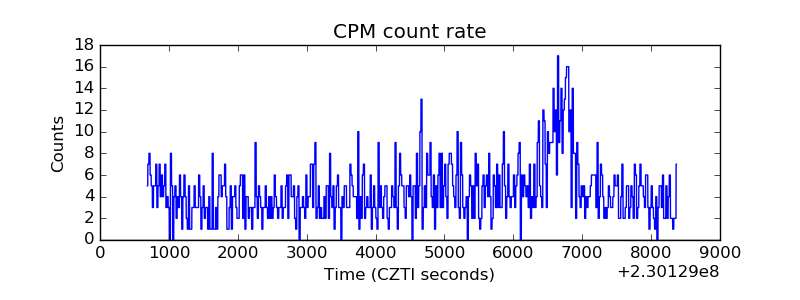 |
| CZT Counter | 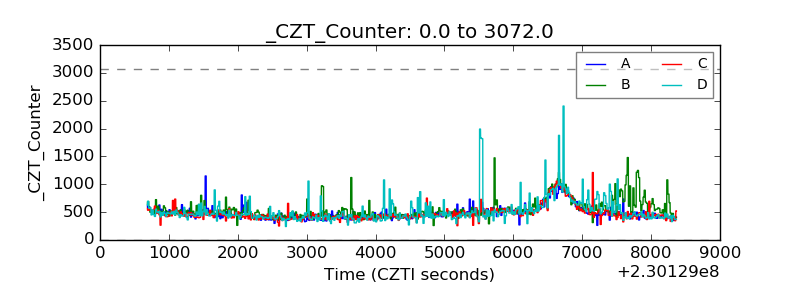 |
| +2.5 Volts monitor |  |
| +5 Volts monitor | 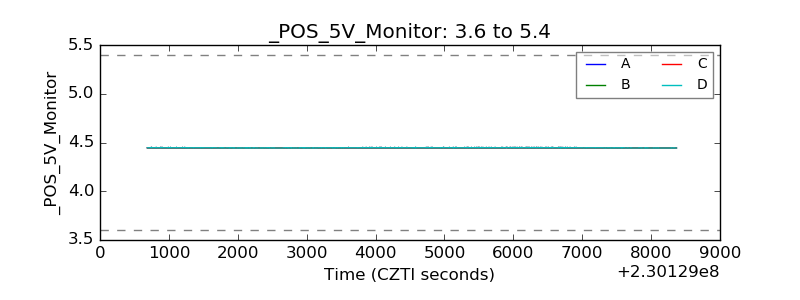 |
| _ROLL_ROT | 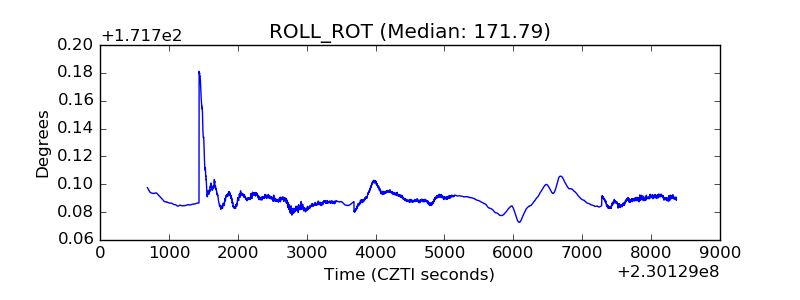 |
| _Roll_DEC | 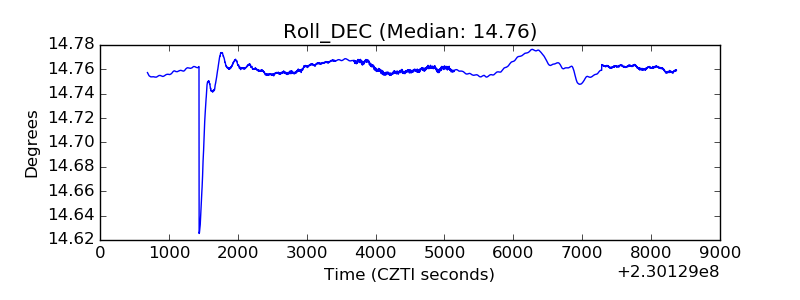 |
| _Roll_RA | 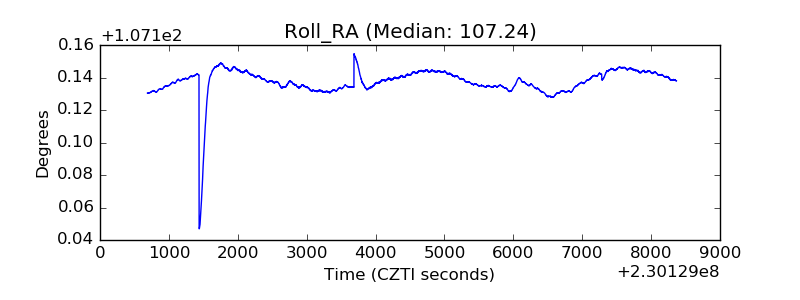 |
| Veto Counter | 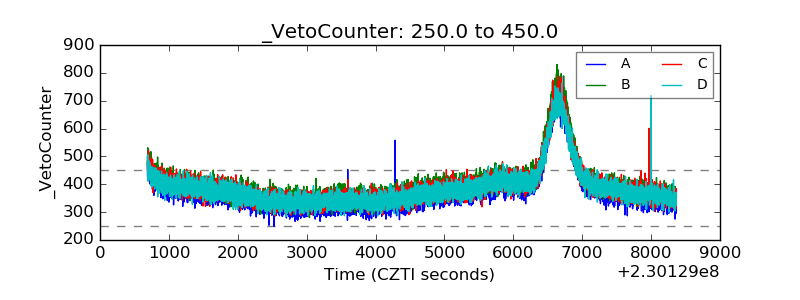 |