| Param | Original file | Final file |
|---|---|---|
| Filename | modeM0/AS1C02_033T01_9000001178_08400cztM0_level2.evt | modeM0/AS1C02_033T01_9000001178_08400cztM0_level2_quad_clean.evt |
| Size (bytes) | 503,723,520 | 95,880,960 |
| Size | 480.4 MB | 91.4 MB |
| Events in quadrant A | 3,606,806 | 601,854 |
| Events in quadrant B | 4,027,232 | 615,075 |
| Events in quadrant C | 3,370,766 | 608,335 |
| Events in quadrant D | 3,754,915 | 570,370 |
| Mode M9 | |||
|---|---|---|---|
| Quadrant | BADHDUFLAG | Total packets | Discarded packets |
| A | 0 | 1 | 0 |
| B | 0 | 1 | 0 |
| C | 0 | 1 | 0 |
| D | 0 | 1 | 0 |
| Mode M0 | |||
|---|---|---|---|
| Quadrant | BADHDUFLAG | Total packets | Discarded packets |
| A | 0 | 15820 | 4 |
| B | 0 | 16794 | 2 |
| C | 0 | 15142 | 2 |
| D | 0 | 16433 | 2 |
| Mode SS | |||
|---|---|---|---|
| Quadrant | BADHDUFLAG | Total packets | Discarded packets |
| A | 0 | 148 | 0 |
| B | 0 | 148 | 0 |
| C | 0 | 148 | 0 |
| D | 0 | 148 | 0 |
| Quadrant | Total seconds | Saturated seconds | Saturation percentage |
|---|---|---|---|
| A | 7293 | 185 | 2.536679% |
| B | 7293 | 172 | 2.358426% |
| C | 7293 | 76 | 1.042095% |
| D | 7293 | 147 | 2.015631% |
Noise dominated data is calculated using 1-second bins in cleaned event files. If a bin has >2000 counts, and if more than 50% of those come from <1% of pixels, then it is considered to be noise-dominated and hence unusable.
| Quadrant | # 1 sec bins | Bins with >0 counts | Bins with >2000 counts | High rate bins dominated by noise | Noise dominated (total time) | Noise dominated (detector-on time) | Marked lightcurve |
|---|---|---|---|---|---|---|---|
| A | 7434 | 7297 | 37 | 37 | 0.50% | 0.51% | 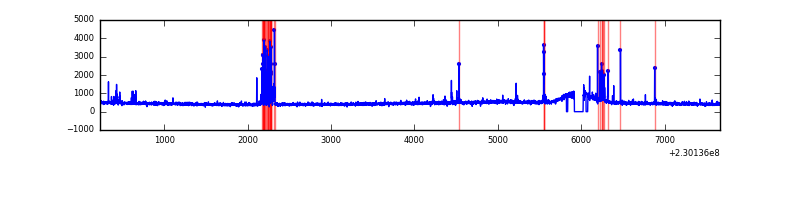 |
| B | 7434 | 7297 | 15 | 15 | 0.20% | 0.21% | 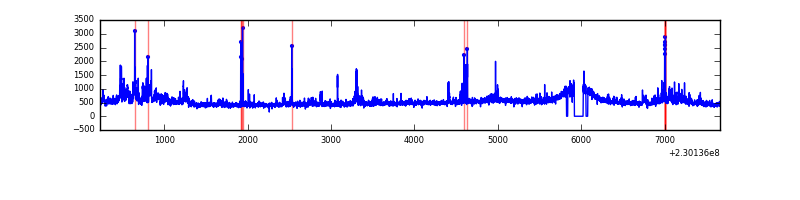 |
| C | 7434 | 7297 | 4 | 4 | 0.05% | 0.05% | 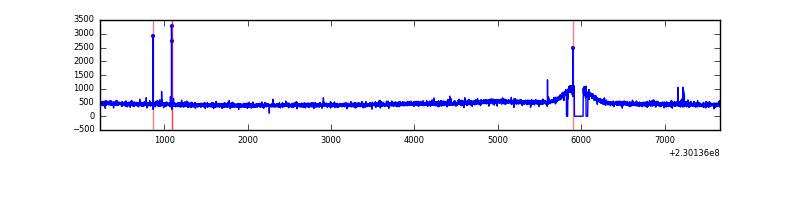 |
| D | 7434 | 7295 | 103 | 103 | 1.39% | 1.41% | 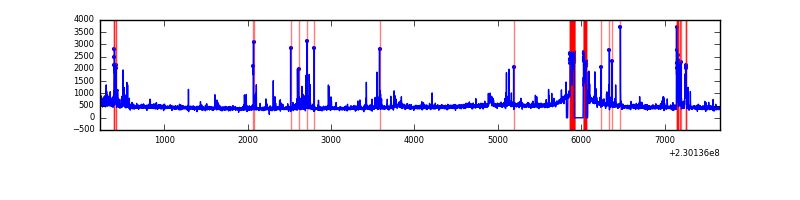 |
Top three noisy pixels from each quadrant. If the there are fewer than three noisy pixels in the level2.evt file, extra rows are filled as -1
| Pixel properties | Quadrant properties | ||||||
|---|---|---|---|---|---|---|---|
| Quadrant | DetID | PixID | Counts | Sigma | Mean | Median | Sigma |
| A | 5 | 16 | 217606 | 1221.15 | 870 | 850 | 177.5 |
| A | 14 | 111 | 21639 | 117.12 | 870 | 850 | 177.5 |
| A | 0 | 254 | 17070 | 91.38 | 870 | 850 | 177.5 |
| B | 0 | 219 | 233092 | 1352.13 | 879 | 856 | 171.8 |
| B | 0 | 231 | 103653 | 598.51 | 879 | 856 | 171.8 |
| B | 0 | 214 | 91017 | 524.94 | 879 | 856 | 171.8 |
| C | 1 | 16 | 29657 | 144.12 | 851 | 855 | 199.9 |
| C | 8 | 128 | 11136 | 51.44 | 851 | 855 | 199.9 |
| C | 13 | 61 | 6708 | 29.29 | 851 | 855 | 199.9 |
| D | 1 | 7 | 221529 | 1078.35 | 834 | 807 | 204.7 |
| D | 7 | 71 | 148648 | 722.29 | 834 | 807 | 204.7 |
| D | 2 | 14 | 62594 | 301.86 | 834 | 807 | 204.7 |
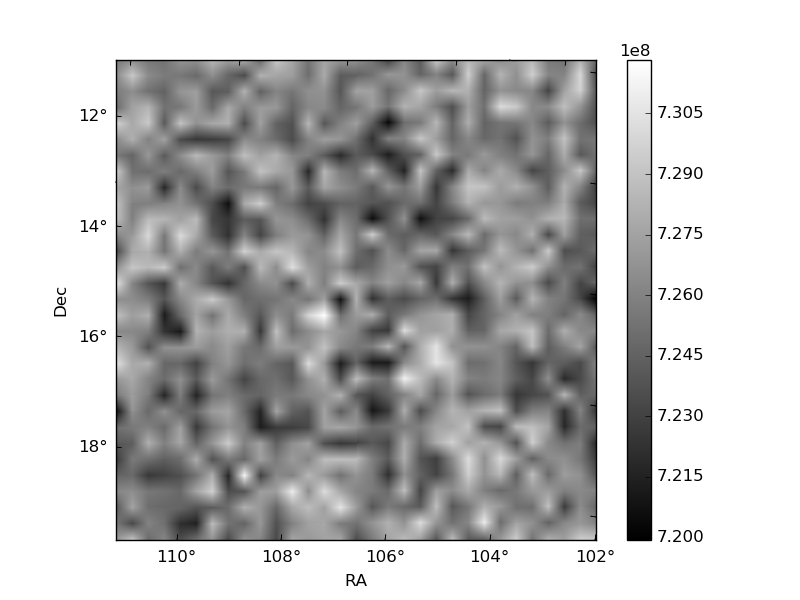
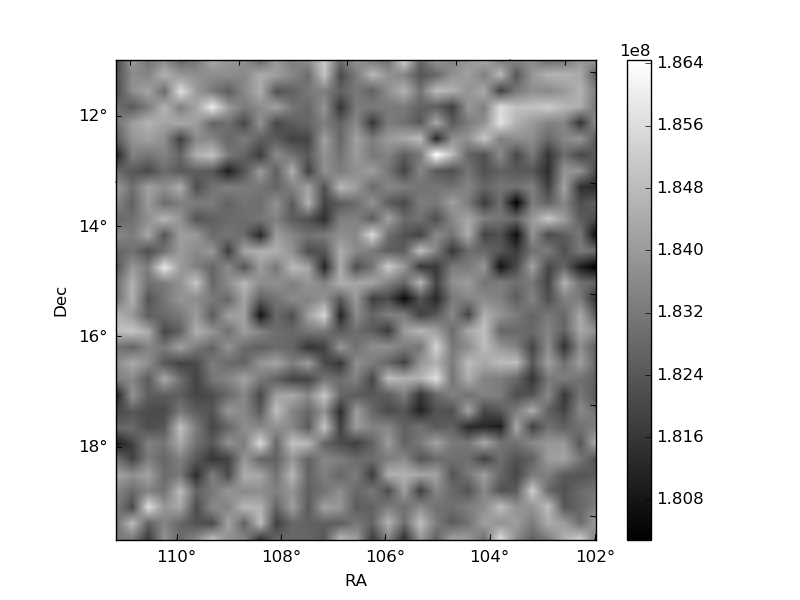
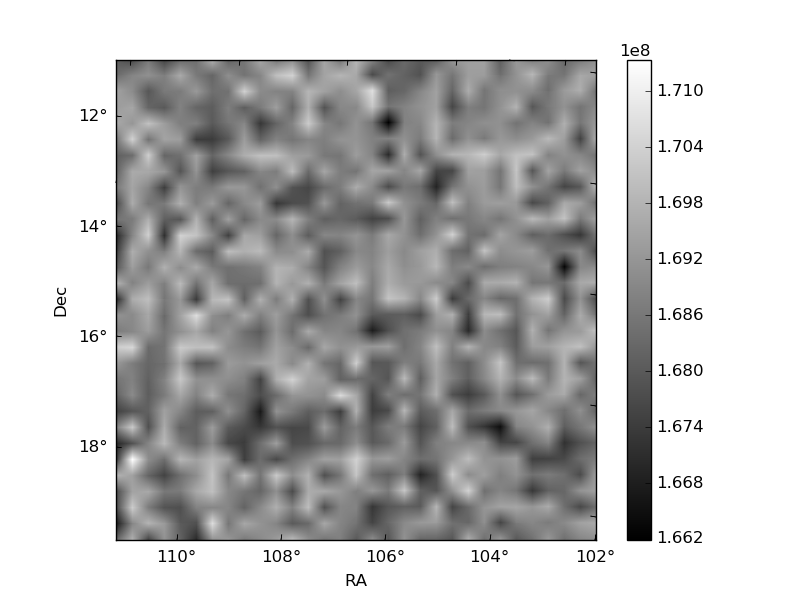
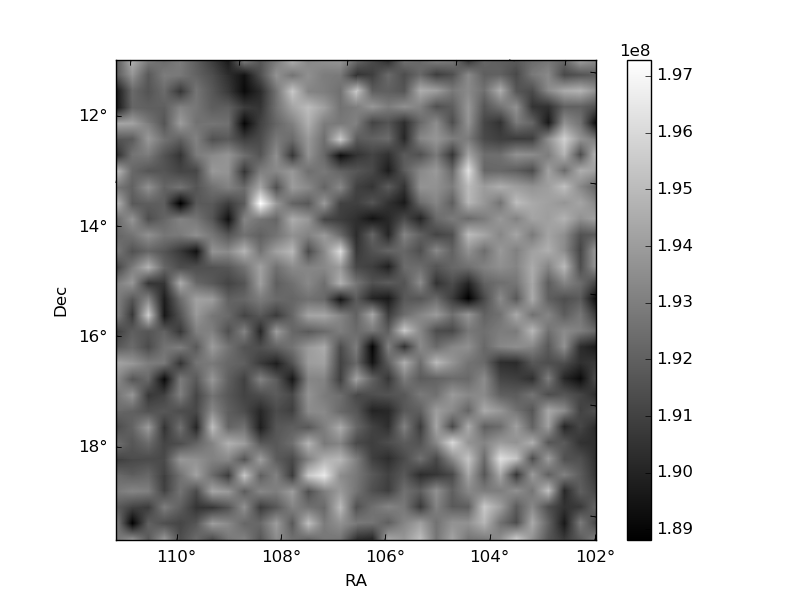
Histogram calculated using DETX and DETY for each event in the final _common_clean file
| Quadrant A | 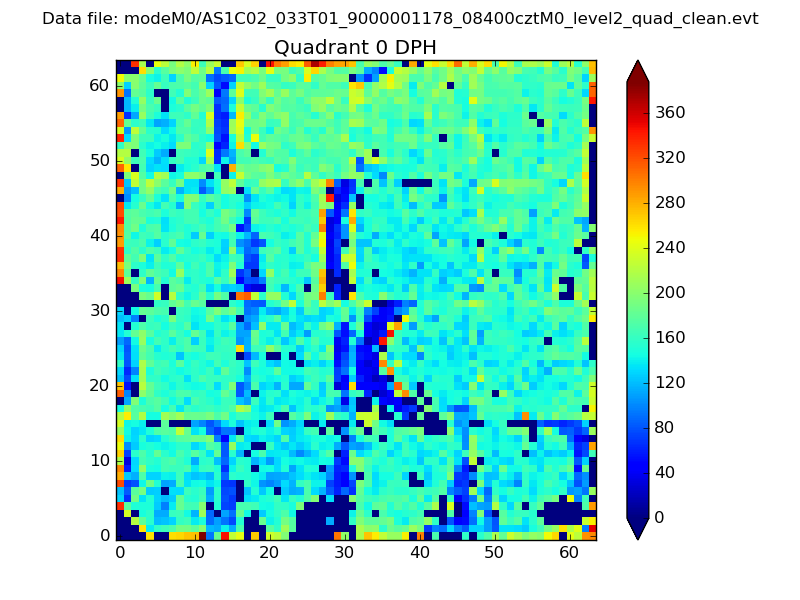 |
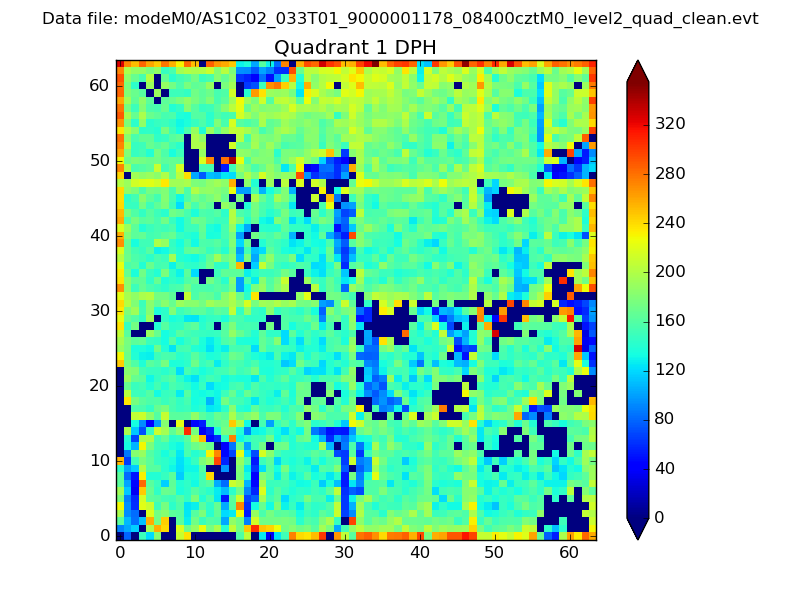 |
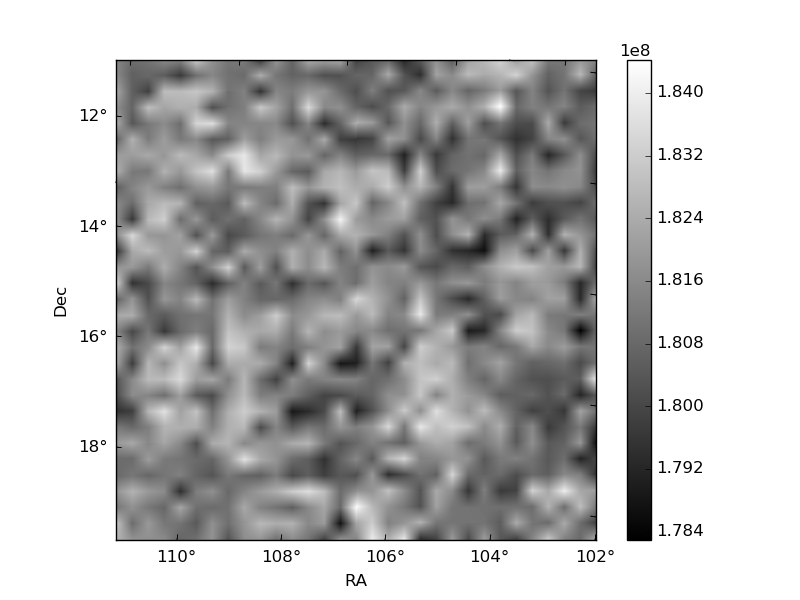
Quadrant B |
|---|---|---|---|
| Quadrant D | 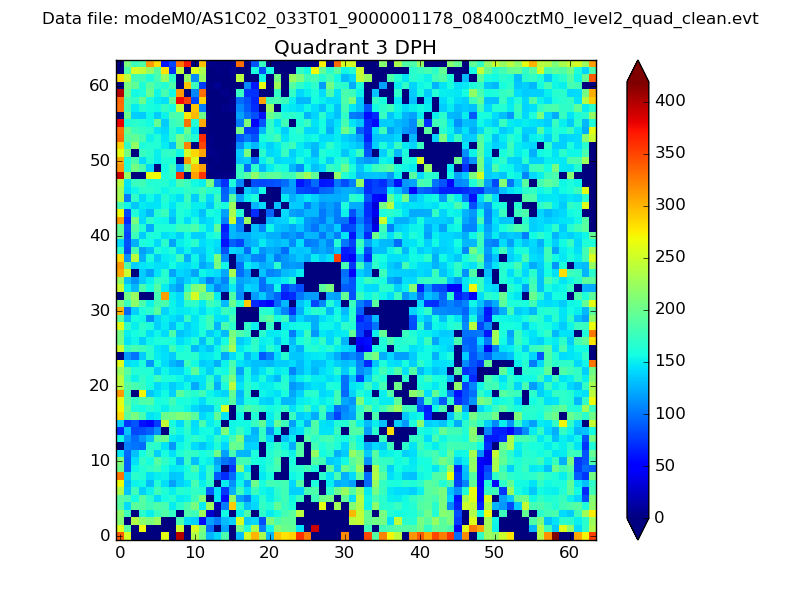 |
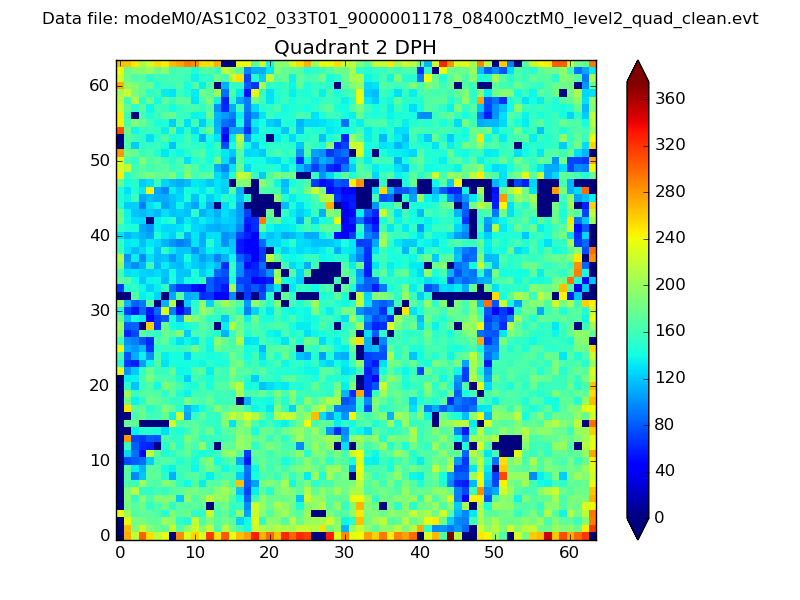 |
Quadrant C |
| Plot type | Count rate plots | Images |
|---|---|---|
| Comparison with Poisson distribution Blue bars denote a histogram of data divided into 1 sec bins. Red curve is a Poisson curve with rate = median count rate of data. |
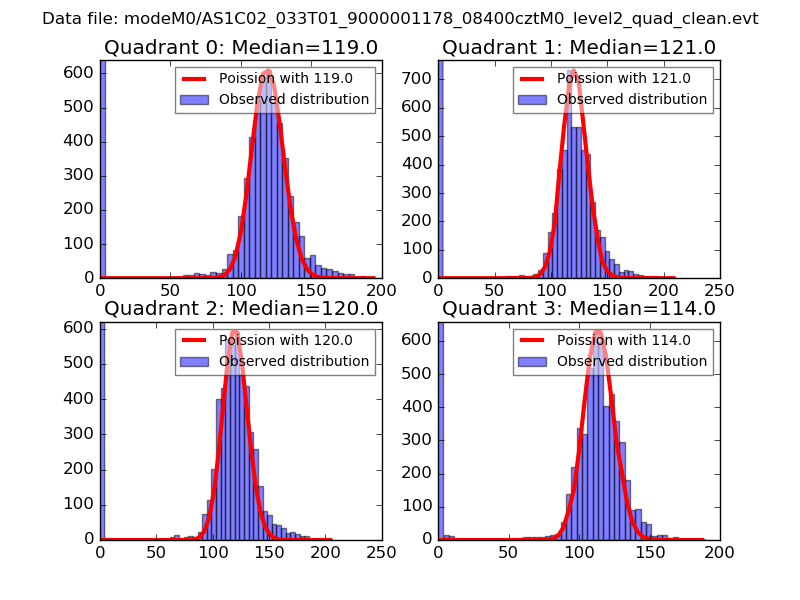 |
 |
| Quadrant-wise count rates Data is divided into 100 sec bins |
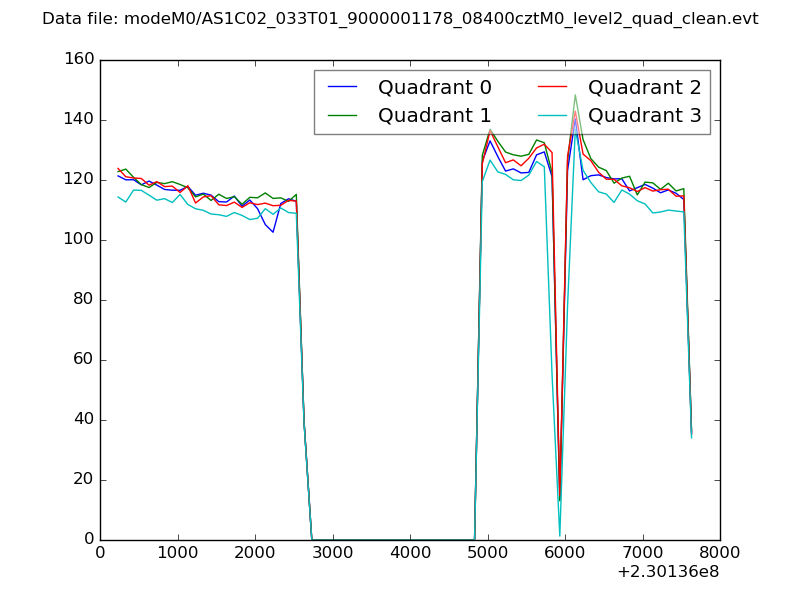 |
|
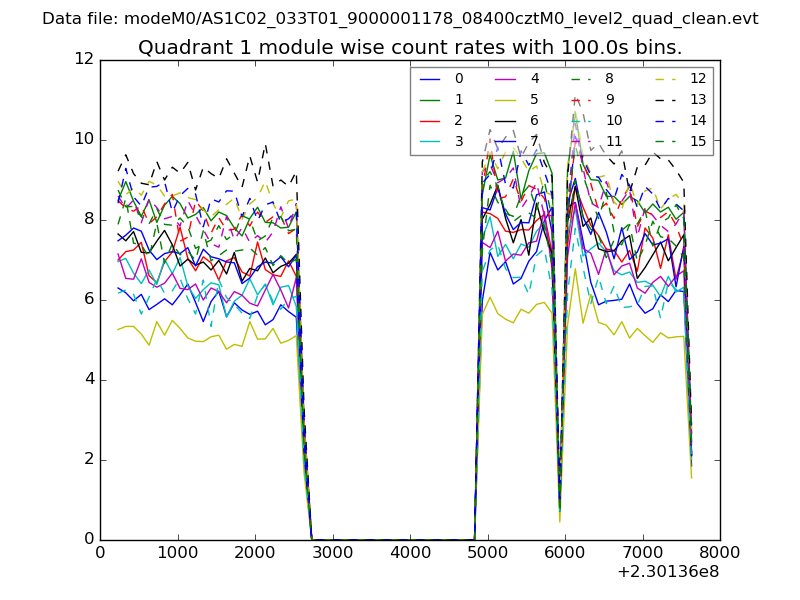
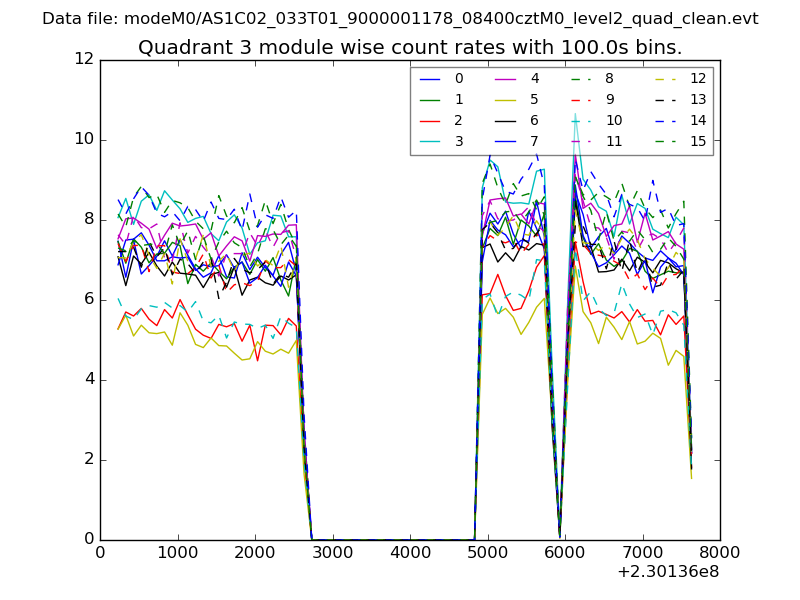
| Module-wise count rates for Quadrant A Data is divided into 100 sec bins |
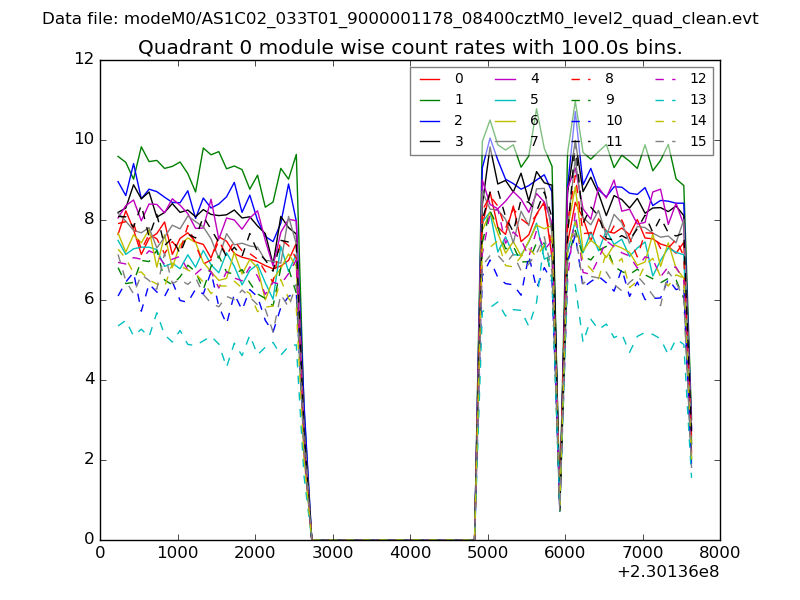 |
 |
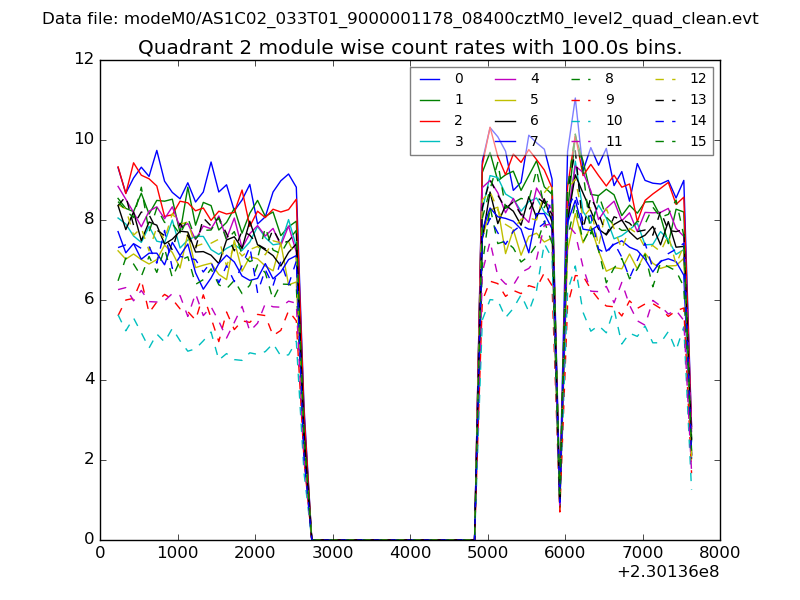
| Module-wise count rates for Quadrant B Data is divided into 100 sec bins |
 |
 |
| Module-wise count rates for Quadrant C Data is divided into 100 sec bins |
 |
 |
| Module-wise count rates for Quadrant D Data is divided into 100 sec bins |
 |
 |
| Parameter | Plot |
|---|---|
| CZT HV Monitor | 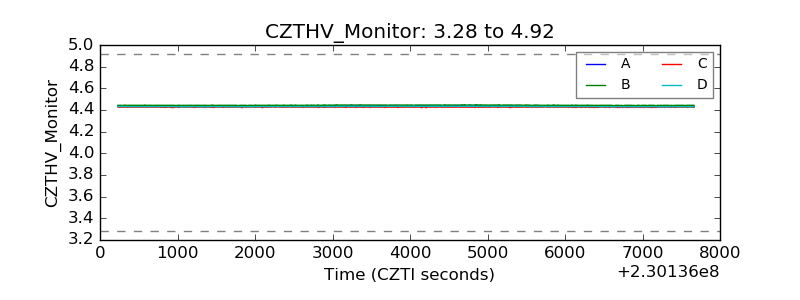 |
| D_VDD | 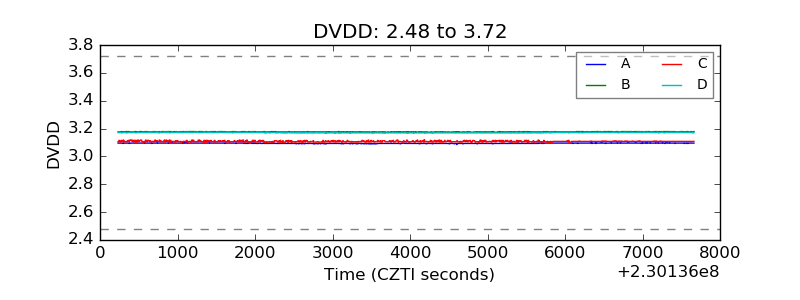 |
| Temperature 1 | 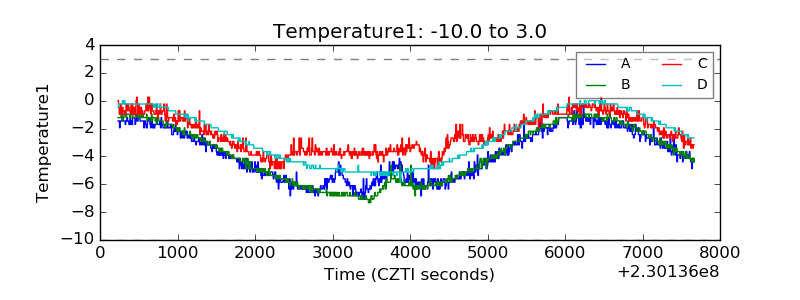 |
| Veto HV Monitor | 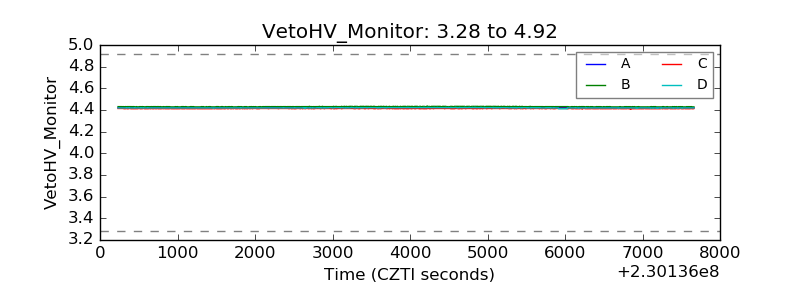 |
| Veto LLD | 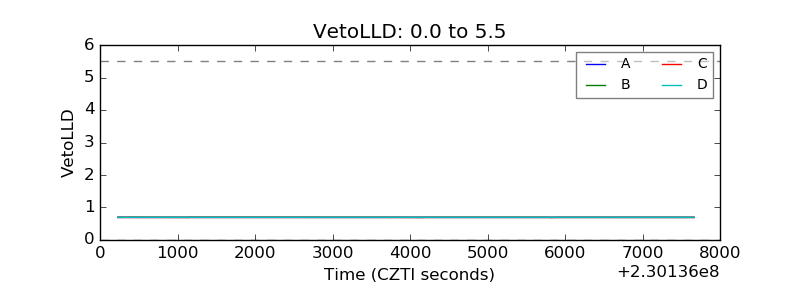 |
| Alpha Counter | 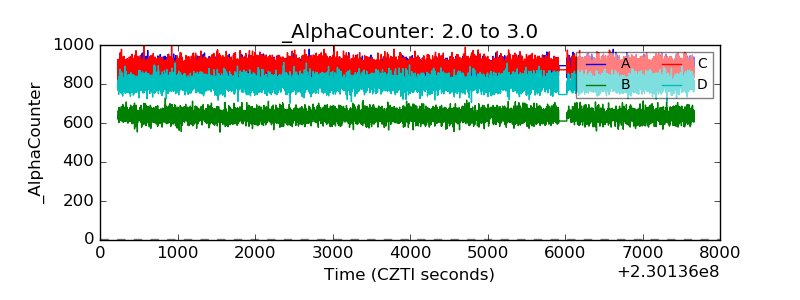 |
| _CPM_Rate | 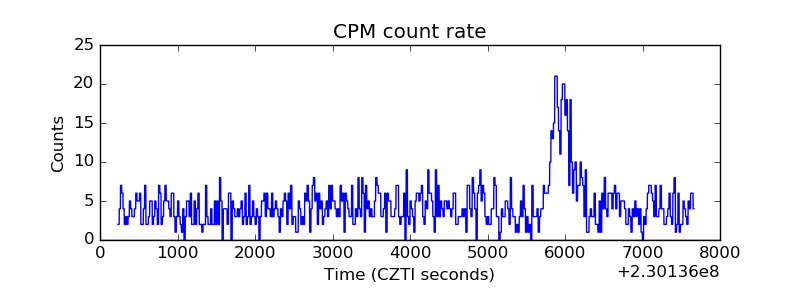 |
| CZT Counter | 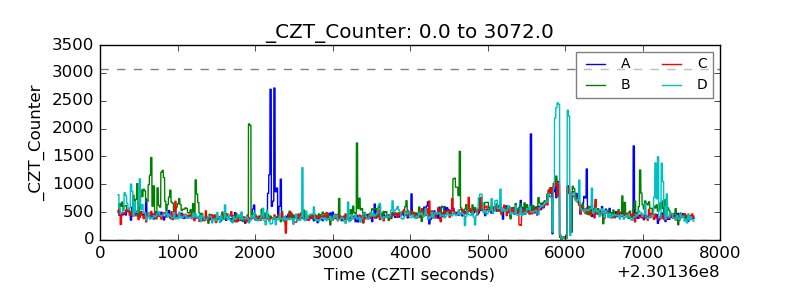 |
| +2.5 Volts monitor |  |
| +5 Volts monitor | 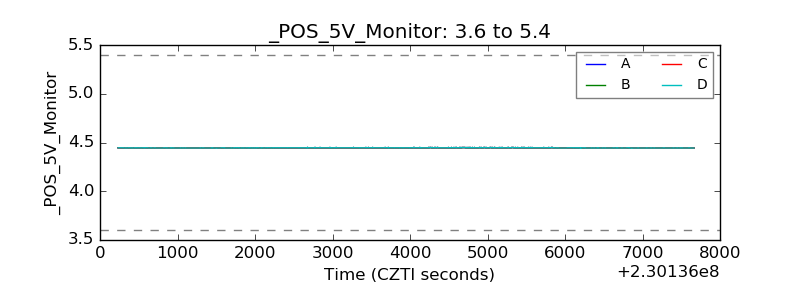 |
| _ROLL_ROT | 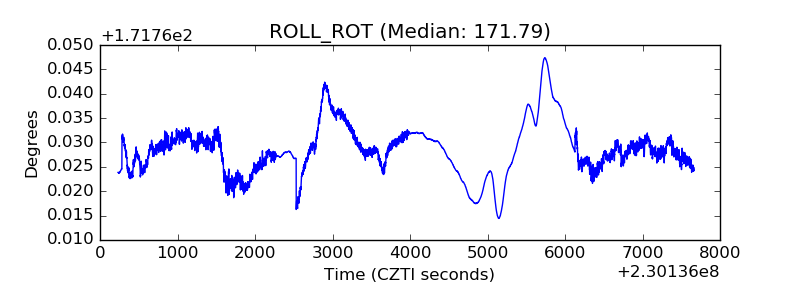 |
| _Roll_DEC | 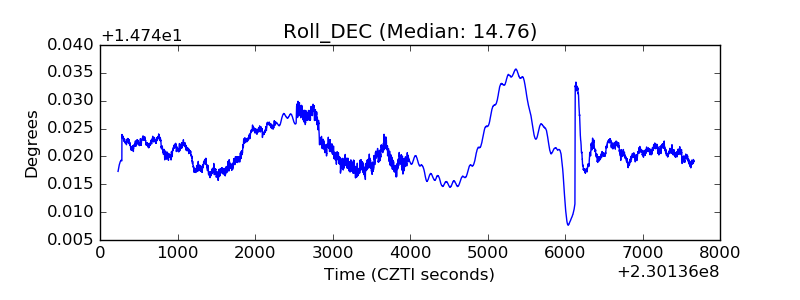 |
| _Roll_RA | 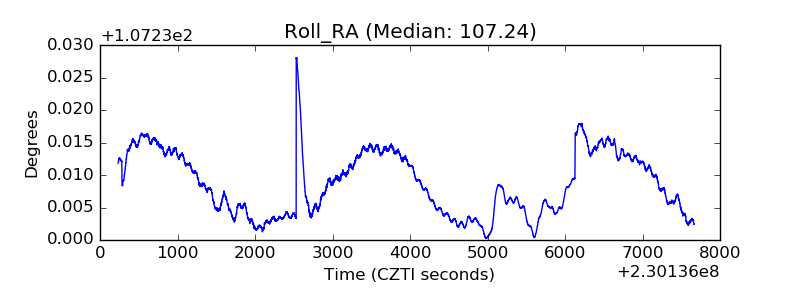 |
| Veto Counter | 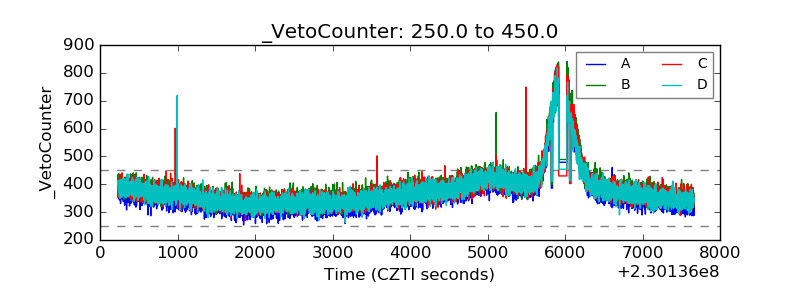 |