| Param | Original file | Final file |
|---|---|---|
| Filename | modeM0/AS1C02_033T01_9000001178_08403cztM0_level2.evt | modeM0/AS1C02_033T01_9000001178_08403cztM0_level2_quad_clean.evt |
| Size (bytes) | 491,440,320 | 92,557,440 |
| Size | 468.7 MB | 88.3 MB |
| Events in quadrant A | 3,574,901 | 581,770 |
| Events in quadrant B | 3,719,241 | 594,913 |
| Events in quadrant C | 3,260,487 | 587,655 |
| Events in quadrant D | 3,848,875 | 546,580 |
| Mode M9 | |||
|---|---|---|---|
| Quadrant | BADHDUFLAG | Total packets | Discarded packets |
| A | 0 | 5 | 0 |
| B | 0 | 5 | 0 |
| C | 0 | 5 | 0 |
| D | 0 | 5 | 0 |
| Mode M0 | |||
|---|---|---|---|
| Quadrant | BADHDUFLAG | Total packets | Discarded packets |
| A | 0 | 15541 | 3 |
| B | 0 | 15721 | 5 |
| C | 0 | 14625 | 3 |
| D | 0 | 16452 | 3 |
| Mode SS | |||
|---|---|---|---|
| Quadrant | BADHDUFLAG | Total packets | Discarded packets |
| A | 0 | 146 | 0 |
| B | 0 | 146 | 0 |
| C | 0 | 146 | 0 |
| D | 0 | 146 | 0 |
| Quadrant | Total seconds | Saturated seconds | Saturation percentage |
|---|---|---|---|
| A | 7060 | 189 | 2.677054% |
| B | 7059 | 156 | 2.209945% |
| C | 7060 | 73 | 1.033994% |
| D | 7060 | 177 | 2.507082% |
Noise dominated data is calculated using 1-second bins in cleaned event files. If a bin has >2000 counts, and if more than 50% of those come from <1% of pixels, then it is considered to be noise-dominated and hence unusable.
| Quadrant | # 1 sec bins | Bins with >0 counts | Bins with >2000 counts | High rate bins dominated by noise | Noise dominated (total time) | Noise dominated (detector-on time) | Marked lightcurve |
|---|---|---|---|---|---|---|---|
| A | 7610 | 7063 | 42 | 42 | 0.55% | 0.59% | 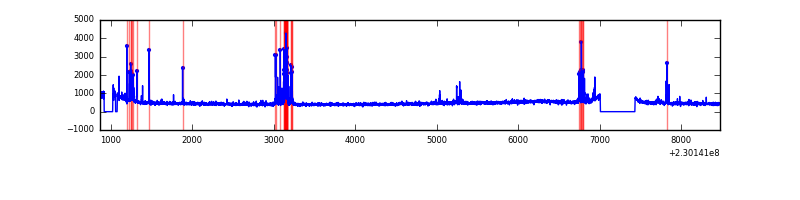 |
| B | 7610 | 7063 | 18 | 18 | 0.24% | 0.25% | 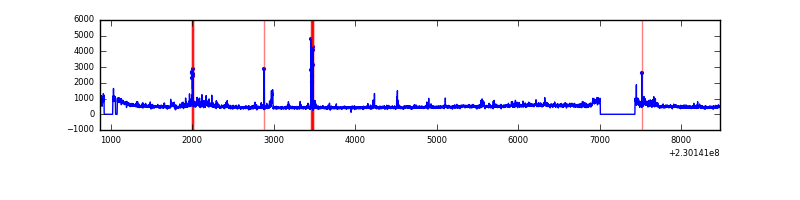 |
| C | 7610 | 7063 | 1 | 1 | 0.01% | 0.01% | 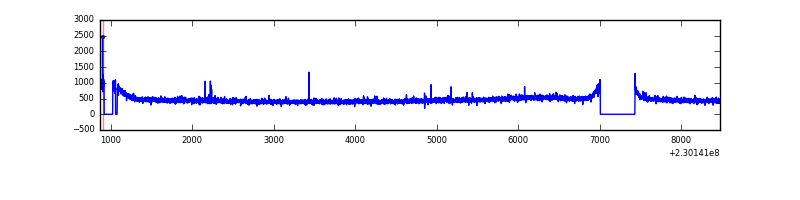 |
| D | 7610 | 7061 | 126 | 126 | 1.66% | 1.78% |  |
Top three noisy pixels from each quadrant. If the there are fewer than three noisy pixels in the level2.evt file, extra rows are filled as -1
| Pixel properties | Quadrant properties | ||||||
|---|---|---|---|---|---|---|---|
| Quadrant | DetID | PixID | Counts | Sigma | Mean | Median | Sigma |
| A | 5 | 16 | 258860 | 1477.44 | 848 | 829 | 174.6 |
| A | 14 | 111 | 39990 | 224.23 | 848 | 829 | 174.6 |
| A | 0 | 254 | 13687 | 73.62 | 848 | 829 | 174.6 |
| B | 0 | 231 | 164380 | 994.34 | 855 | 832 | 164.5 |
| B | 0 | 214 | 64240 | 385.51 | 855 | 832 | 164.5 |
| B | 5 | 250 | 40998 | 244.2 | 855 | 832 | 164.5 |
| C | 1 | 16 | 11784 | 56.13 | 830 | 833 | 195.1 |
| C | 13 | 61 | 6455 | 28.82 | 830 | 833 | 195.1 |
| C | 8 | 128 | 3395 | 13.13 | 830 | 833 | 195.1 |
| D | 1 | 7 | 231627 | 1159.9 | 810 | 783 | 199.0 |
| D | 7 | 71 | 171199 | 856.27 | 810 | 783 | 199.0 |
| D | 14 | 34 | 86925 | 432.83 | 810 | 783 | 199.0 |
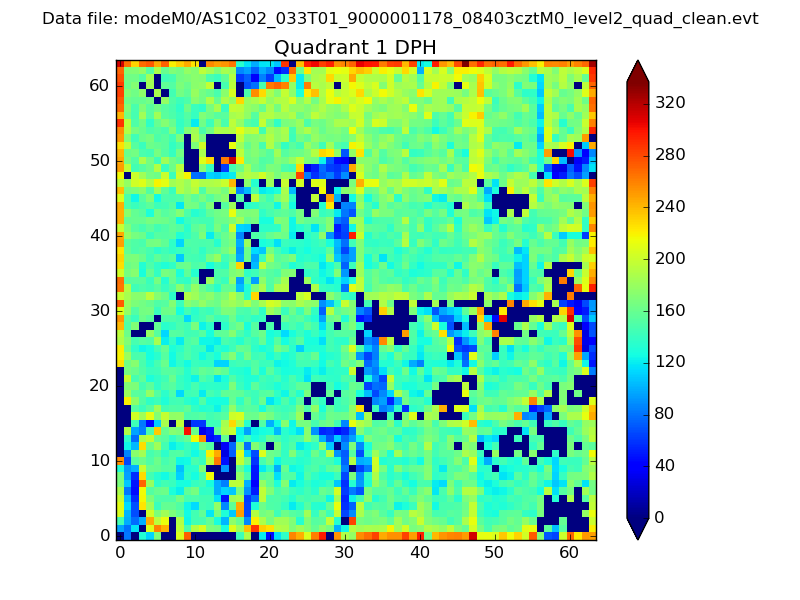
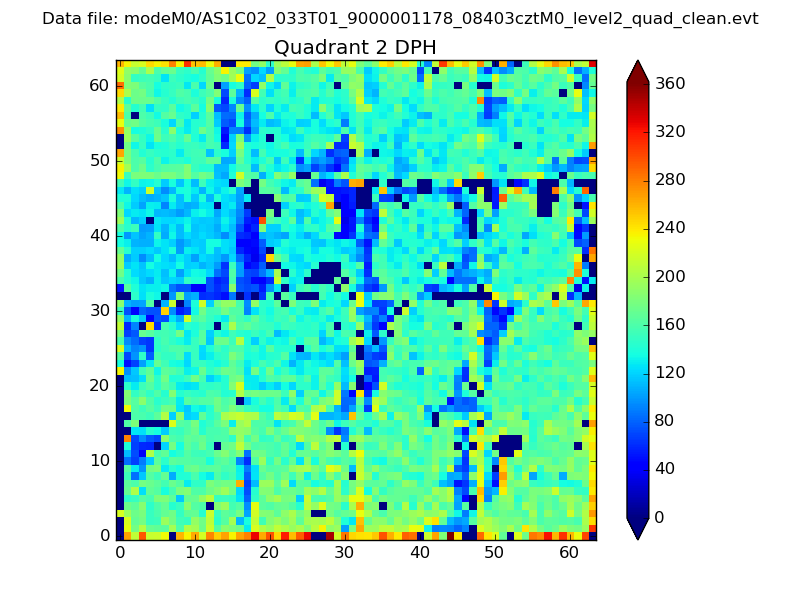
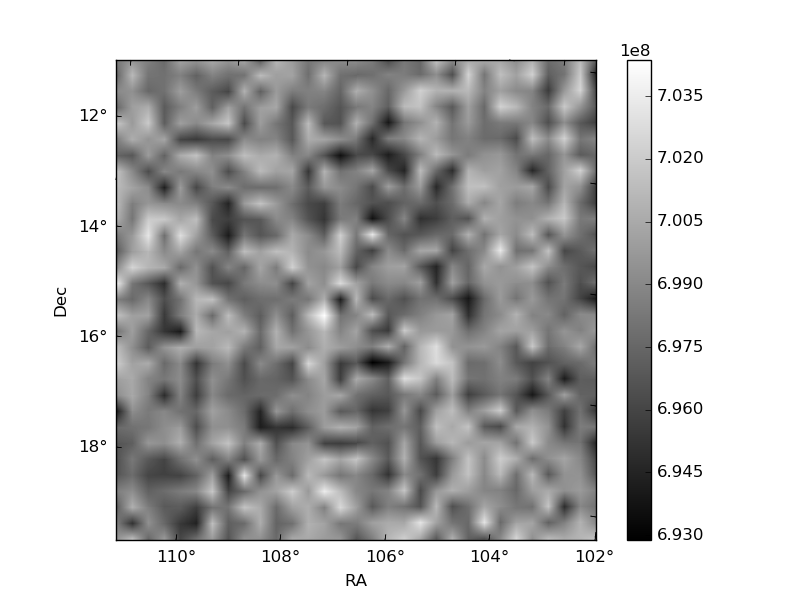
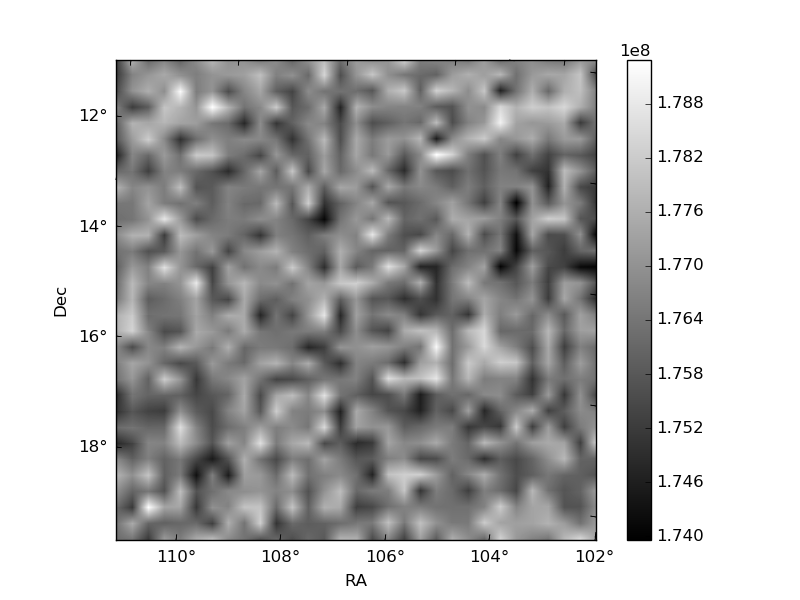
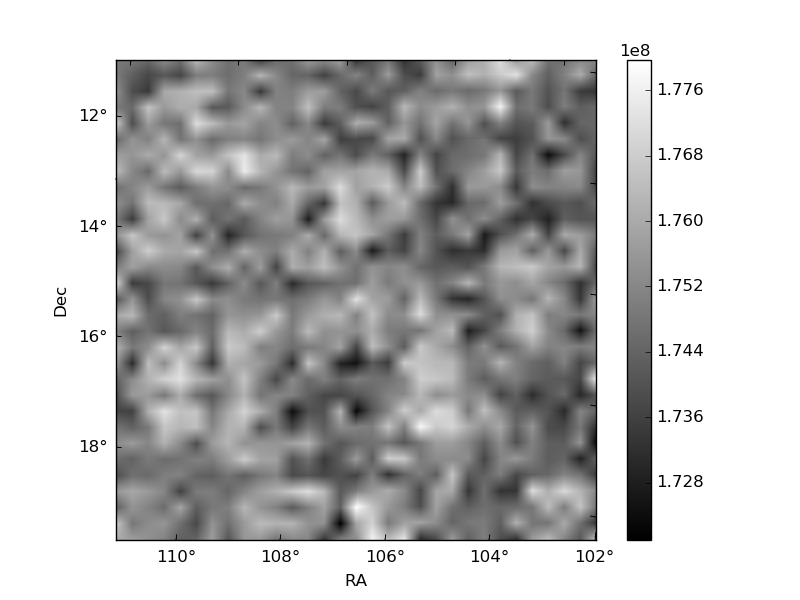
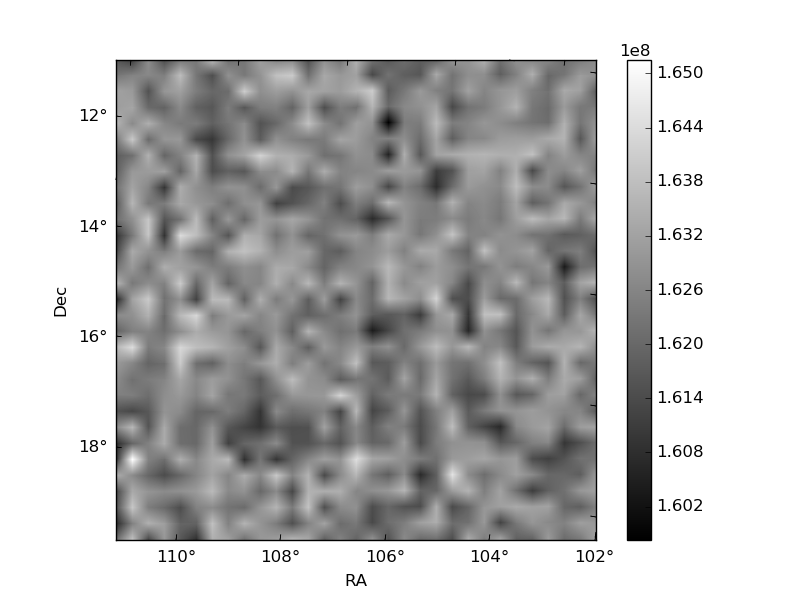
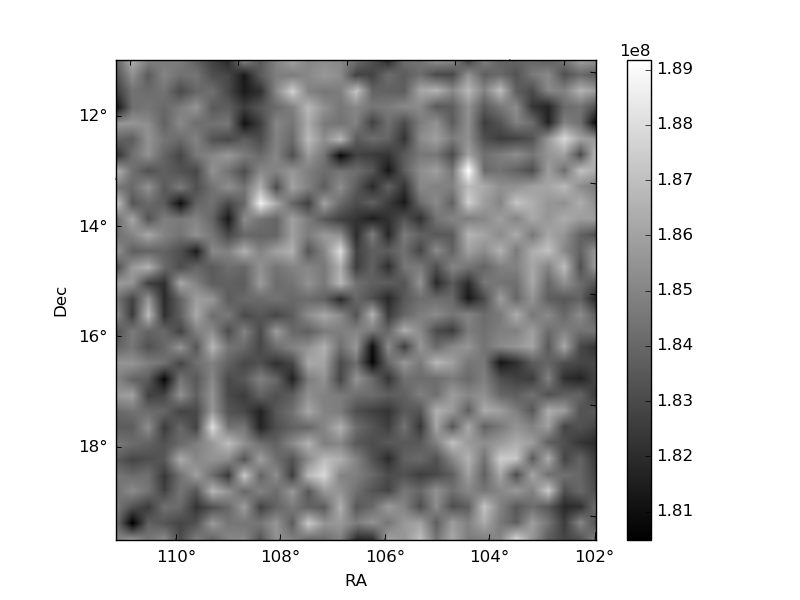
Histogram calculated using DETX and DETY for each event in the final _common_clean file
| Quadrant A | 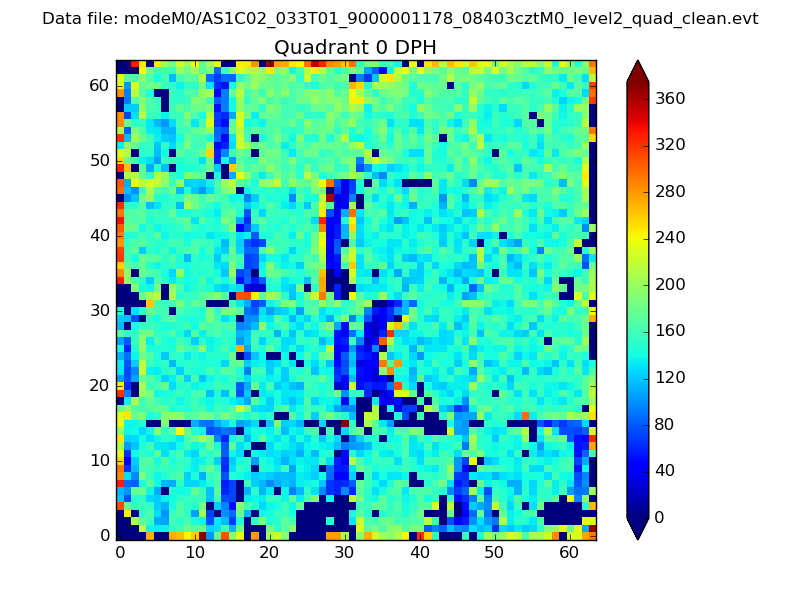 |
 |
Quadrant B |
|---|---|---|---|
| Quadrant D | 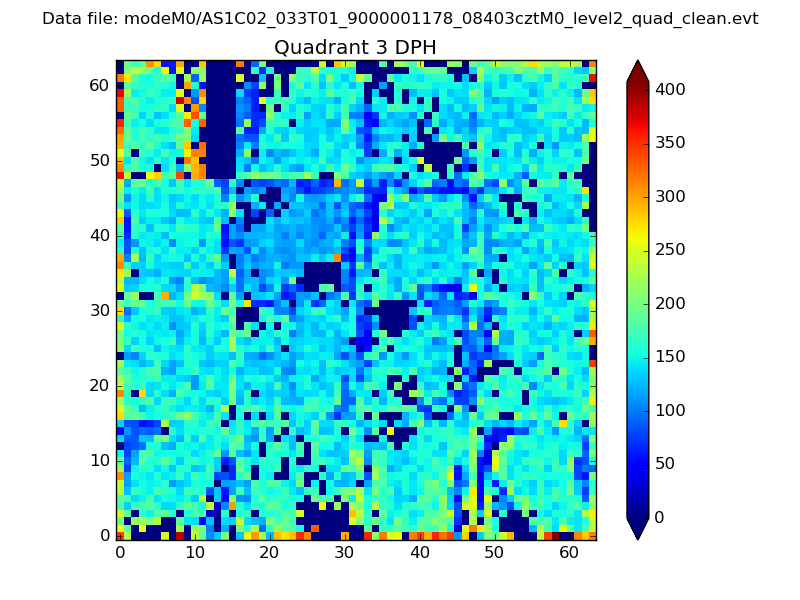 |
 |
Quadrant C |
| Plot type | Count rate plots | Images |
|---|---|---|
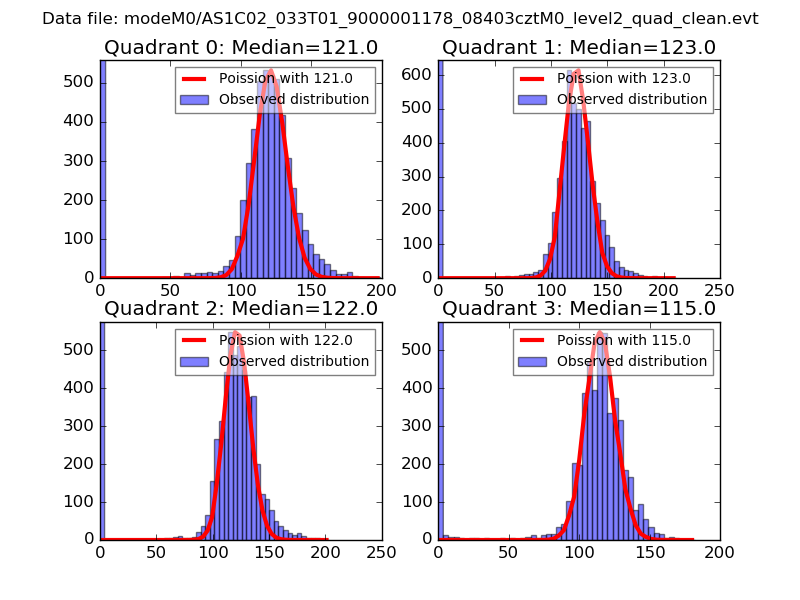
| Comparison with Poisson distribution Blue bars denote a histogram of data divided into 1 sec bins. Red curve is a Poisson curve with rate = median count rate of data. |
 |
 |
| Quadrant-wise count rates Data is divided into 100 sec bins |
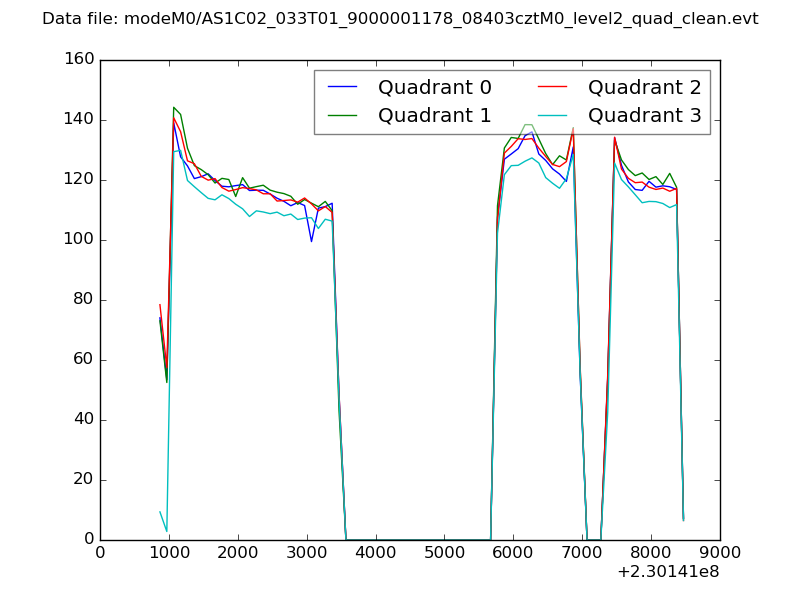 |
|
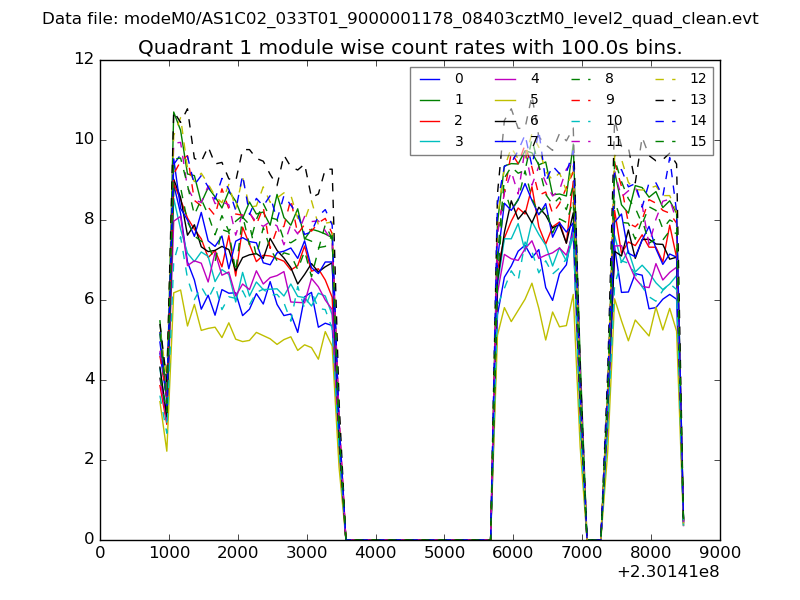
| Module-wise count rates for Quadrant A Data is divided into 100 sec bins |
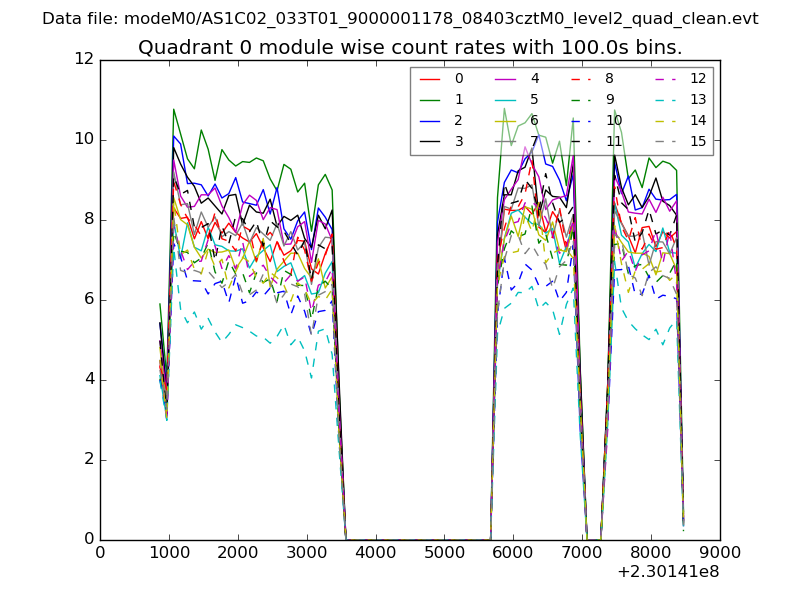 |
 |
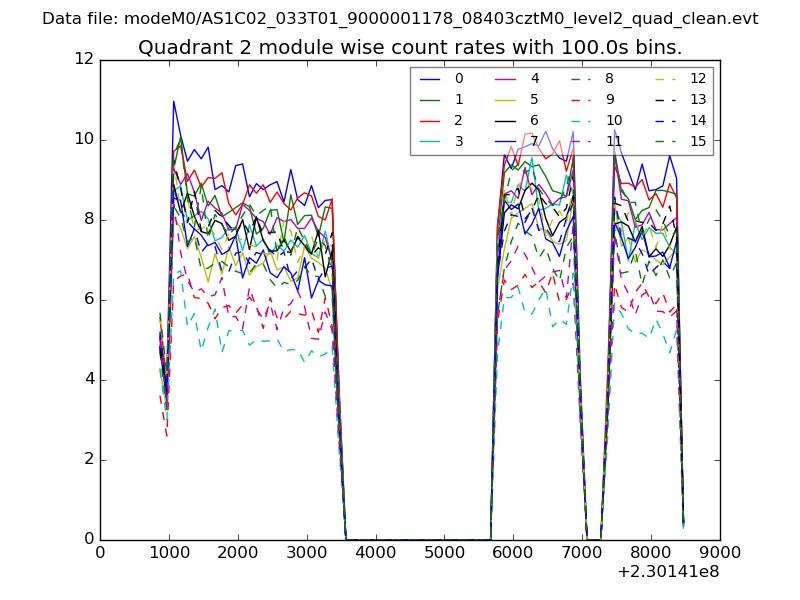
| Module-wise count rates for Quadrant B Data is divided into 100 sec bins |
 |
 |
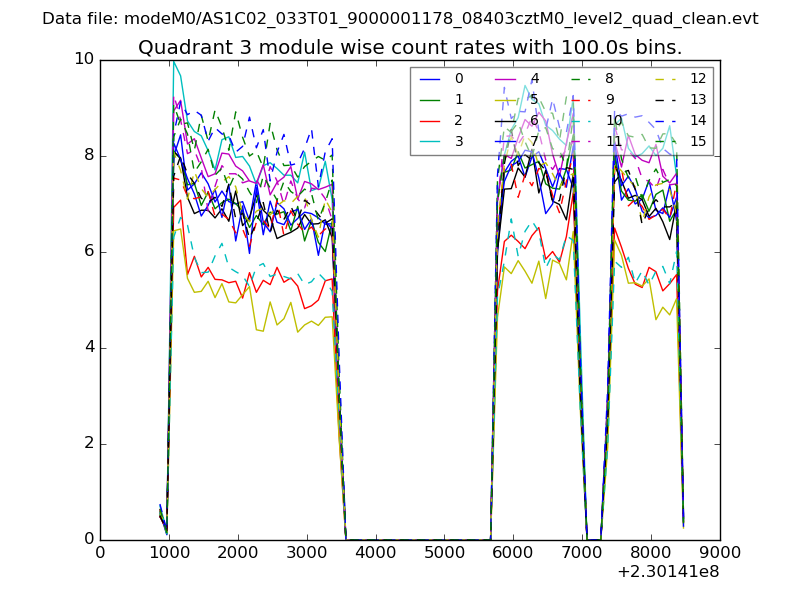
| Module-wise count rates for Quadrant C Data is divided into 100 sec bins |
 |
 |
| Module-wise count rates for Quadrant D Data is divided into 100 sec bins |
 |
 |
| Parameter | Plot |
|---|---|
| CZT HV Monitor | 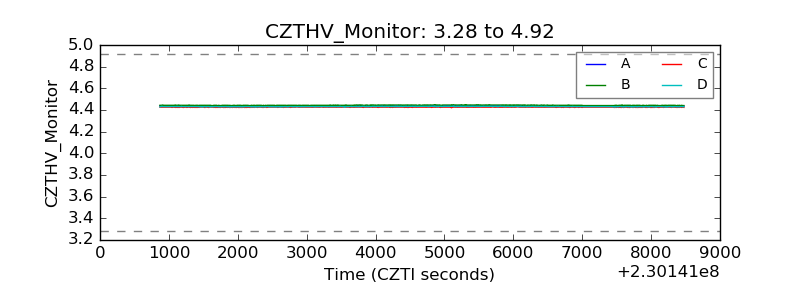 |
| D_VDD | 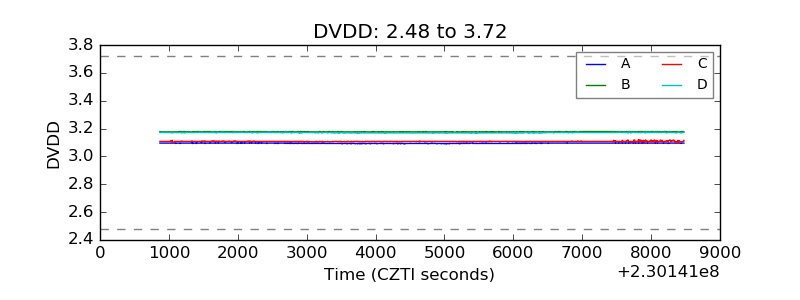 |
| Temperature 1 | 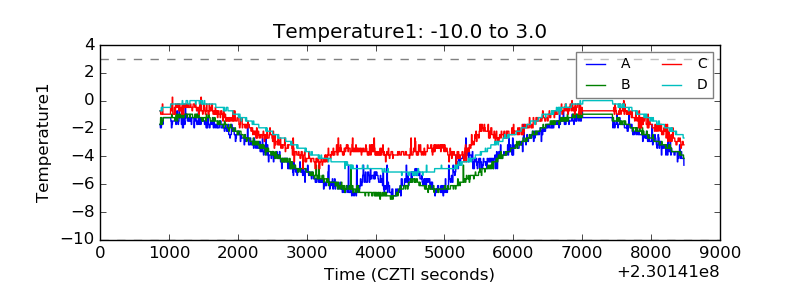 |
| Veto HV Monitor |  |
| Veto LLD | 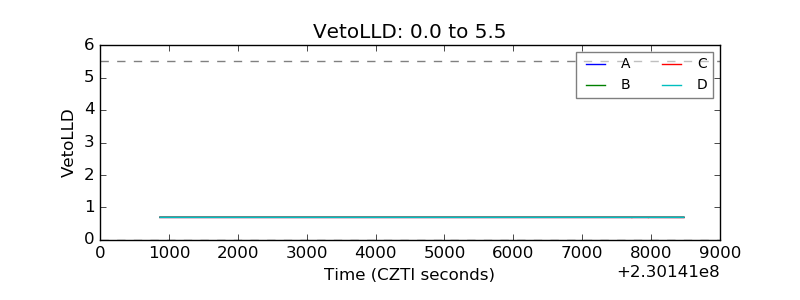 |
| Alpha Counter | 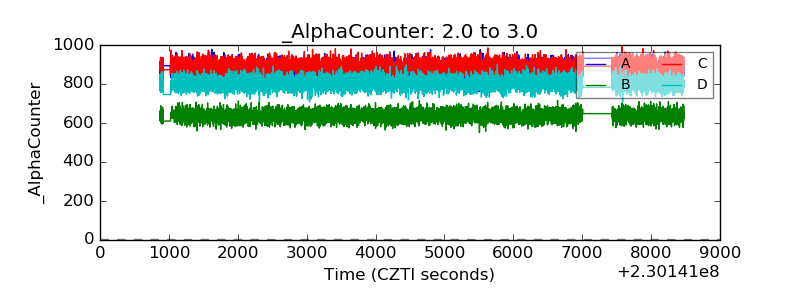 |
| _CPM_Rate | 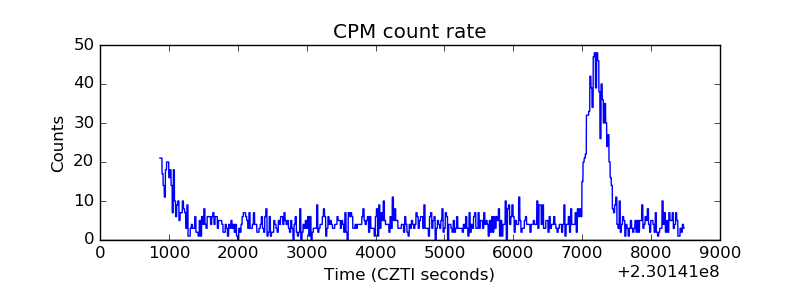 |
| CZT Counter | 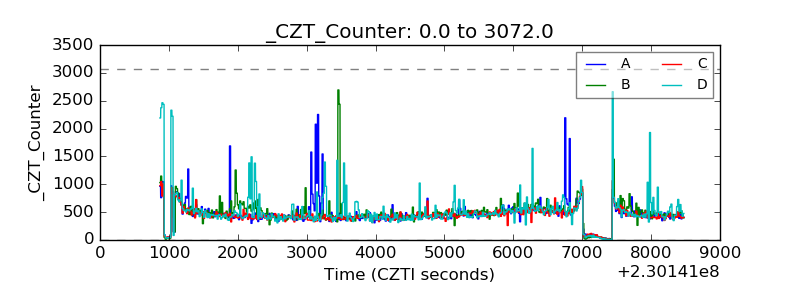 |
| +2.5 Volts monitor |  |
| +5 Volts monitor |  |
| _ROLL_ROT | 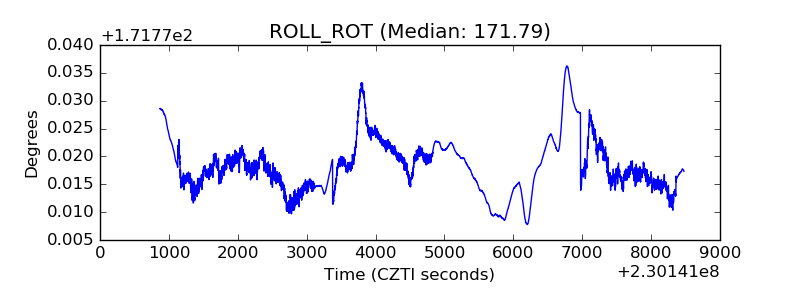 |
| _Roll_DEC | 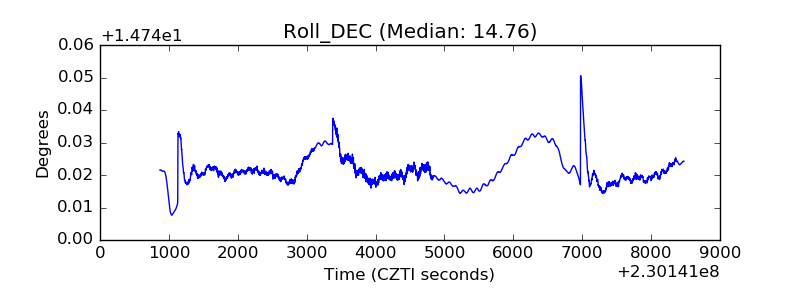 |
| _Roll_RA | 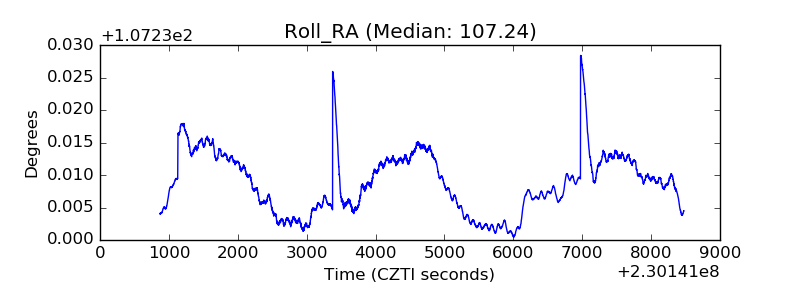 |
| Veto Counter | 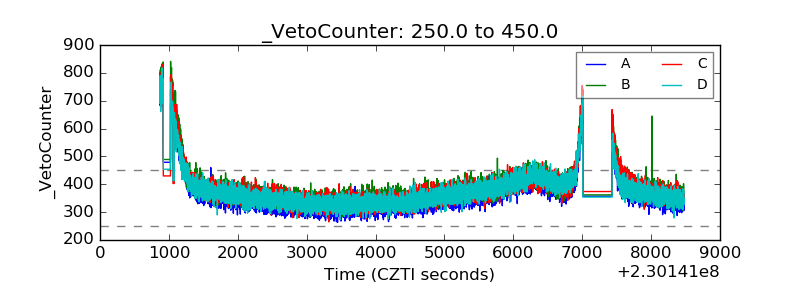 |