| Param | Original file | Final file |
|---|---|---|
| Filename | modeM0/AS1G07_027T01_9000001180_08403cztM0_level2.evt | modeM0/AS1G07_027T01_9000001180_08403cztM0_level2_quad_clean.evt |
| Size (bytes) | 680,420,160 | 151,776,000 |
| Size | 648.9 MB | 144.7 MB |
| Events in quadrant A | 4,844,818 | 975,227 |
| Events in quadrant B | 5,268,977 | 979,556 |
| Events in quadrant C | 4,680,022 | 983,471 |
| Events in quadrant D | 5,115,390 | 946,213 |
| Mode SS | |||
|---|---|---|---|
| Quadrant | BADHDUFLAG | Total packets | Discarded packets |
| A | 0 | 210 | 0 |
| B | 0 | 210 | 0 |
| C | 0 | 210 | 0 |
| D | 0 | 210 | 0 |
| Mode M9 | |||
|---|---|---|---|
| Quadrant | BADHDUFLAG | Total packets | Discarded packets |
| A | 0 | 14 | 0 |
| B | 0 | 14 | 0 |
| C | 0 | 14 | 0 |
| D | 0 | 14 | 0 |
| Mode M0 | |||
|---|---|---|---|
| Quadrant | BADHDUFLAG | Total packets | Discarded packets |
| A | 0 | 21206 | 3 |
| B | 0 | 22255 | 2 |
| C | 0 | 20813 | 2 |
| D | 0 | 22342 | 2 |
| Quadrant | Total seconds | Saturated seconds | Saturation percentage |
|---|---|---|---|
| A | 10285 | 51 | 0.495868% |
| B | 10285 | 82 | 0.797278% |
| C | 10285 | 28 | 0.272241% |
| D | 10285 | 129 | 1.254254% |
Noise dominated data is calculated using 1-second bins in cleaned event files. If a bin has >2000 counts, and if more than 50% of those come from <1% of pixels, then it is considered to be noise-dominated and hence unusable.
| Quadrant | # 1 sec bins | Bins with >0 counts | Bins with >2000 counts | High rate bins dominated by noise | Noise dominated (total time) | Noise dominated (detector-on time) | Marked lightcurve |
|---|---|---|---|---|---|---|---|
| A | 11740 | 10287 | 9 | 9 | 0.08% | 0.09% | 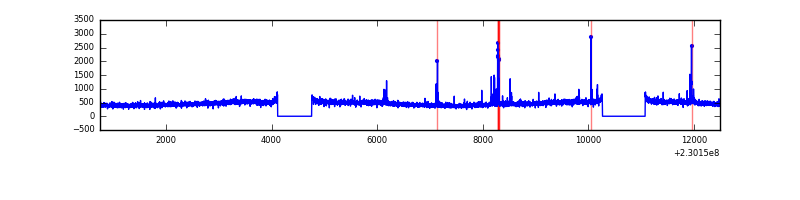 |
| B | 11740 | 10287 | 15 | 15 | 0.13% | 0.15% | 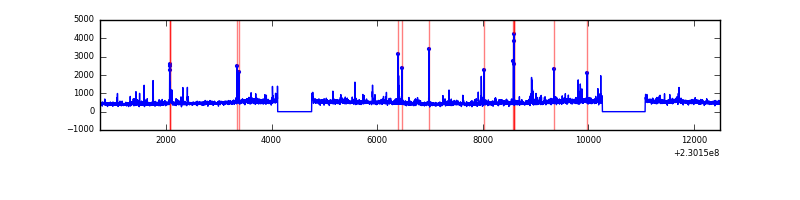 |
| C | 11740 | 10286 | 0 | 0 | 0.00% | 0.00% | 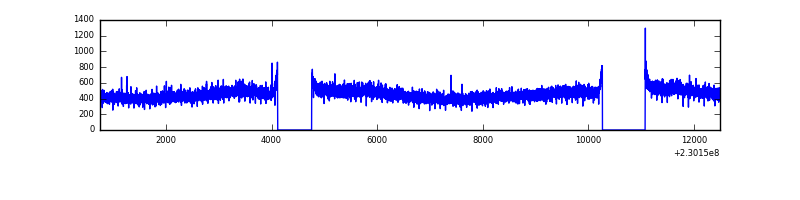 |
| D | 11740 | 10287 | 79 | 79 | 0.67% | 0.77% | 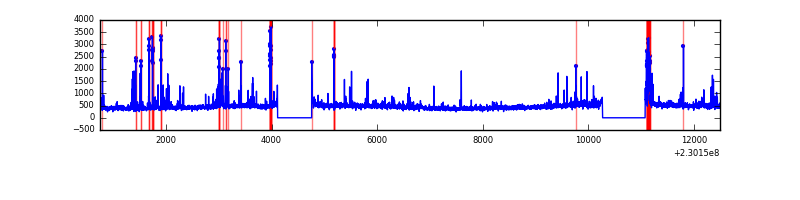 |
Top three noisy pixels from each quadrant. If the there are fewer than three noisy pixels in the level2.evt file, extra rows are filled as -1
| Pixel properties | Quadrant properties | ||||||
|---|---|---|---|---|---|---|---|
| Quadrant | DetID | PixID | Counts | Sigma | Mean | Median | Sigma |
| A | 5 | 16 | 97633 | 379.44 | 1230 | 1206 | 254.1 |
| A | 15 | 174 | 14657 | 52.93 | 1230 | 1206 | 254.1 |
| A | 0 | 226 | 11381 | 40.04 | 1230 | 1206 | 254.1 |
| B | 0 | 214 | 145443 | 616.63 | 1232 | 1206 | 233.9 |
| B | 4 | 48 | 124501 | 527.1 | 1232 | 1206 | 233.9 |
| B | 5 | 255 | 60135 | 251.93 | 1232 | 1206 | 233.9 |
| C | 13 | 61 | 8964 | 27.98 | 1195 | 1205 | 277.3 |
| C | 8 | 128 | 7847 | 23.95 | 1195 | 1205 | 277.3 |
| C | 12 | 4 | 5700 | 16.21 | 1195 | 1205 | 277.3 |
| D | 4 | 95 | 212700 | 675.9 | 1175 | 1152 | 313.0 |
| D | 7 | 71 | 86738 | 273.45 | 1175 | 1152 | 313.0 |
| D | 2 | 14 | 71223 | 223.88 | 1175 | 1152 | 313.0 |
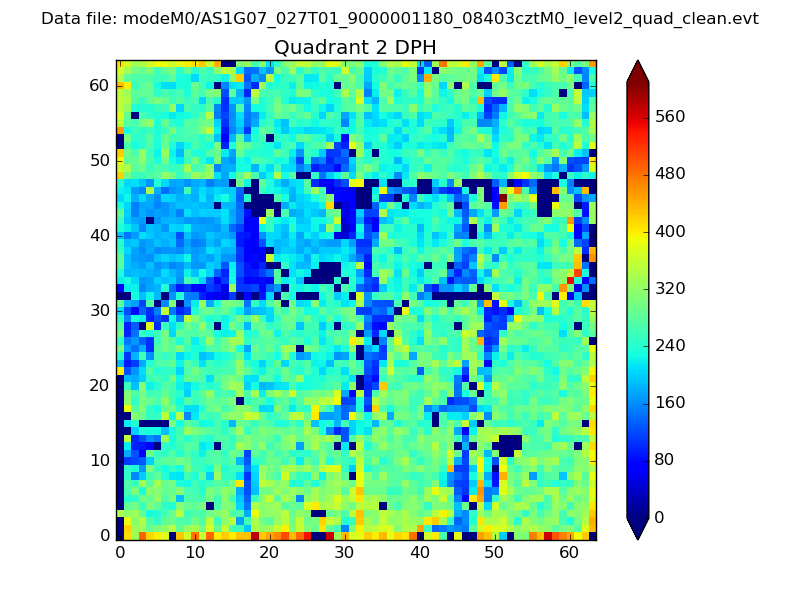
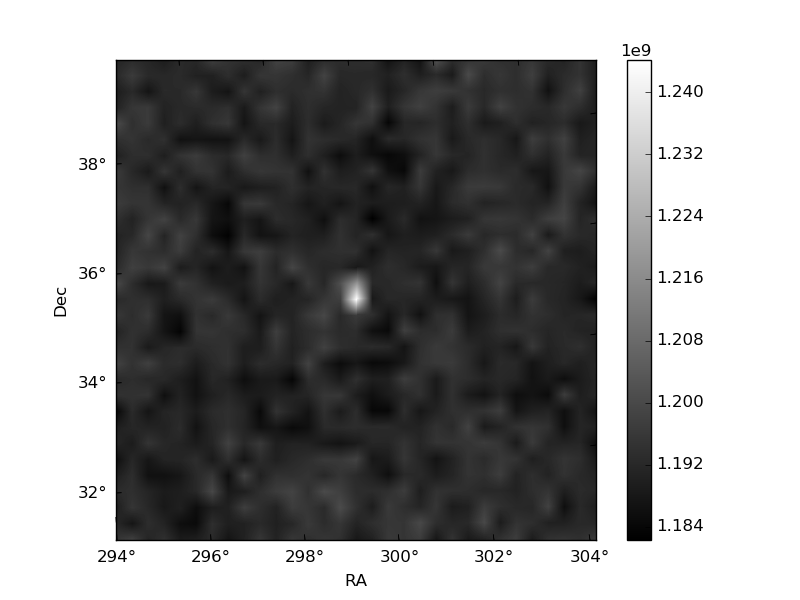
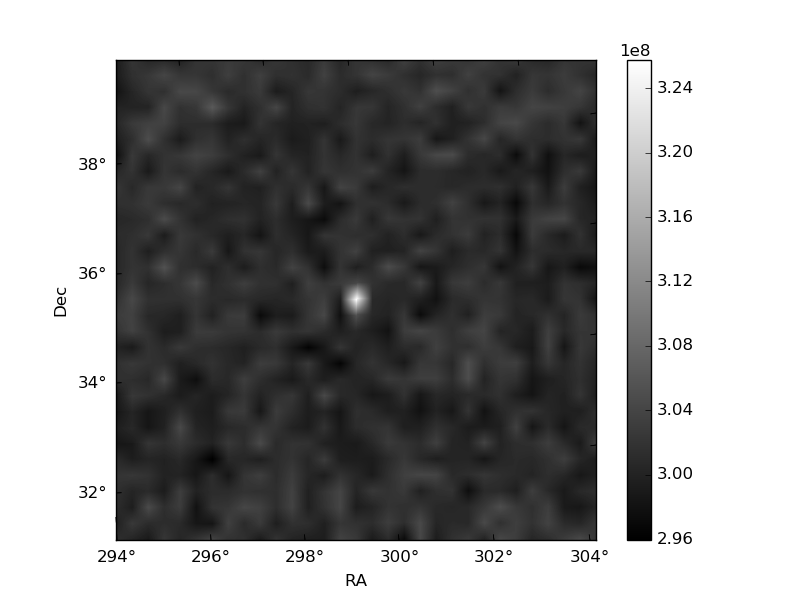
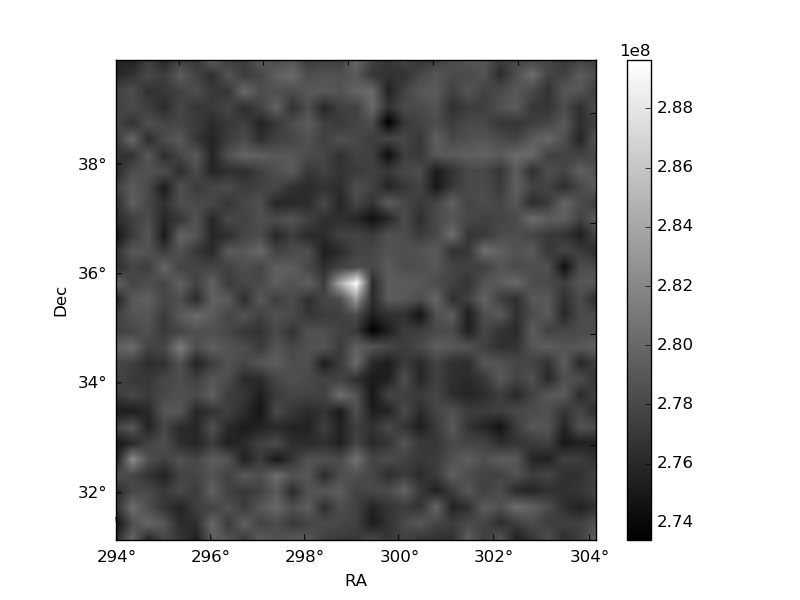
Histogram calculated using DETX and DETY for each event in the final _common_clean file
| Quadrant A | 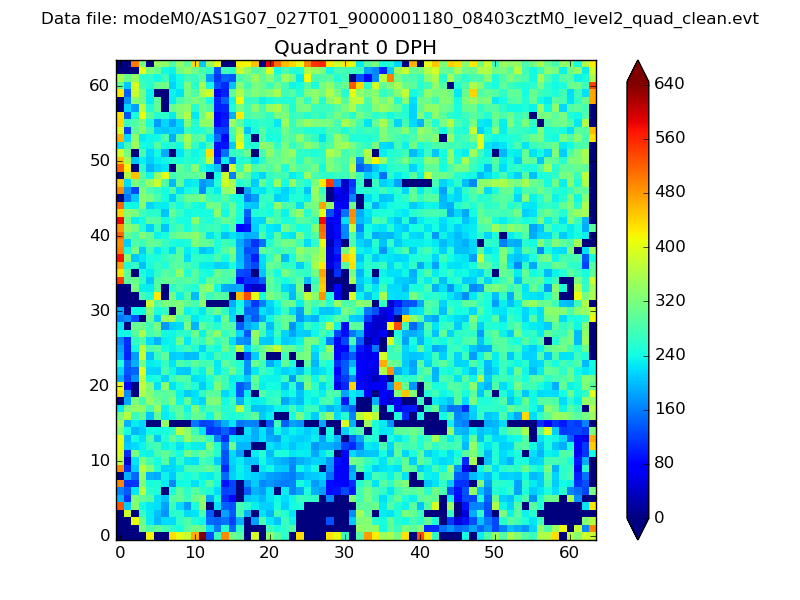 |
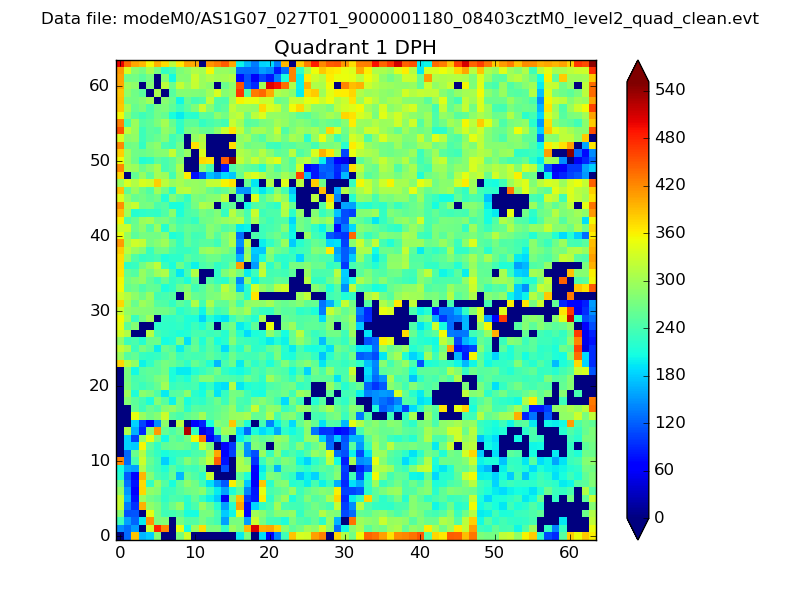 |
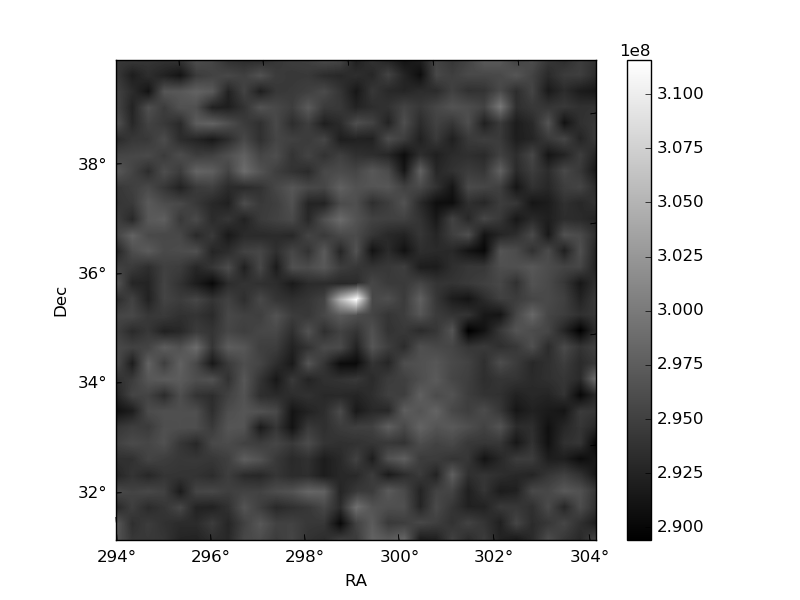
Quadrant B |
|---|---|---|---|
| Quadrant D | 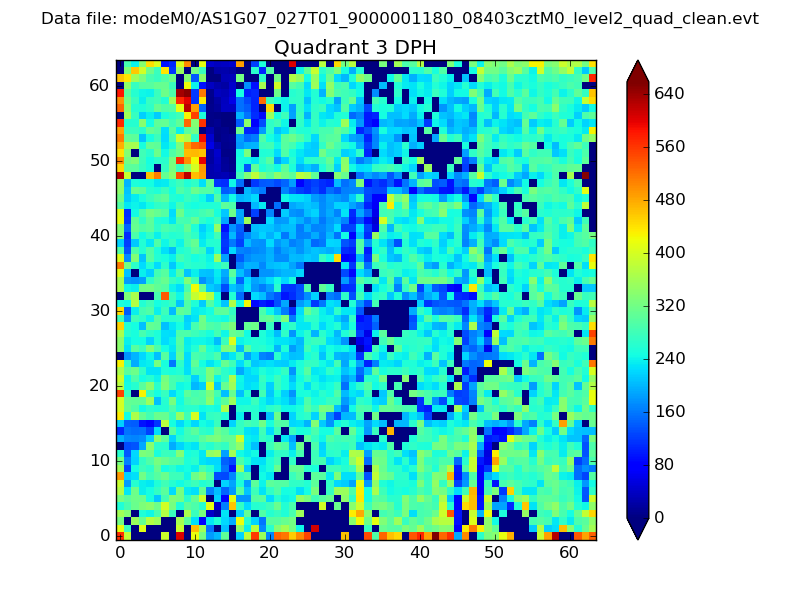 |
 |
Quadrant C |
| Plot type | Count rate plots | Images |
|---|---|---|
| Comparison with Poisson distribution Blue bars denote a histogram of data divided into 1 sec bins. Red curve is a Poisson curve with rate = median count rate of data. |
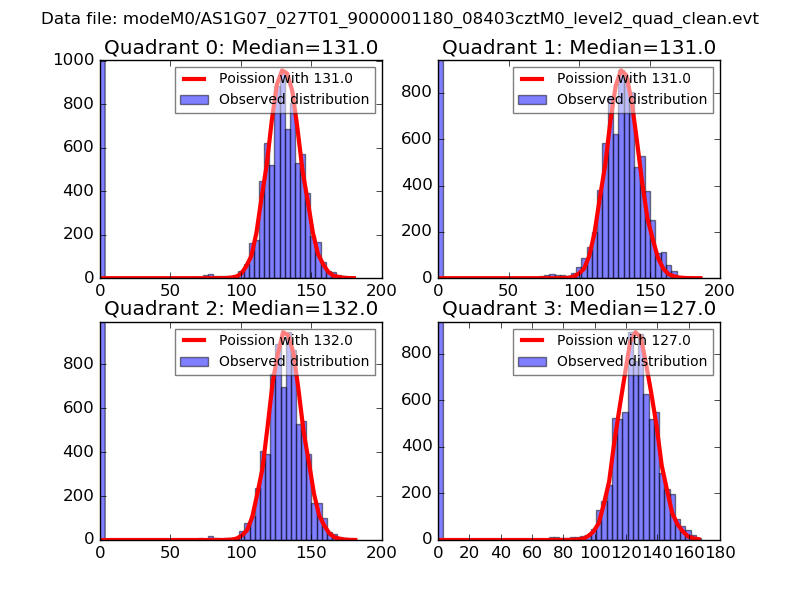 |
 |
| Quadrant-wise count rates Data is divided into 100 sec bins |
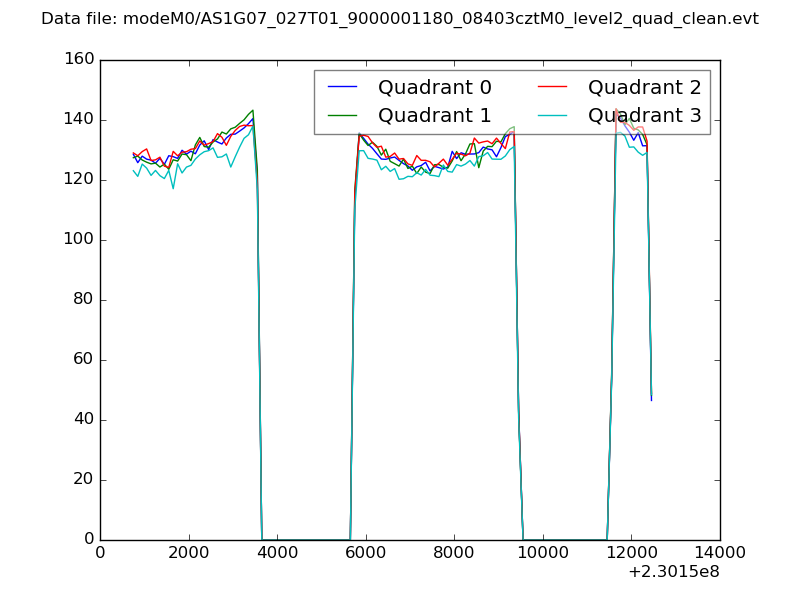 |
|
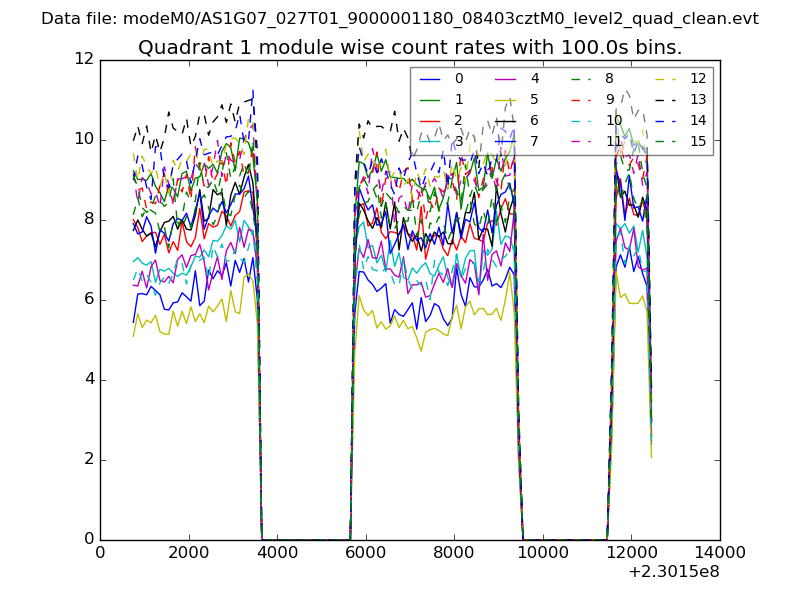
| Module-wise count rates for Quadrant A Data is divided into 100 sec bins |
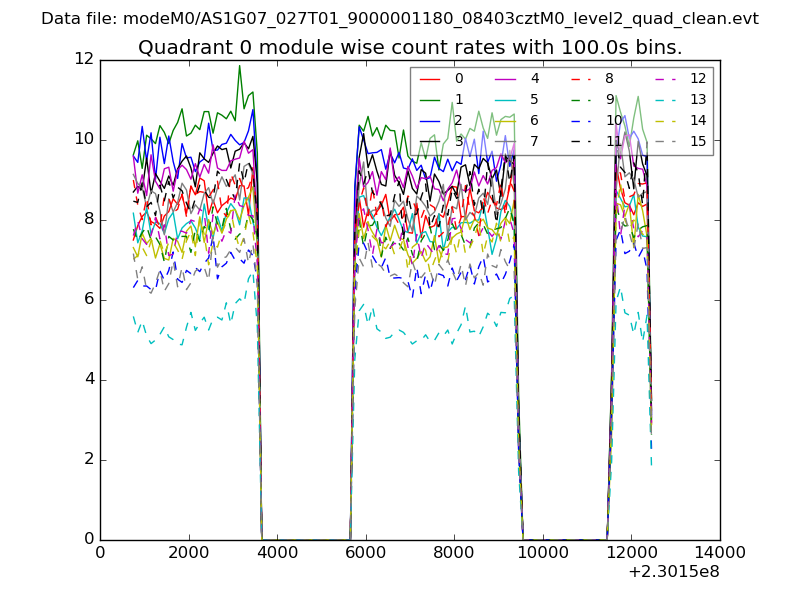 |
 |
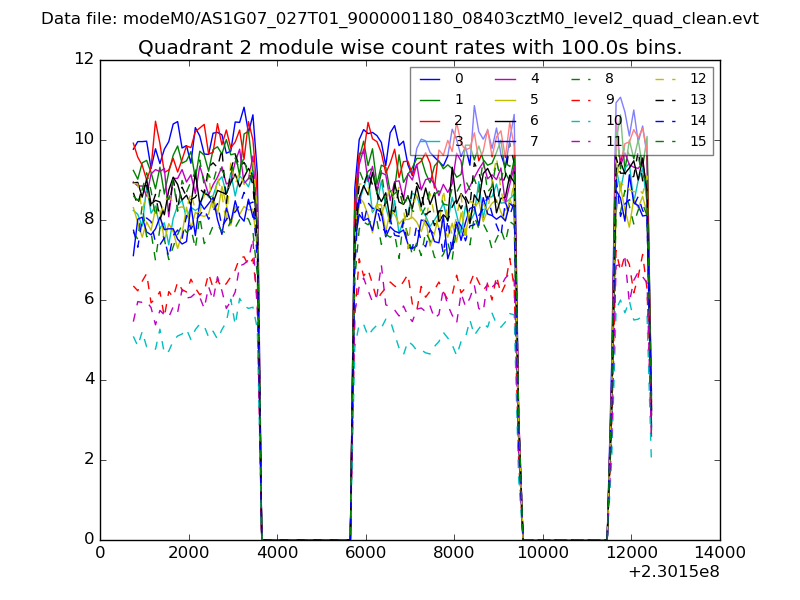
| Module-wise count rates for Quadrant B Data is divided into 100 sec bins |
 |
 |
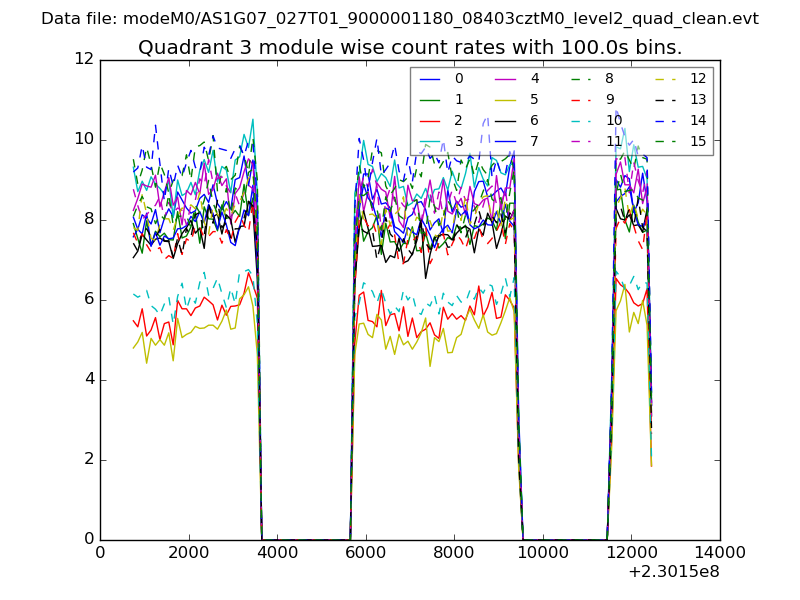
| Module-wise count rates for Quadrant C Data is divided into 100 sec bins |
 |
 |
| Module-wise count rates for Quadrant D Data is divided into 100 sec bins |
 |
 |
| Parameter | Plot |
|---|---|
| CZT HV Monitor | 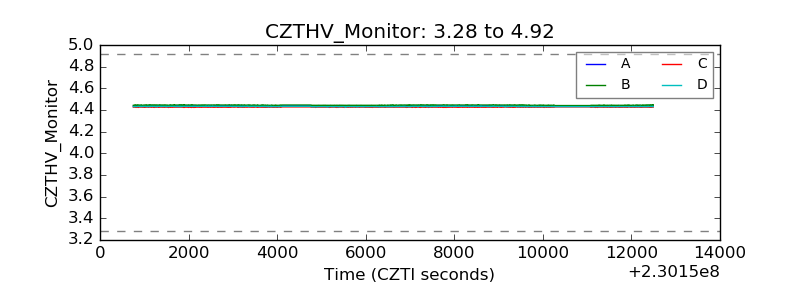 |
| D_VDD | 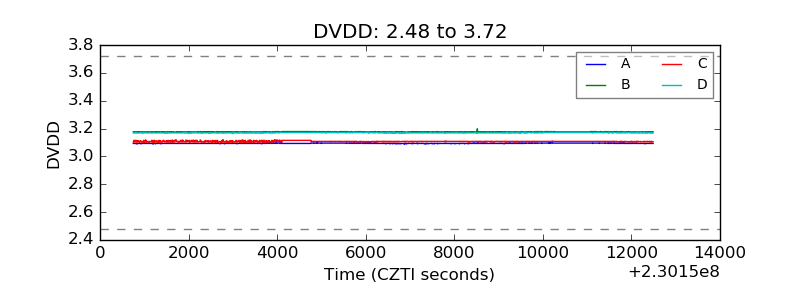 |
| Temperature 1 | 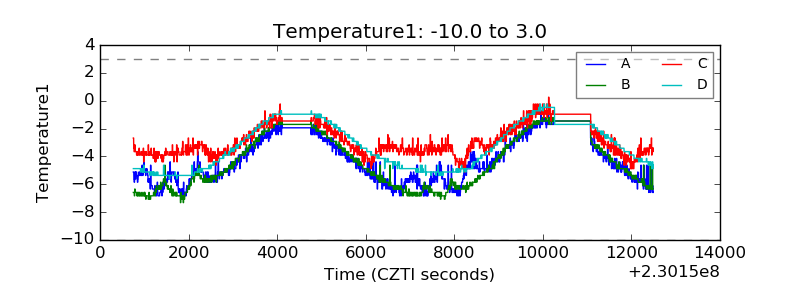 |
| Veto HV Monitor | 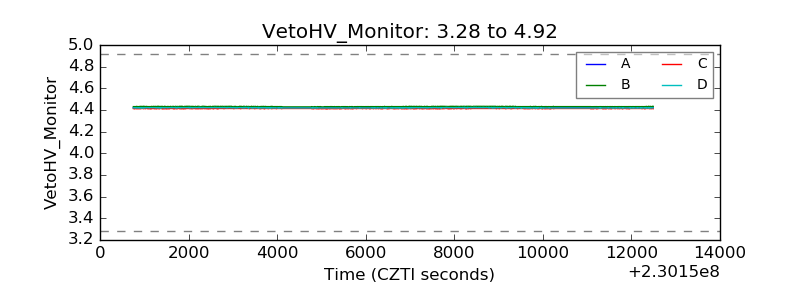 |
| Veto LLD | 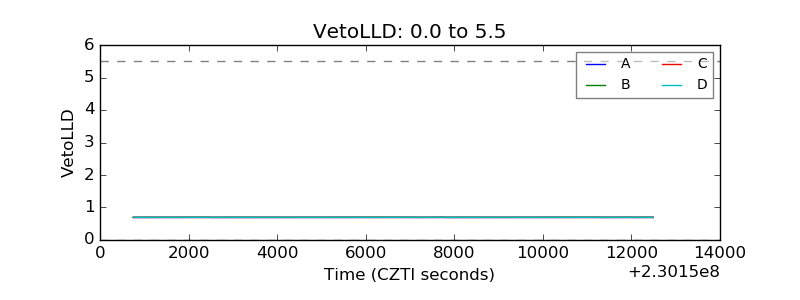 |
| Alpha Counter | 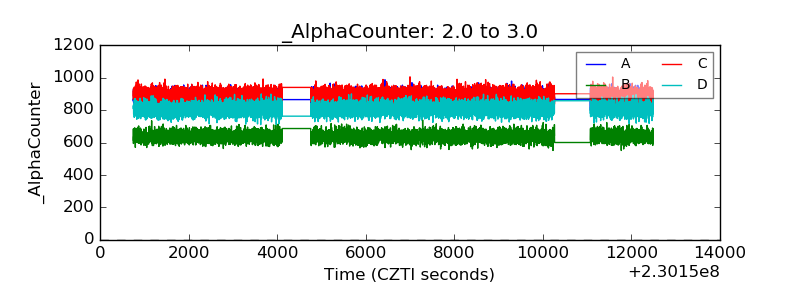 |
| _CPM_Rate | 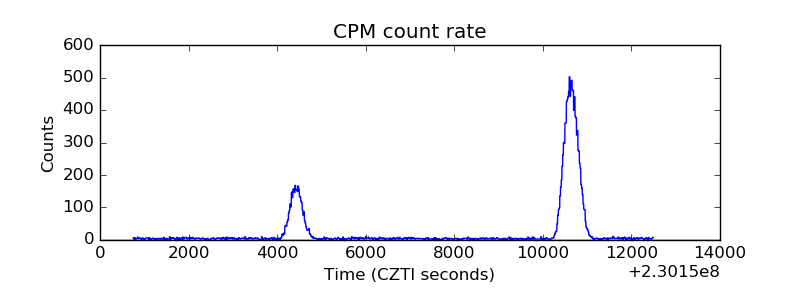 |
| CZT Counter | 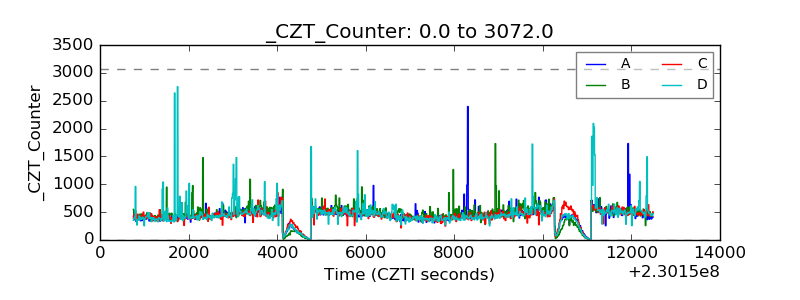 |
| +2.5 Volts monitor |  |
| +5 Volts monitor |  |
| _ROLL_ROT | 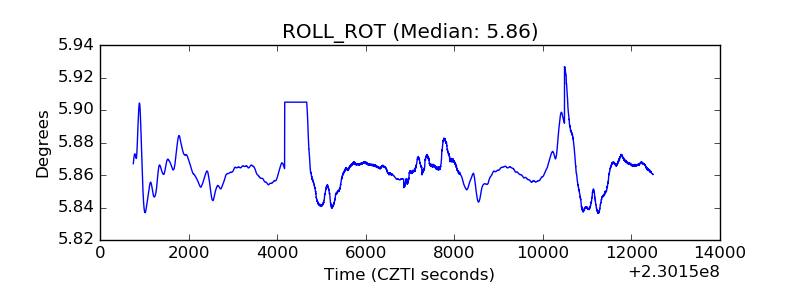 |
| _Roll_DEC | 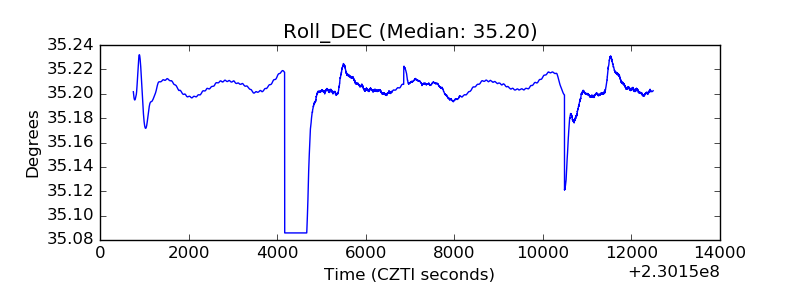 |
| _Roll_RA | 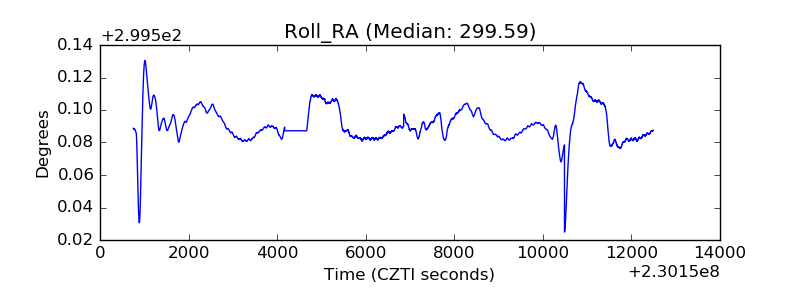 |
| Veto Counter | 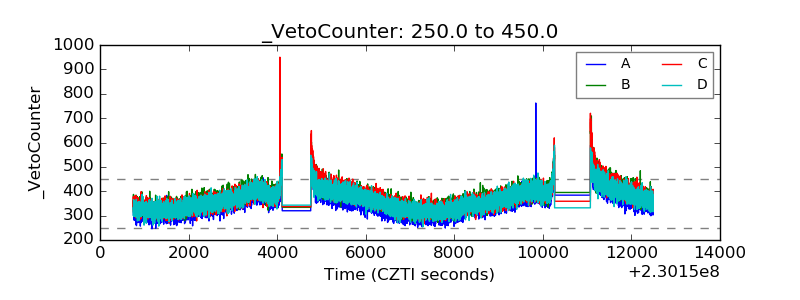 |