| Param | Original file | Final file |
|---|---|---|
| Filename | modeM0/AS1G07_027T01_9000001180_08404cztM0_level2.evt | modeM0/AS1G07_027T01_9000001180_08404cztM0_level2_quad_clean.evt |
| Size (bytes) | 398,632,320 | 87,707,520 |
| Size | 380.2 MB | 83.6 MB |
| Events in quadrant A | 2,788,245 | 565,953 |
| Events in quadrant B | 3,147,664 | 568,476 |
| Events in quadrant C | 2,699,814 | 571,297 |
| Events in quadrant D | 3,037,787 | 540,362 |
| Mode SS | |||
|---|---|---|---|
| Quadrant | BADHDUFLAG | Total packets | Discarded packets |
| A | 0 | 120 | 0 |
| B | 0 | 120 | 0 |
| C | 0 | 120 | 0 |
| D | 0 | 120 | 0 |
| Mode M9 | |||
|---|---|---|---|
| Quadrant | BADHDUFLAG | Total packets | Discarded packets |
| A | 0 | 10 | 0 |
| B | 0 | 10 | 0 |
| C | 0 | 10 | 0 |
| D | 0 | 10 | 0 |
| Mode M0 | |||
|---|---|---|---|
| Quadrant | BADHDUFLAG | Total packets | Discarded packets |
| A | 0 | 12190 | 1 |
| B | 0 | 13139 | 1 |
| C | 0 | 11995 | 1 |
| D | 0 | 13019 | 1 |
| Quadrant | Total seconds | Saturated seconds | Saturation percentage |
|---|---|---|---|
| A | 5866 | 11 | 0.187521% |
| B | 5866 | 37 | 0.630753% |
| C | 5866 | 7 | 0.119332% |
| D | 5866 | 39 | 0.664848% |
Noise dominated data is calculated using 1-second bins in cleaned event files. If a bin has >2000 counts, and if more than 50% of those come from <1% of pixels, then it is considered to be noise-dominated and hence unusable.
| Quadrant | # 1 sec bins | Bins with >0 counts | Bins with >2000 counts | High rate bins dominated by noise | Noise dominated (total time) | Noise dominated (detector-on time) | Marked lightcurve |
|---|---|---|---|---|---|---|---|
| A | 6856 | 5867 | 1 | 1 | 0.01% | 0.02% | 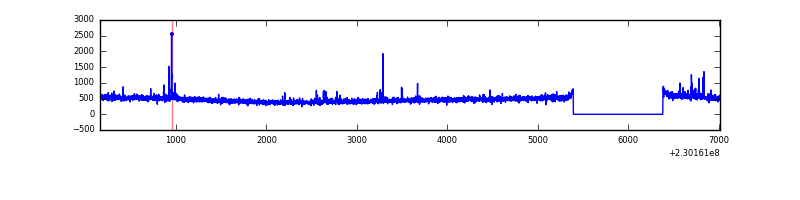 |
| B | 6856 | 5867 | 9 | 9 | 0.13% | 0.15% | 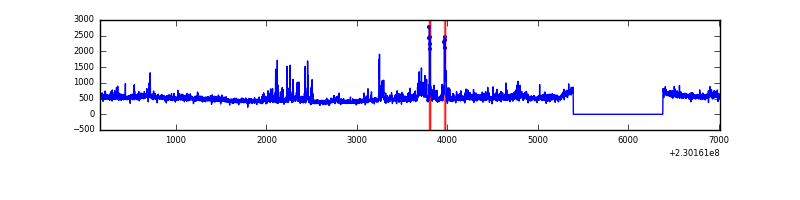 |
| C | 6856 | 5867 | 0 | 0 | 0.00% | 0.00% | 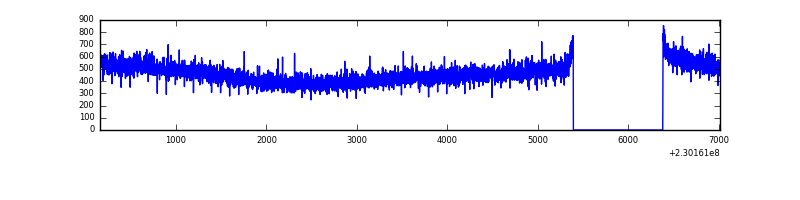 |
| D | 6856 | 5867 | 25 | 25 | 0.36% | 0.43% | 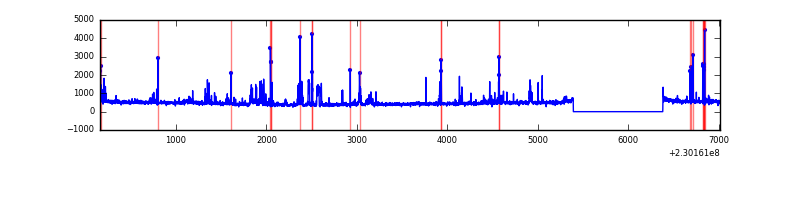 |
Top three noisy pixels from each quadrant. If the there are fewer than three noisy pixels in the level2.evt file, extra rows are filled as -1
| Pixel properties | Quadrant properties | ||||||
|---|---|---|---|---|---|---|---|
| Quadrant | DetID | PixID | Counts | Sigma | Mean | Median | Sigma |
| A | 5 | 16 | 41766 | 283.0 | 706 | 692 | 145.1 |
| A | 13 | 248 | 18717 | 124.19 | 706 | 692 | 145.1 |
| A | 15 | 174 | 11032 | 71.24 | 706 | 692 | 145.1 |
| B | 4 | 48 | 226825 | 1676.38 | 709 | 693 | 134.9 |
| B | 0 | 214 | 97493 | 717.6 | 709 | 693 | 134.9 |
| B | 0 | 219 | 28909 | 209.17 | 709 | 693 | 134.9 |
| C | 13 | 61 | 5116 | 27.5 | 691 | 695 | 160.8 |
| C | 8 | 222 | 2947 | 14.01 | 691 | 695 | 160.8 |
| C | 12 | 4 | 2688 | 12.4 | 691 | 695 | 160.8 |
| D | 6 | 225 | 102834 | 607.04 | 683 | 661 | 168.3 |
| D | 7 | 71 | 99332 | 586.24 | 683 | 661 | 168.3 |
| D | 4 | 95 | 78048 | 459.78 | 683 | 661 | 168.3 |
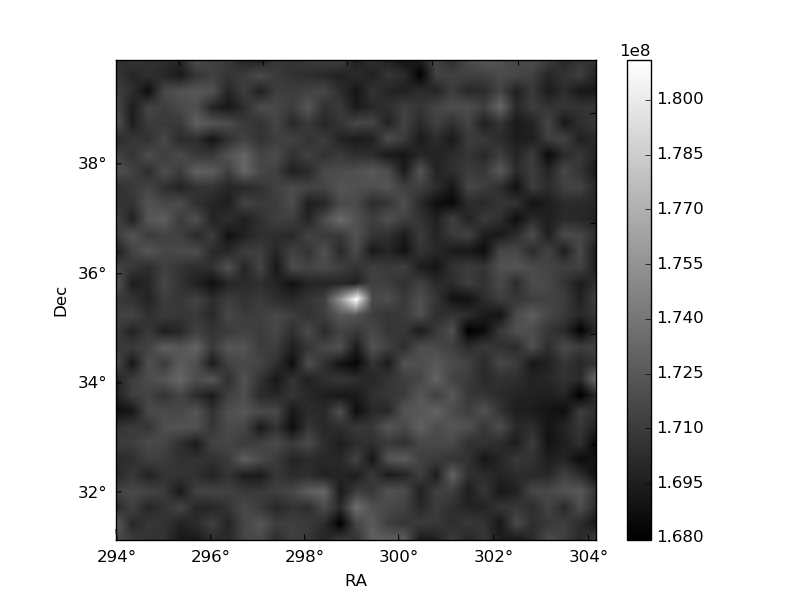
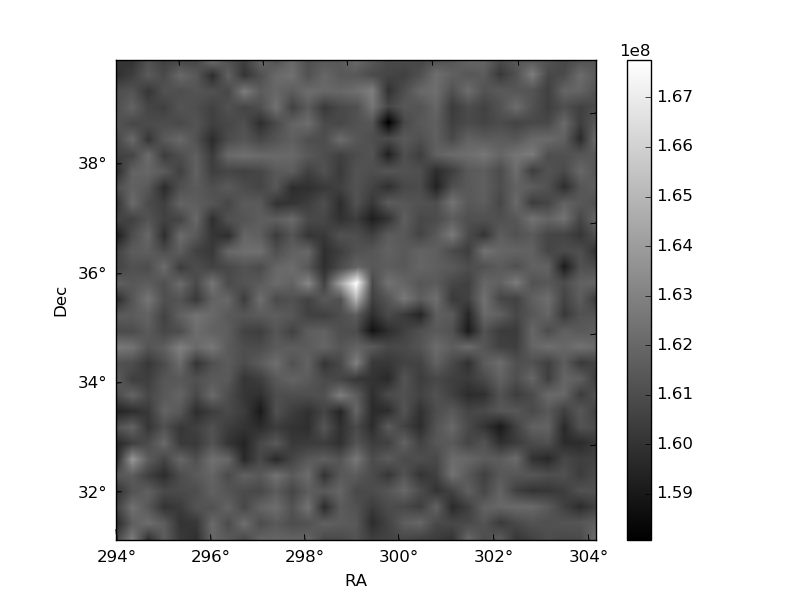
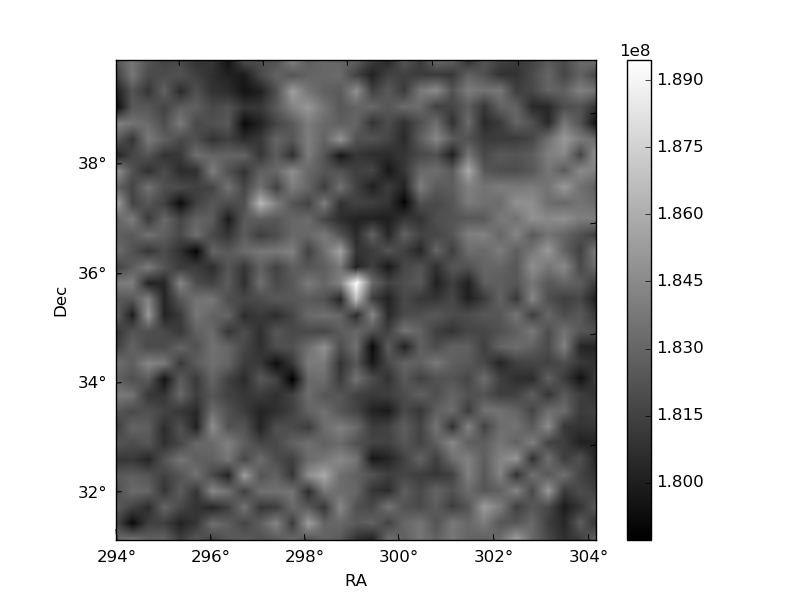
Histogram calculated using DETX and DETY for each event in the final _common_clean file
| Quadrant A | 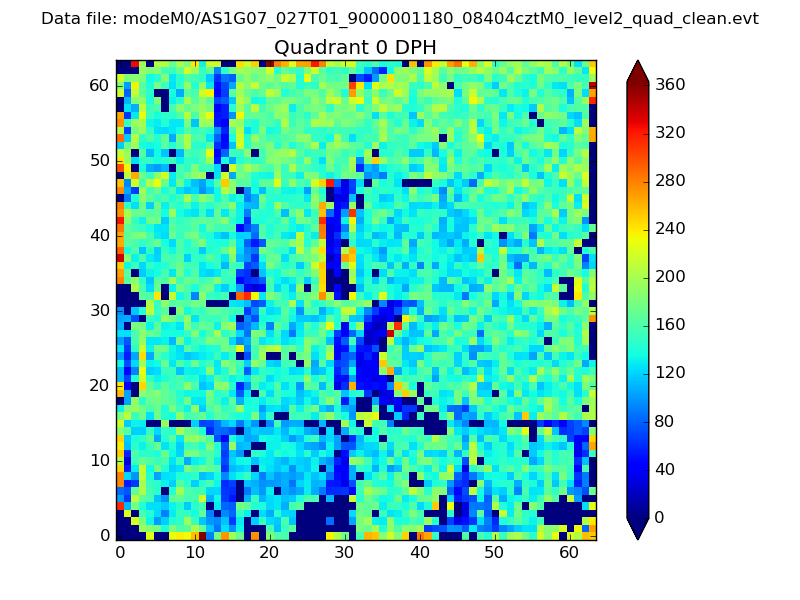 |
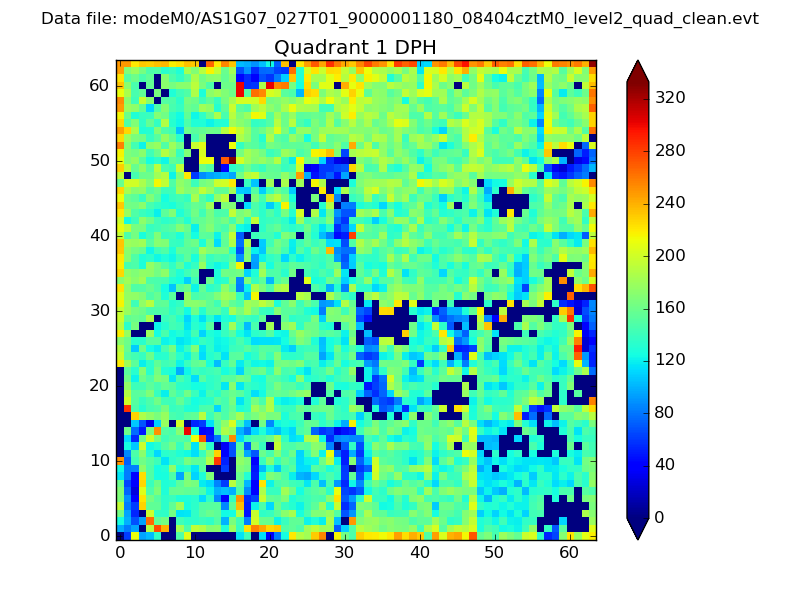 |
Quadrant B |
|---|---|---|---|
| Quadrant D | 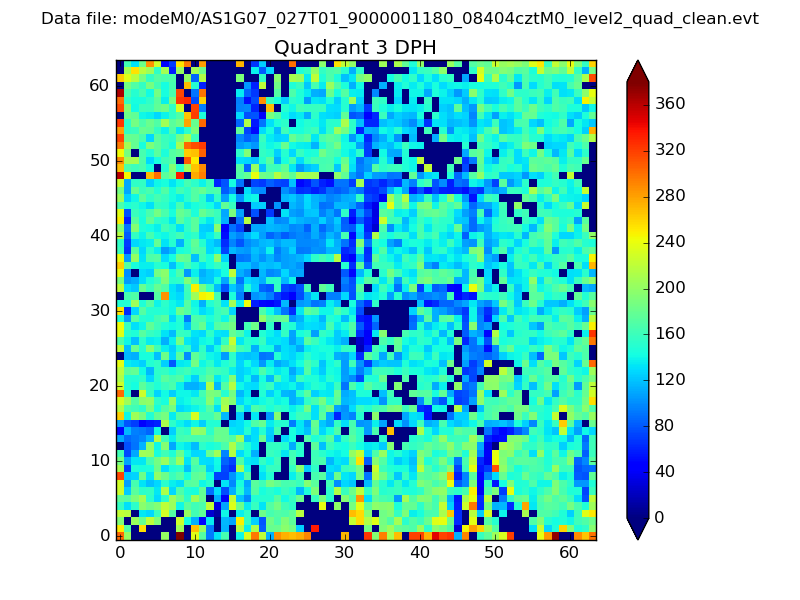 |
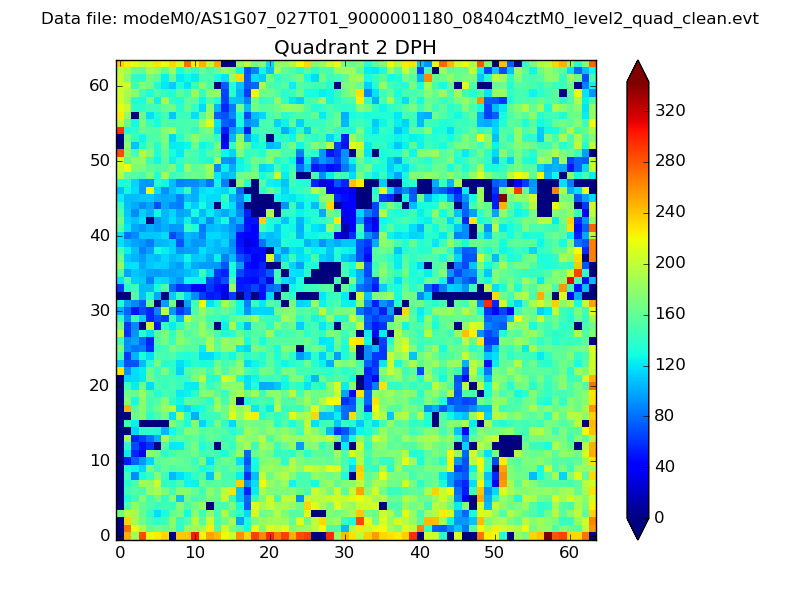 |
Quadrant C |
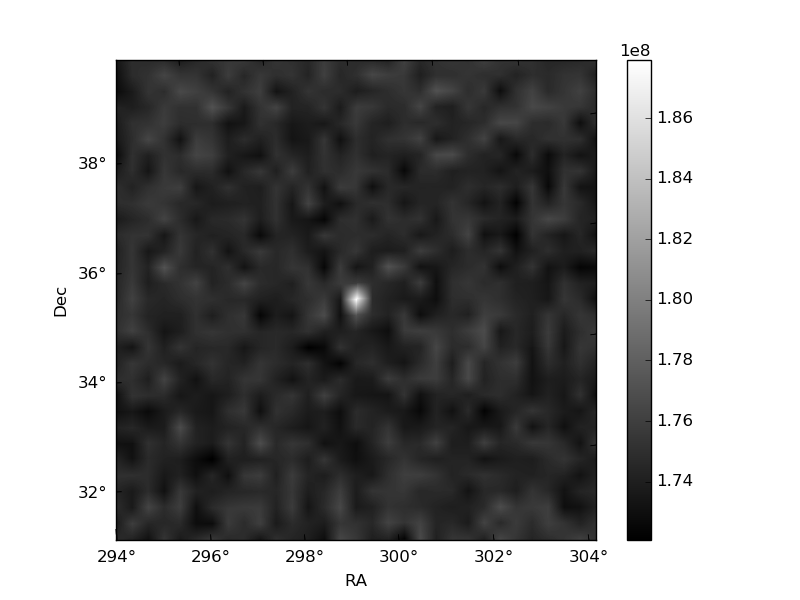
| Plot type | Count rate plots | Images |
|---|---|---|
| Comparison with Poisson distribution Blue bars denote a histogram of data divided into 1 sec bins. Red curve is a Poisson curve with rate = median count rate of data. |
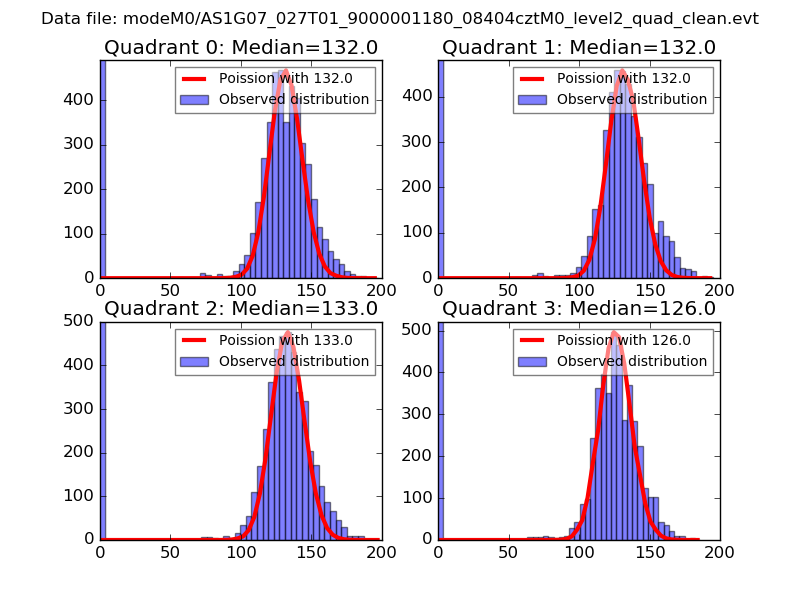 |
 |
| Quadrant-wise count rates Data is divided into 100 sec bins |
 |
|
| Module-wise count rates for Quadrant A Data is divided into 100 sec bins |
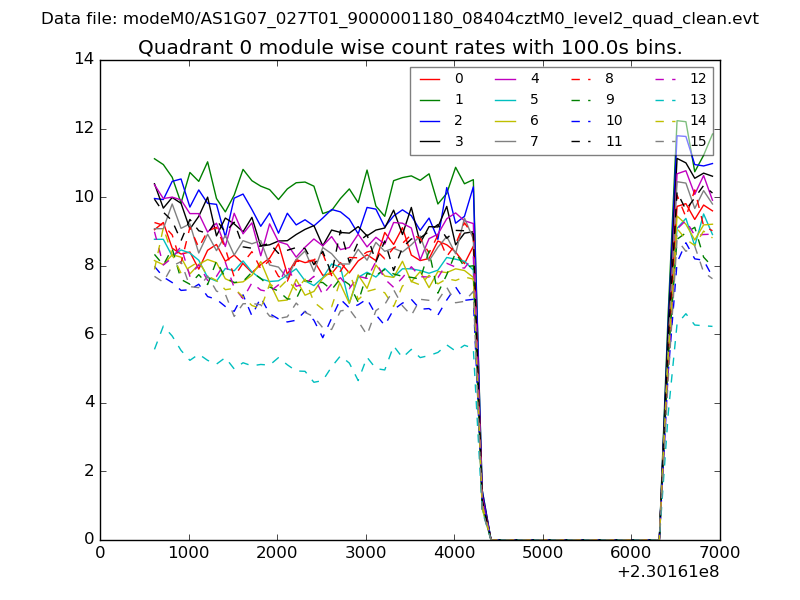 |
 |
| Module-wise count rates for Quadrant B Data is divided into 100 sec bins |
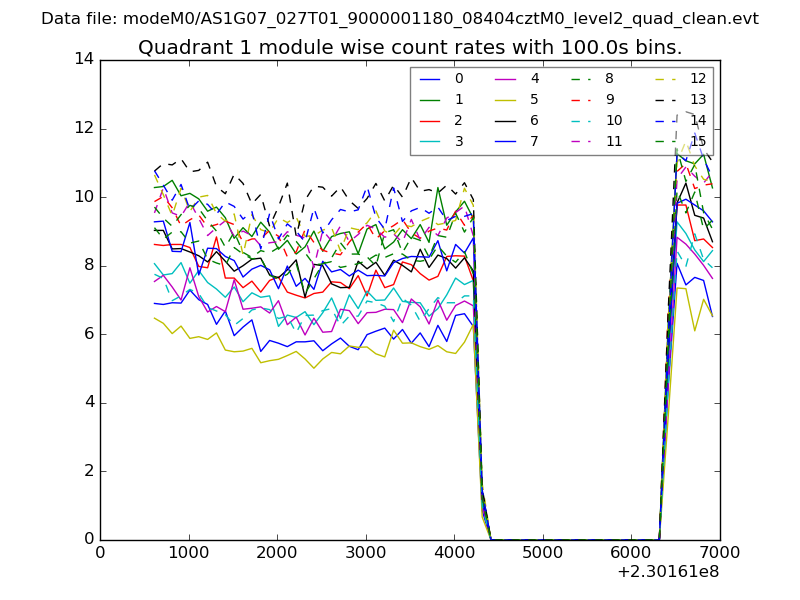 |
 |
| Module-wise count rates for Quadrant C Data is divided into 100 sec bins |
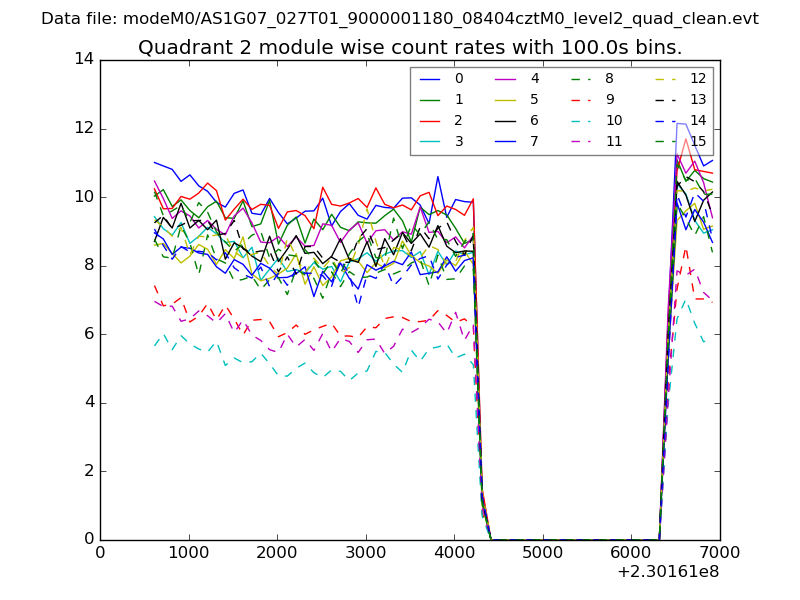 |
 |
| Module-wise count rates for Quadrant D Data is divided into 100 sec bins |
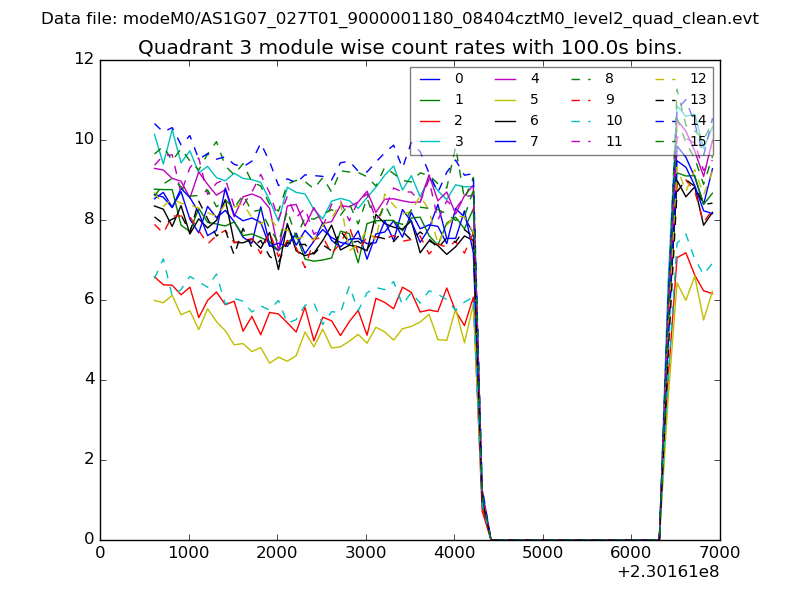 |
 |
| Parameter | Plot |
|---|---|
| CZT HV Monitor | 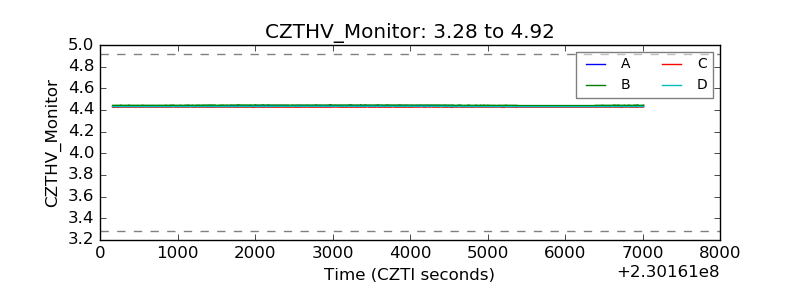 |
| D_VDD | 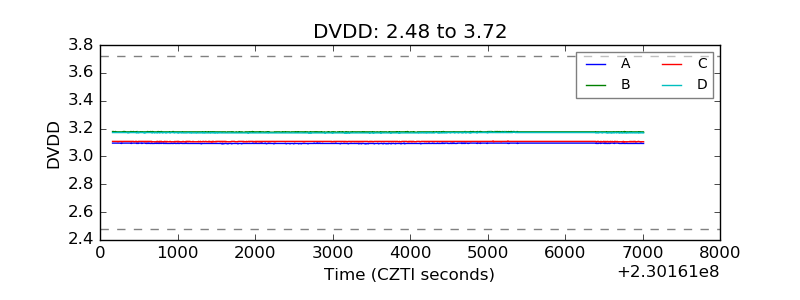 |
| Temperature 1 | 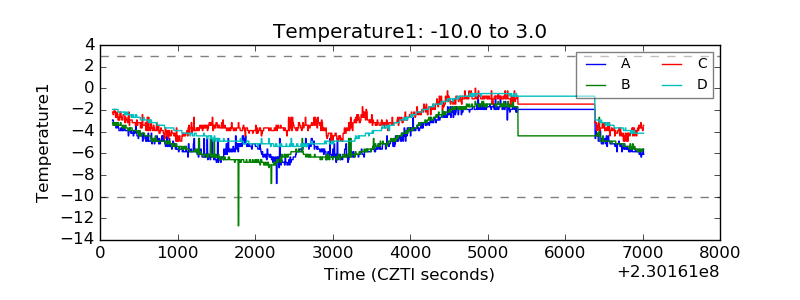 |
| Veto HV Monitor | 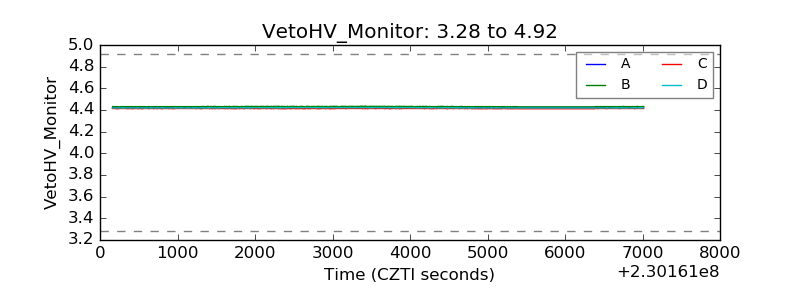 |
| Veto LLD | 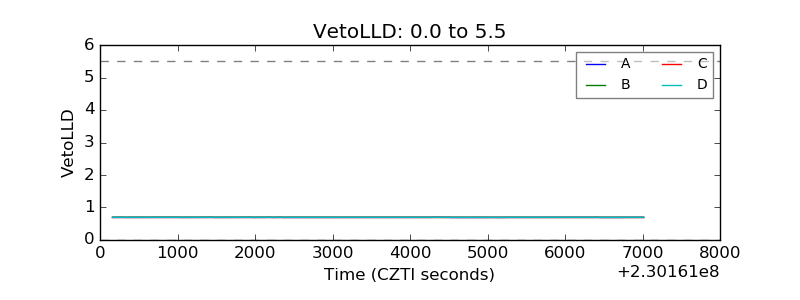 |
| Alpha Counter | 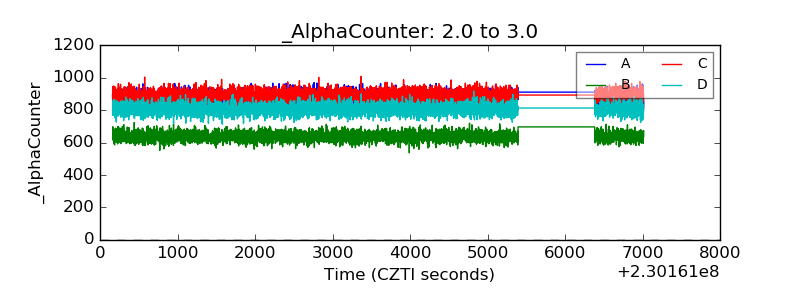 |
| _CPM_Rate | 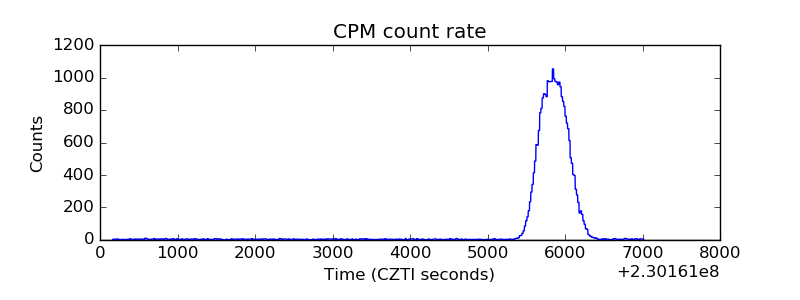 |
| CZT Counter |  |
| +2.5 Volts monitor |  |
| +5 Volts monitor |  |
| _ROLL_ROT | 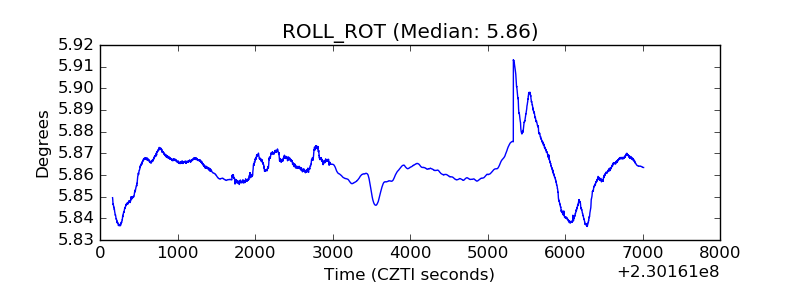 |
| _Roll_DEC | 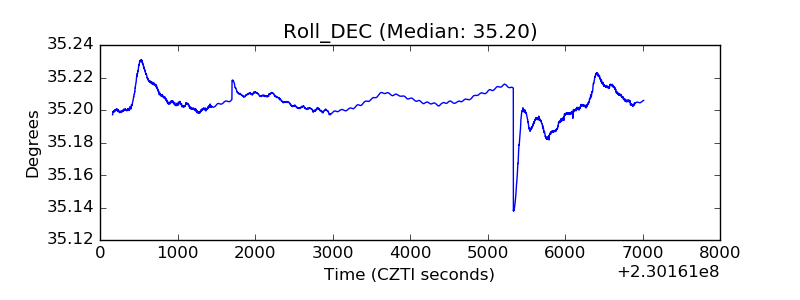 |
| _Roll_RA |  |
| Veto Counter | 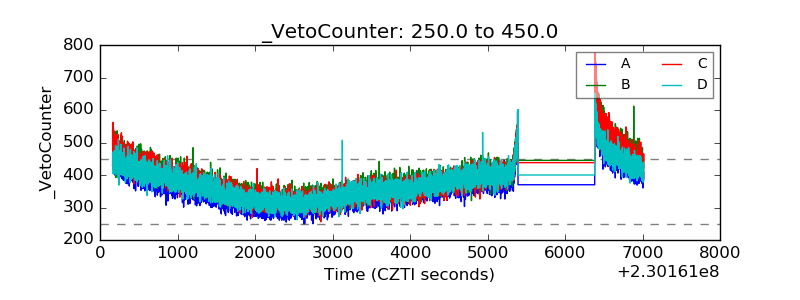 |