| Param | Original file | Final file |
|---|---|---|
| Filename | modeM0/AS1G07_027T01_9000001180_08406cztM0_level2.evt | modeM0/AS1G07_027T01_9000001180_08406cztM0_level2_quad_clean.evt |
| Size (bytes) | 51,024,960 | 12,752,640 |
| Size | 48.7 MB | 12.2 MB |
| Events in quadrant A | 370,779 | 83,855 |
| Events in quadrant B | 380,309 | 85,414 |
| Events in quadrant C | 357,814 | 85,551 |
| Events in quadrant D | 390,089 | 78,973 |
| Mode SS | |||
|---|---|---|---|
| Quadrant | BADHDUFLAG | Total packets | Discarded packets |
| A | 0 | 14 | 0 |
| B | 0 | 14 | 0 |
| C | 0 | 14 | 0 |
| D | 0 | 14 | 0 |
| Mode M0 | |||
|---|---|---|---|
| Quadrant | BADHDUFLAG | Total packets | Discarded packets |
| A | 0 | 1502 | 6 |
| B | 0 | 1581 | 14 |
| C | 0 | 1442 | 3 |
| D | 0 | 1541 | 7 |
| Quadrant | Total seconds | Saturated seconds | Saturation percentage |
|---|---|---|---|
| A | 628 | 1 | 0.159236% |
| B | 626 | 5 | 0.798722% |
| C | 630 | 1 | 0.158730% |
| D | 629 | 12 | 1.907790% |
Noise dominated data is calculated using 1-second bins in cleaned event files. If a bin has >2000 counts, and if more than 50% of those come from <1% of pixels, then it is considered to be noise-dominated and hence unusable.
| Quadrant | # 1 sec bins | Bins with >0 counts | Bins with >2000 counts | High rate bins dominated by noise | Noise dominated (total time) | Noise dominated (detector-on time) | Marked lightcurve |
|---|---|---|---|---|---|---|---|
| A | 631 | 630 | 0 | 0 | 0.00% | 0.00% | 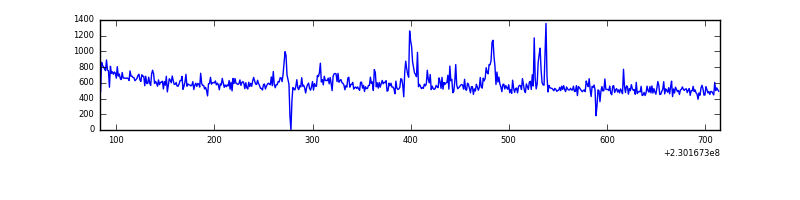 |
| B | 631 | 631 | 0 | 0 | 0.00% | 0.00% | 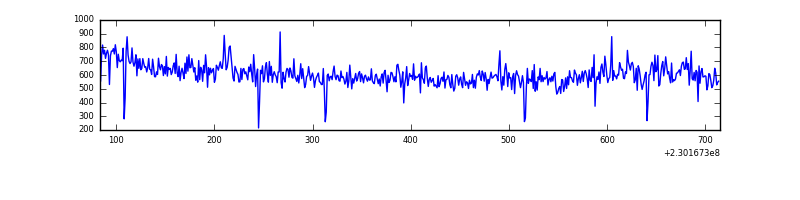 |
| C | 631 | 631 | 0 | 0 | 0.00% | 0.00% | 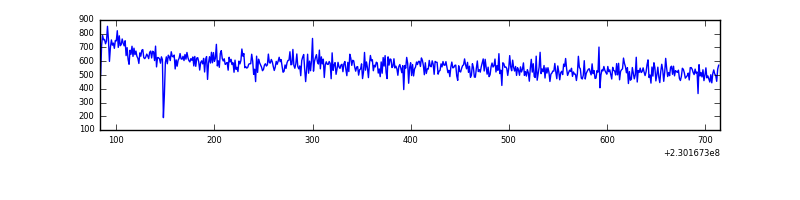 |
| D | 632 | 632 | 9 | 9 | 1.42% | 1.42% |  |
Top three noisy pixels from each quadrant. If the there are fewer than three noisy pixels in the level2.evt file, extra rows are filled as -1
| Pixel properties | Quadrant properties | ||||||
|---|---|---|---|---|---|---|---|
| Quadrant | DetID | PixID | Counts | Sigma | Mean | Median | Sigma |
| A | 5 | 16 | 22324 | 1076.78 | 90 | 88 | 20.7 |
| A | 0 | 226 | 862 | 37.48 | 90 | 88 | 20.7 |
| A | 12 | 194 | 765 | 32.78 | 90 | 88 | 20.7 |
| B | 0 | 214 | 13160 | 673.42 | 92 | 90 | 19.4 |
| B | 0 | 198 | 2745 | 136.8 | 92 | 90 | 19.4 |
| B | 0 | 219 | 2008 | 98.82 | 92 | 90 | 19.4 |
| C | 12 | 4 | 729 | 27.63 | 91 | 92 | 23.1 |
| C | 13 | 61 | 611 | 22.52 | 91 | 92 | 23.1 |
| C | 7 | 159 | 406 | 13.62 | 91 | 92 | 23.1 |
| D | 7 | 71 | 35423 | 1489.16 | 88 | 85 | 23.7 |
| D | 12 | 221 | 8363 | 348.84 | 88 | 85 | 23.7 |
| D | 1 | 52 | 5170 | 214.28 | 88 | 85 | 23.7 |
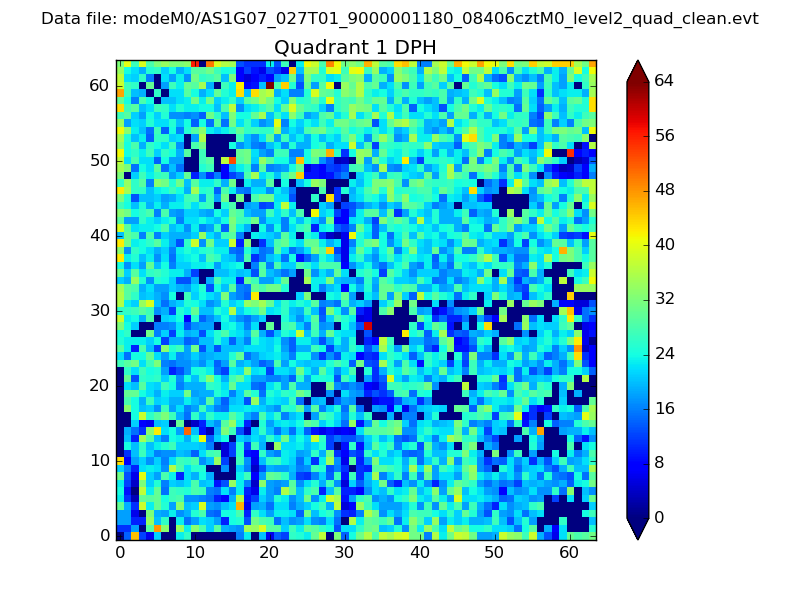
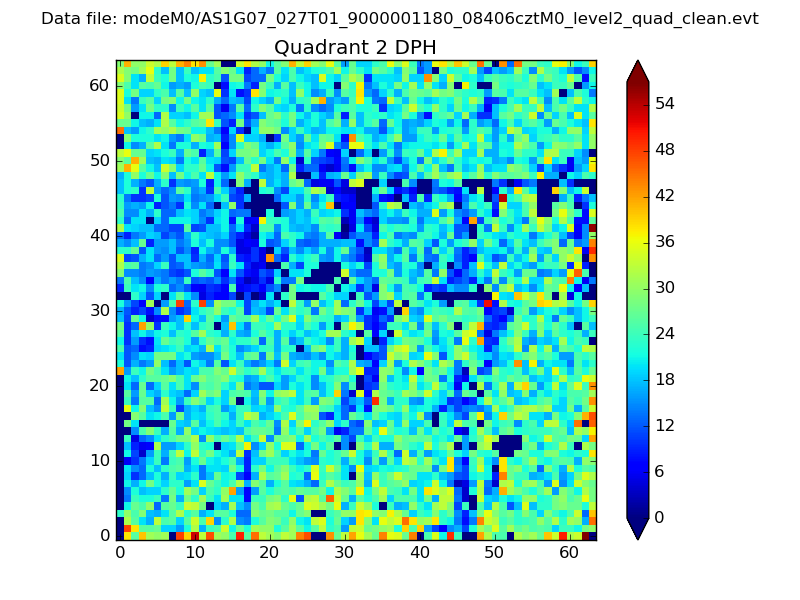
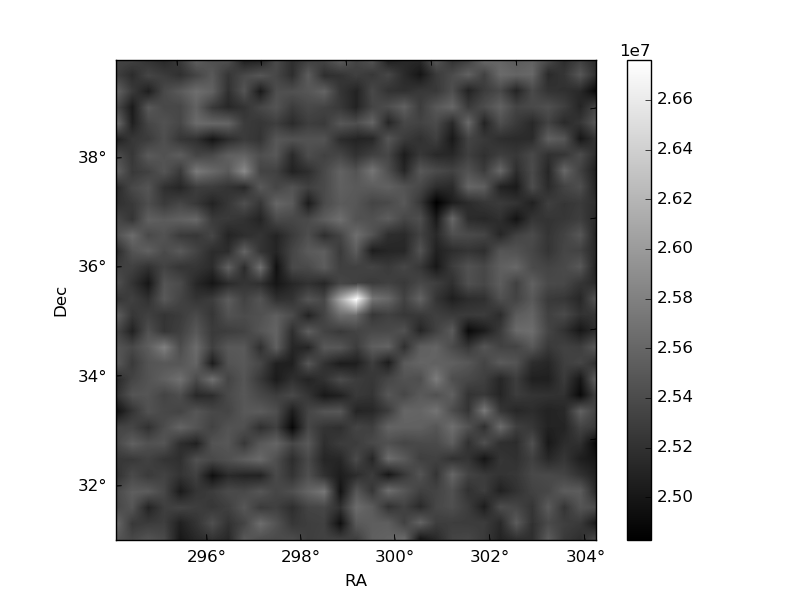
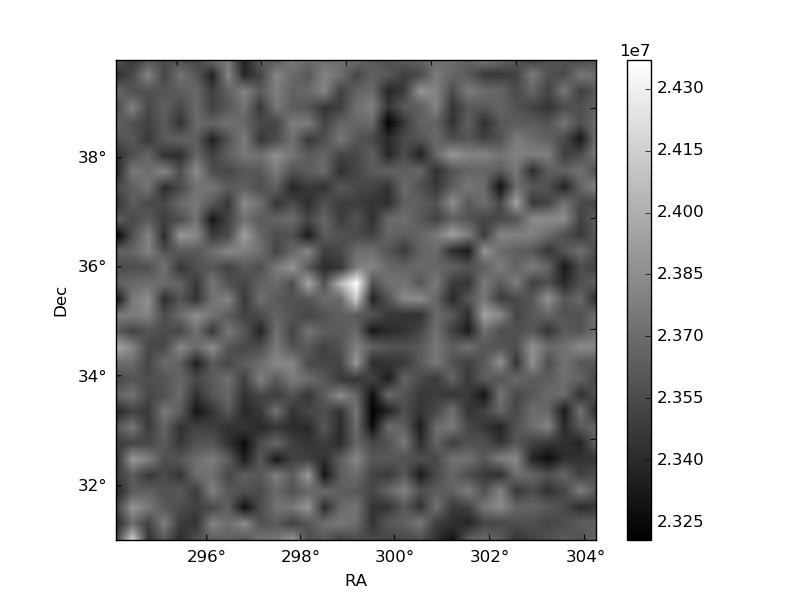
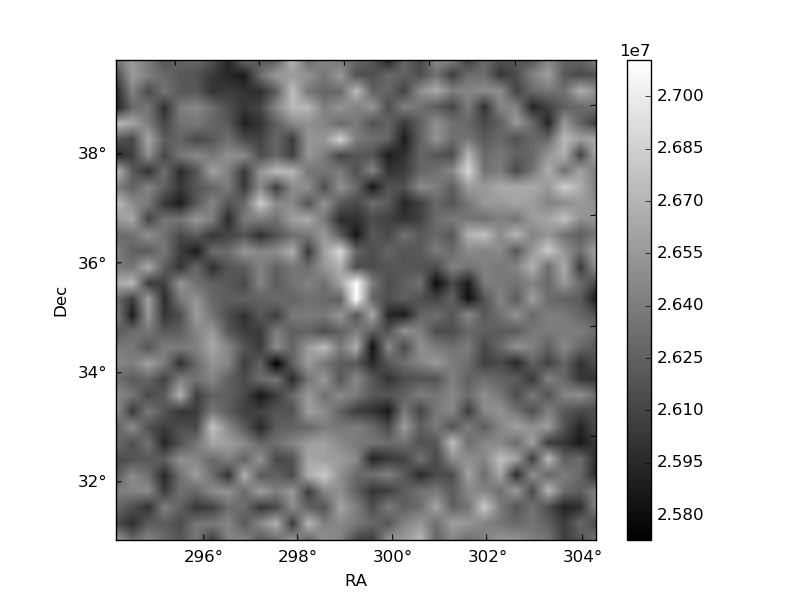
Histogram calculated using DETX and DETY for each event in the final _common_clean file
| Quadrant A | 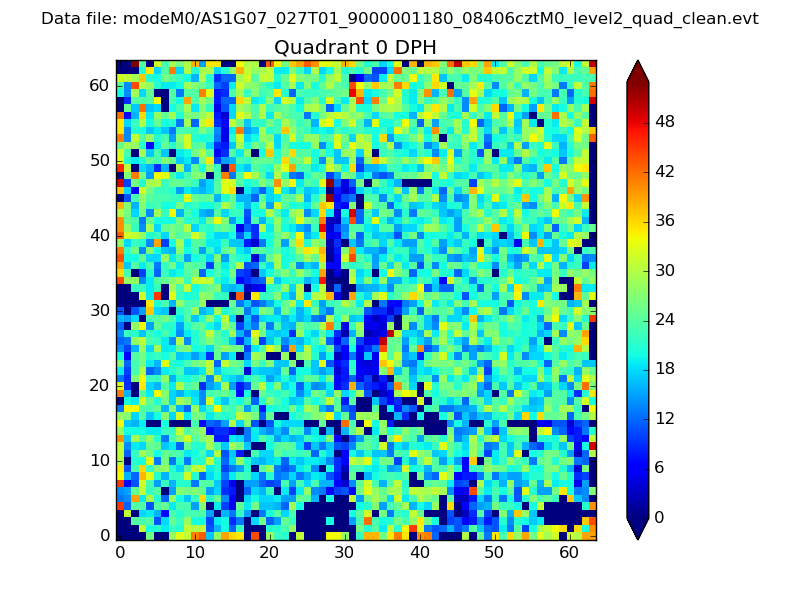 |
 |
Quadrant B |
|---|---|---|---|
| Quadrant D |  |
 |
Quadrant C |
| Plot type | Count rate plots | Images |
|---|---|---|
| Comparison with Poisson distribution Blue bars denote a histogram of data divided into 1 sec bins. Red curve is a Poisson curve with rate = median count rate of data. |
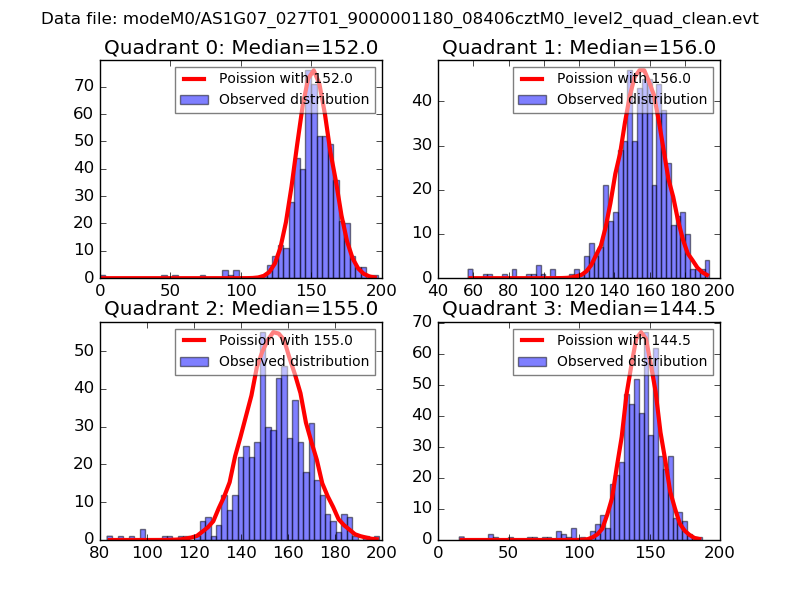 |
 |
| Quadrant-wise count rates Data is divided into 100 sec bins |
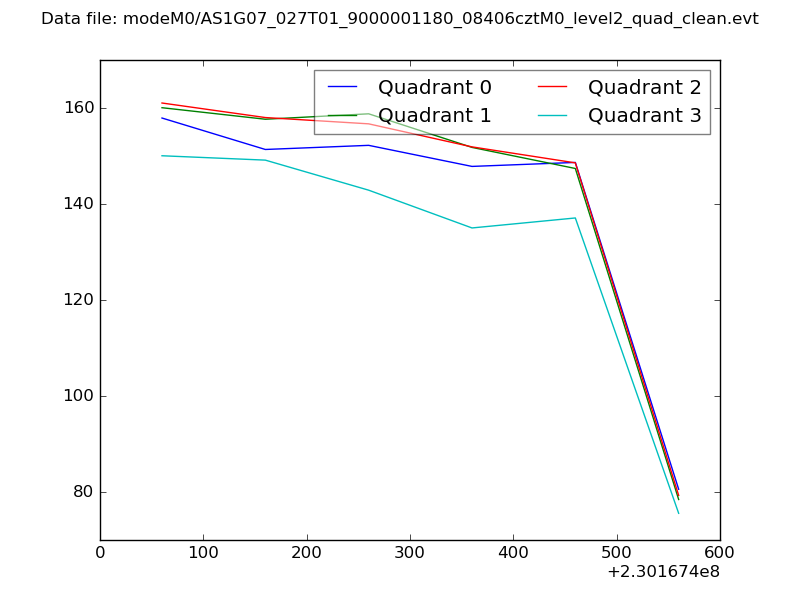 |
|
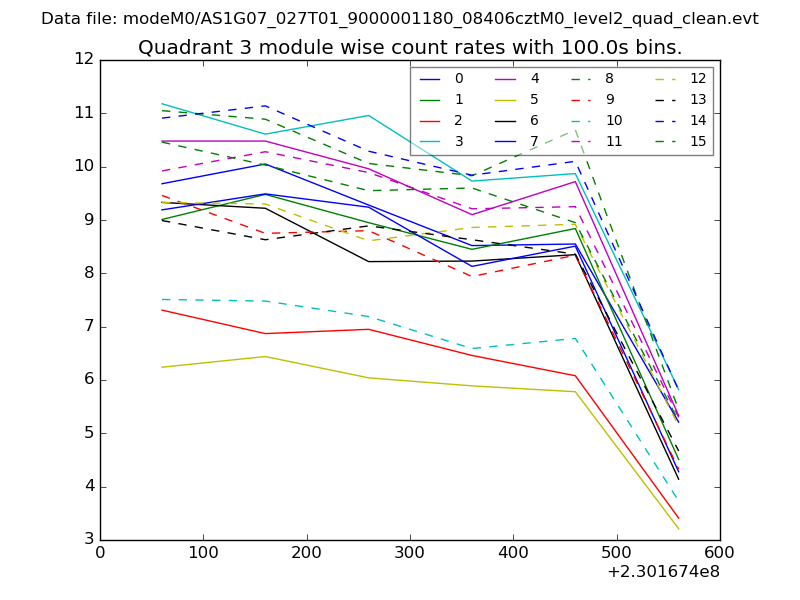
| Module-wise count rates for Quadrant A Data is divided into 100 sec bins |
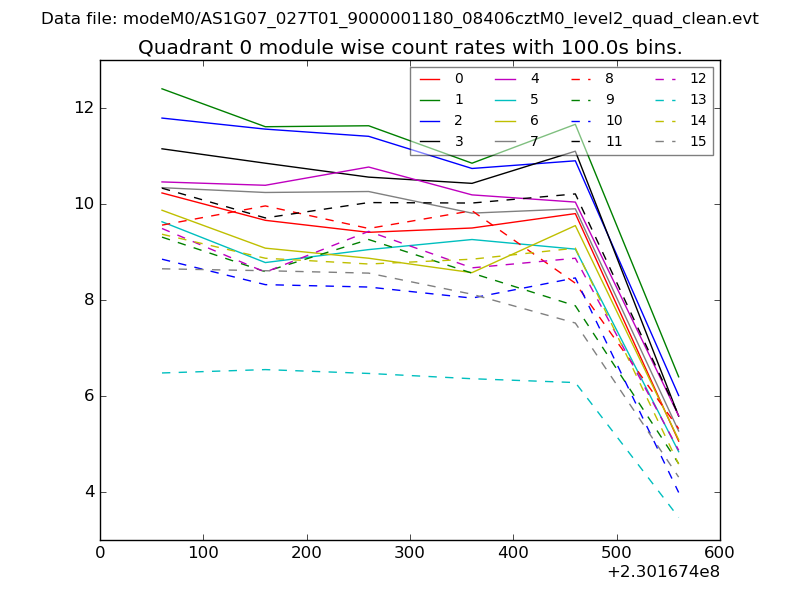 |
 |
| Module-wise count rates for Quadrant B Data is divided into 100 sec bins |
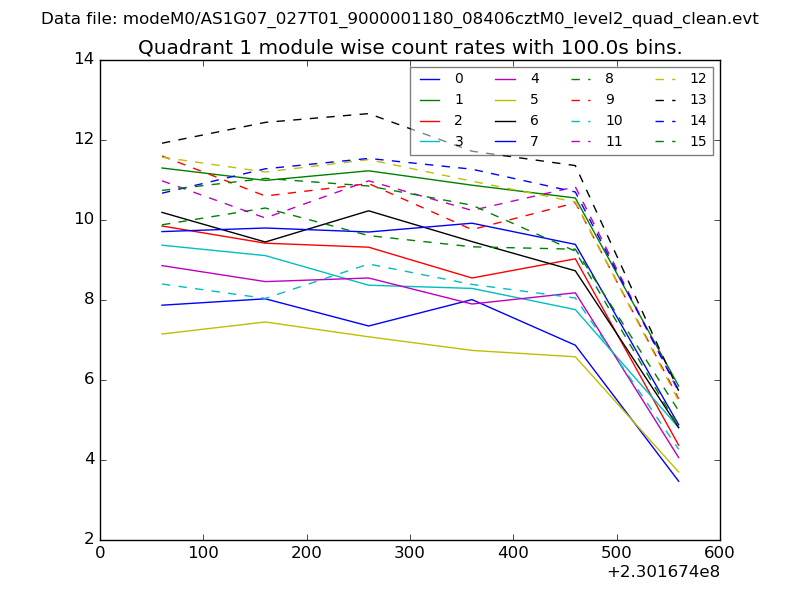 |
 |
| Module-wise count rates for Quadrant C Data is divided into 100 sec bins |
 |
 |
| Module-wise count rates for Quadrant D Data is divided into 100 sec bins |
 |
 |
| Parameter | Plot |
|---|---|
| CZT HV Monitor | 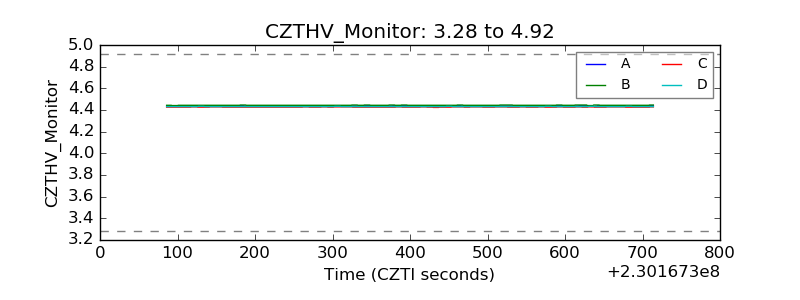 |
| D_VDD | 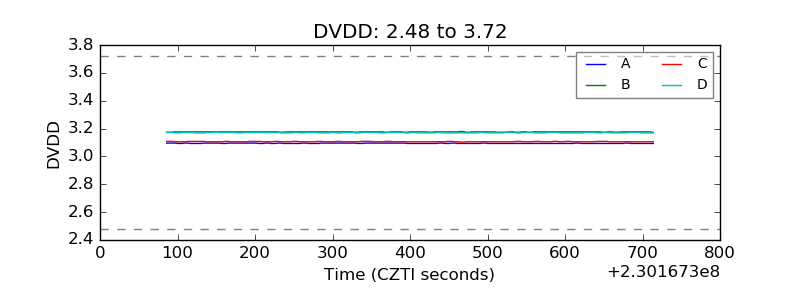 |
| Temperature 1 | 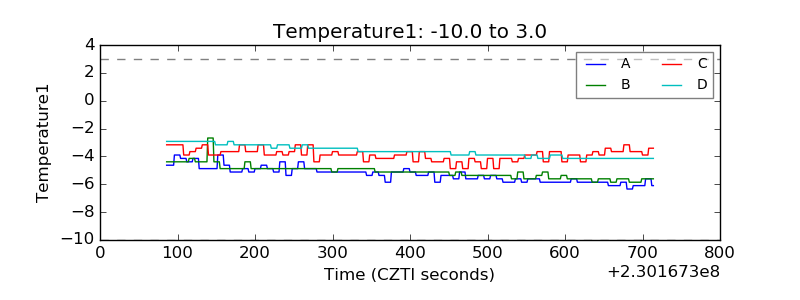 |
| Veto HV Monitor | 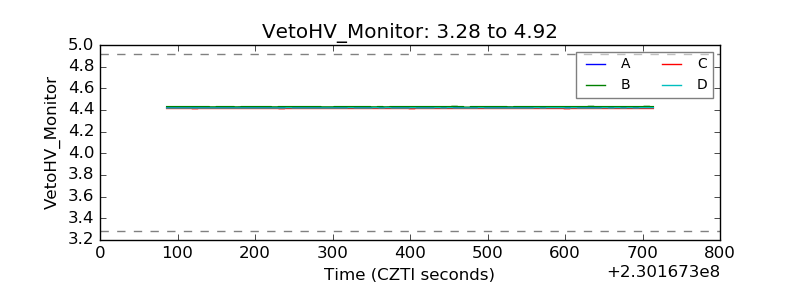 |
| Veto LLD | 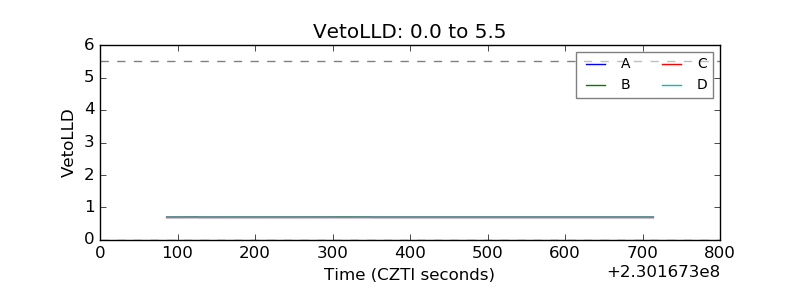 |
| Alpha Counter | 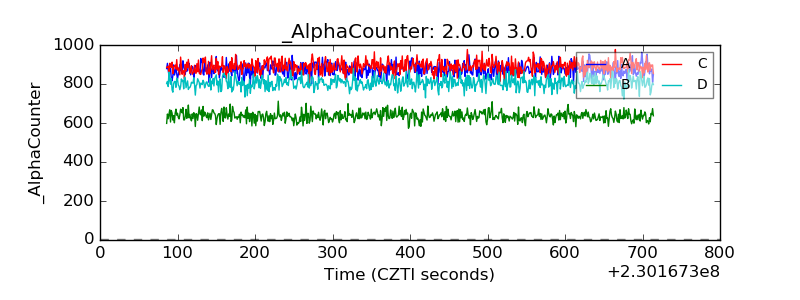 |
| _CPM_Rate | 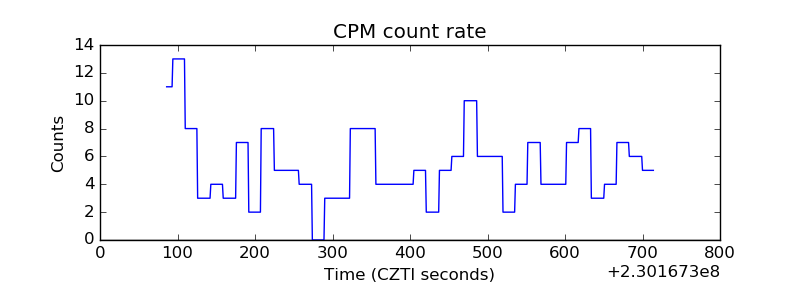 |
| CZT Counter | 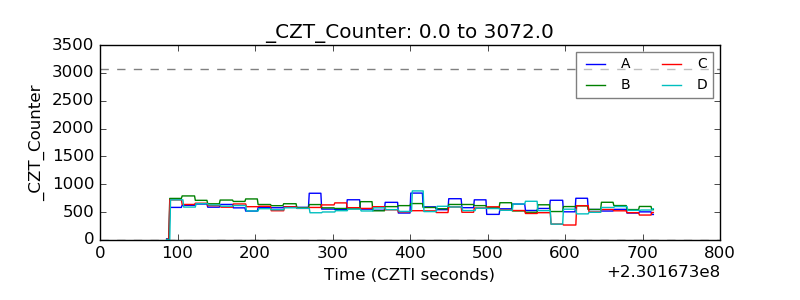 |
| +2.5 Volts monitor |  |
| +5 Volts monitor | 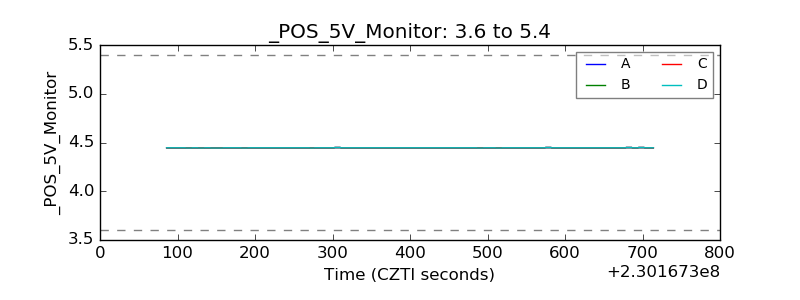 |
| _ROLL_ROT | 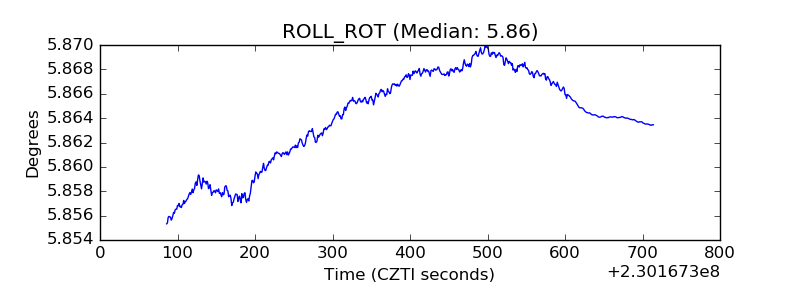 |
| _Roll_DEC | 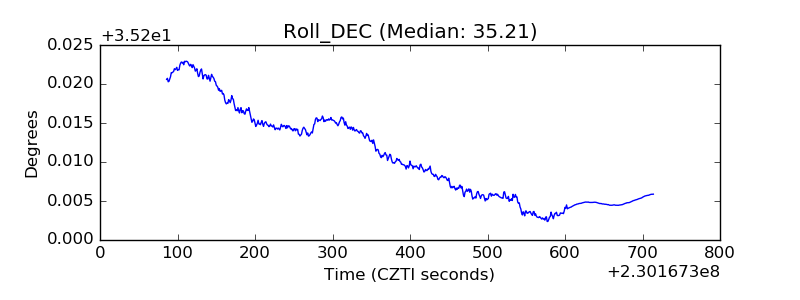 |
| _Roll_RA | 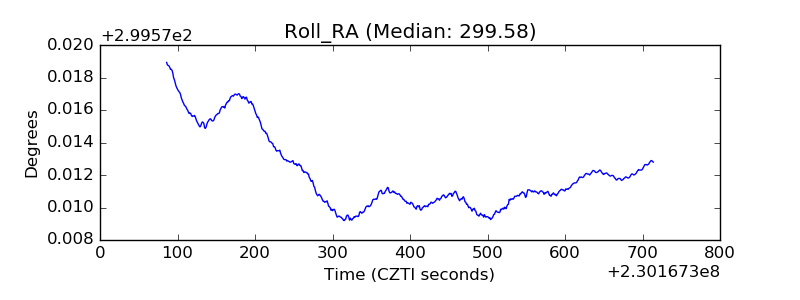 |
| Veto Counter | 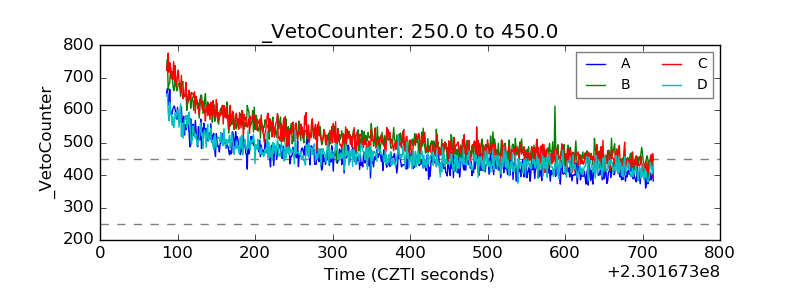 |