| Param | Original file | Final file |
|---|---|---|
| Filename | modeM0/AS1A02_158T01_9000001184cztM0_level2.fits | modeM0/AS1A02_158T01_9000001184cztM0_level2_quad_clean.evt |
| Size (bytes) | 301,230,720 | 292,639,680 |
| Size | 287.3 MB | 279.1 MB |
| Events in quadrant A | 1,801,458 | 1,715,901 |
| Events in quadrant B | 1,735,478 | 1,729,219 |
| Events in quadrant C | 1,784,472 | 1,650,584 |
| Events in quadrant D | 1,534,718 | 1,500,100 |
| Mode SS | |||
|---|---|---|---|
| Quadrant | BADHDUFLAG | Total packets | Discarded packets |
| A | 0 | 672 | 0 |
| B | 0 | 672 | 0 |
| C | 0 | 672 | 0 |
| D | 0 | 672 | 0 |
| Mode M9 | |||
|---|---|---|---|
| Quadrant | BADHDUFLAG | Total packets | Discarded packets |
| A | 0 | 27 | 0 |
| B | 0 | 27 | 0 |
| C | 0 | 27 | 0 |
| D | 0 | 27 | 0 |
| Mode M0 | |||
|---|---|---|---|
| Quadrant | BADHDUFLAG | Total packets | Discarded packets |
| A | 0 | 68380 | 0 |
| B | 0 | 70164 | 0 |
| C | 0 | 67857 | 0 |
| D | 0 | 76823 | 0 |
| Quadrant | Total seconds | Saturated seconds | Saturation percentage |
|---|---|---|---|
| A | 32980 | 476 | 1.443299% |
| B | 32975 | 501 | 1.519333% |
| C | 32979 | 242 | 0.733800% |
| D | 32975 | 698 | 2.116755% |
Noise dominated data is calculated using 1-second bins in cleaned event files. If a bin has >2000 counts, and if more than 50% of those come from <1% of pixels, then it is considered to be noise-dominated and hence unusable.
| Quadrant | # 1 sec bins | Bins with >0 counts | Bins with >2000 counts | High rate bins dominated by noise | Noise dominated (total time) | Noise dominated (detector-on time) | Marked lightcurve |
|---|---|---|---|---|---|---|---|
| A | 35858 | 33004 | 0 | 0 | 0.00% | 0.00% |  |
| B | 35858 | 33005 | 0 | 0 | 0.00% | 0.00% |  |
| C | 35858 | 33007 | 0 | 0 | 0.00% | 0.00% |  |
| D | 35858 | 33004 | 0 | 0 | 0.00% | 0.00% |  |
Top three noisy pixels from each quadrant. If the there are fewer than three noisy pixels in the level2.evt file, extra rows are filled as -1
| Pixel properties | Quadrant properties | ||||||
|---|---|---|---|---|---|---|---|
| Quadrant | DetID | PixID | Counts | Sigma | Mean | Median | Sigma |
| A | 14 | 188 | 1804 | 11.48 | 467 | 434 | 119.3 |
| A | 0 | 29 | 1780 | 11.28 | 467 | 434 | 119.3 |
| A | 14 | 204 | 1561 | 9.44 | 467 | 434 | 119.3 |
| B | 2 | 9 | 1547 | 11.67 | 458 | 434 | 95.4 |
| B | 14 | 254 | 1220 | 8.24 | 458 | 434 | 95.4 |
| B | 5 | 232 | 1216 | 8.2 | 458 | 434 | 95.4 |
| C | 1 | 81 | 1324 | 7.02 | 471 | 435 | 126.5 |
| C | 1 | 80 | 1324 | 7.02 | 471 | 435 | 126.5 |
| C | 12 | 241 | 1285 | 6.71 | 471 | 435 | 126.5 |
| D | 6 | 231 | 1157 | 6.35 | 437 | 395 | 120.0 |
| D | 7 | 5 | 1115 | 6.0 | 437 | 395 | 120.0 |
| D | 3 | 31 | 1099 | 5.87 | 437 | 395 | 120.0 |
Histogram calculated using DETX and DETY for each event in the final _common_clean file
| Quadrant A | 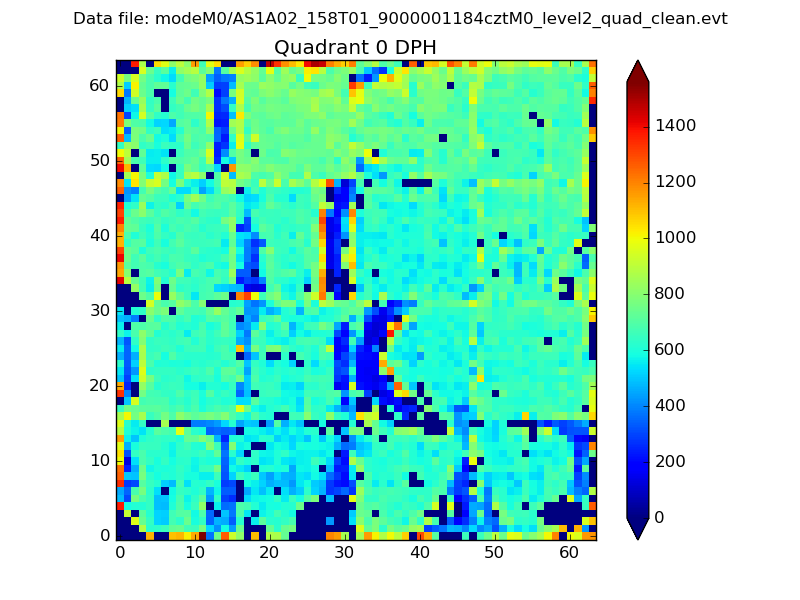 |
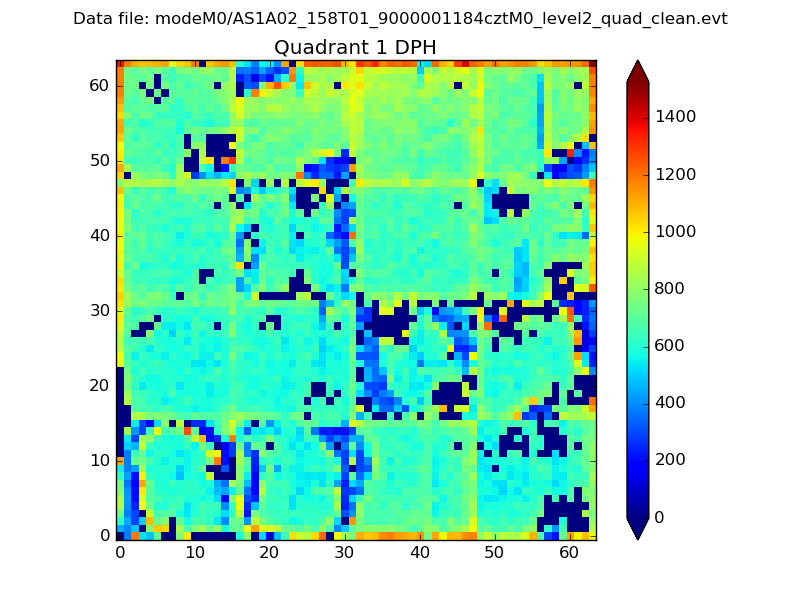 |
Quadrant B |
|---|---|---|---|
| Quadrant D | 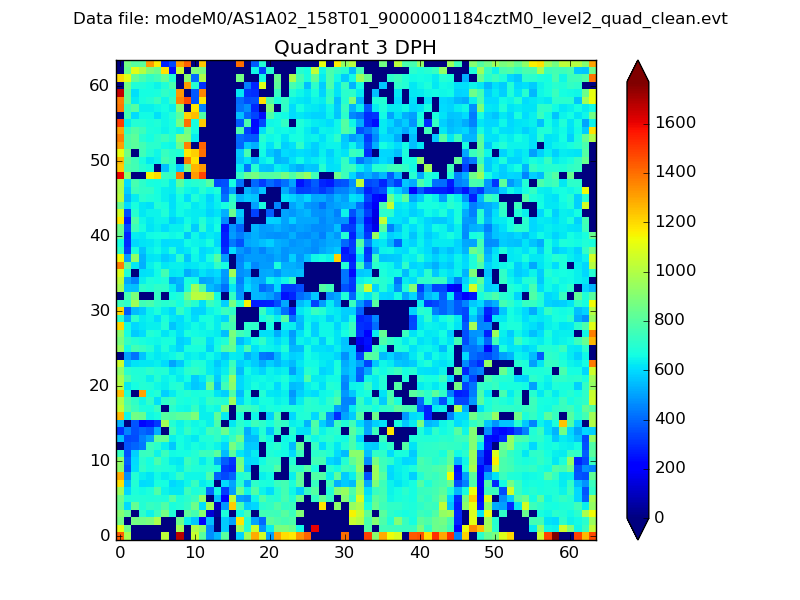 |
 |
Quadrant C |
| Plot type | Count rate plots | Images |
|---|---|---|
| Comparison with Poisson distribution Blue bars denote a histogram of data divided into 1 sec bins. Red curve is a Poisson curve with rate = median count rate of data. |
 |
 |
| Quadrant-wise count rates Data is divided into 100 sec bins |
 |
|
| Module-wise count rates for Quadrant A Data is divided into 100 sec bins |
 |
 |
| Module-wise count rates for Quadrant B Data is divided into 100 sec bins |
 |
 |
| Module-wise count rates for Quadrant C Data is divided into 100 sec bins |
 |
 |
| Module-wise count rates for Quadrant D Data is divided into 100 sec bins |
 |
 |
| Parameter | Plot |
|---|---|
| CZT HV Monitor |  |
| D_VDD |  |
| Temperature 1 |  |
| Veto HV Monitor |  |
| Veto LLD |  |
| Alpha Counter |  |
| _CPM_Rate |  |
| CZT Counter |  |
| +2.5 Volts monitor |  |
| +5 Volts monitor |  |
| _ROLL_ROT |  |
| _Roll_DEC |  |
| _Roll_RA |  |
| Veto Counter |  |