| Param | Original file | Final file |
|---|---|---|
| Filename | modeM0/AS1A02_158T01_9000001184_08413cztM0_level2.evt | modeM0/AS1A02_158T01_9000001184_08413cztM0_level2_quad_clean.evt |
| Size (bytes) | 240,292,800 | 31,495,680 |
| Size | 229.2 MB | 30.0 MB |
| Events in quadrant A | 1,660,932 | 181,143 |
| Events in quadrant B | 1,751,652 | 183,736 |
| Events in quadrant C | 1,658,313 | 182,711 |
| Events in quadrant D | 1,983,352 | 174,401 |
| Mode SS | |||
|---|---|---|---|
| Quadrant | BADHDUFLAG | Total packets | Discarded packets |
| A | 0 | 68 | 0 |
| B | 0 | 68 | 0 |
| C | 0 | 68 | 0 |
| D | 0 | 68 | 0 |
| Mode M9 | |||
|---|---|---|---|
| Quadrant | BADHDUFLAG | Total packets | Discarded packets |
| A | 0 | 2 | 0 |
| B | 0 | 2 | 0 |
| C | 0 | 2 | 0 |
| D | 0 | 2 | 0 |
| Mode M0 | |||
|---|---|---|---|
| Quadrant | BADHDUFLAG | Total packets | Discarded packets |
| A | 0 | 7010 | 2 |
| B | 0 | 7291 | 1 |
| C | 0 | 7040 | 1 |
| D | 0 | 8035 | 1 |
| Quadrant | Total seconds | Saturated seconds | Saturation percentage |
|---|---|---|---|
| A | 3249 | 154 | 4.739920% |
| B | 3249 | 174 | 5.355494% |
| C | 3249 | 94 | 2.893198% |
| D | 3249 | 150 | 4.616805% |
Noise dominated data is calculated using 1-second bins in cleaned event files. If a bin has >2000 counts, and if more than 50% of those come from <1% of pixels, then it is considered to be noise-dominated and hence unusable.
| Quadrant | # 1 sec bins | Bins with >0 counts | Bins with >2000 counts | High rate bins dominated by noise | Noise dominated (total time) | Noise dominated (detector-on time) | Marked lightcurve |
|---|---|---|---|---|---|---|---|
| A | 3494 | 3250 | 0 | 0 | 0.00% | 0.00% | 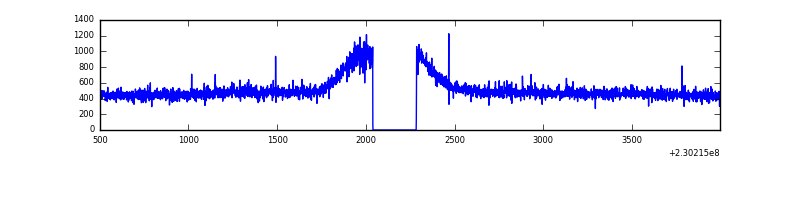 |
| B | 3494 | 3250 | 4 | 4 | 0.11% | 0.12% | 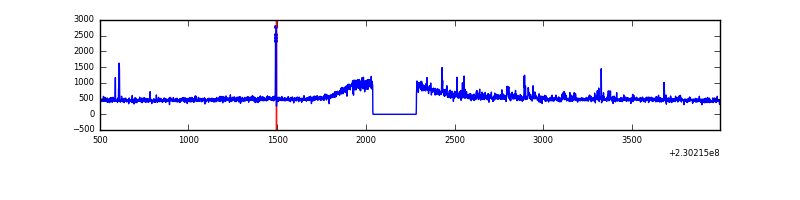 |
| C | 3494 | 3250 | 0 | 0 | 0.00% | 0.00% | 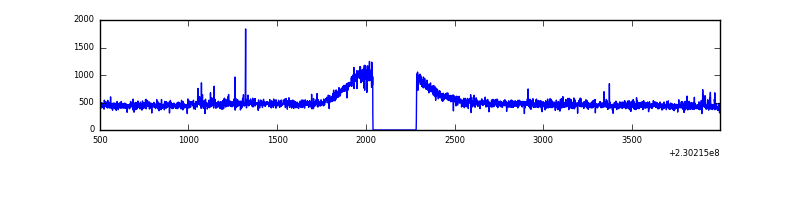 |
| D | 3494 | 3250 | 14 | 14 | 0.40% | 0.43% | 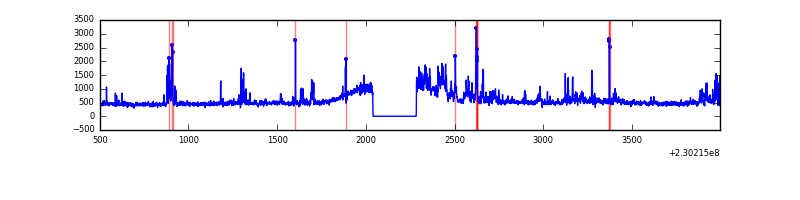 |
Top three noisy pixels from each quadrant. If the there are fewer than three noisy pixels in the level2.evt file, extra rows are filled as -1
| Pixel properties | Quadrant properties | ||||||
|---|---|---|---|---|---|---|---|
| Quadrant | DetID | PixID | Counts | Sigma | Mean | Median | Sigma |
| A | 0 | 226 | 4097 | 40.58 | 431 | 420 | 90.6 |
| A | 12 | 194 | 4040 | 39.95 | 431 | 420 | 90.6 |
| A | 13 | 251 | 3528 | 34.3 | 431 | 420 | 90.6 |
| B | 0 | 214 | 51344 | 590.17 | 427 | 415 | 86.3 |
| B | 10 | 252 | 13232 | 148.52 | 427 | 415 | 86.3 |
| B | 0 | 231 | 9133 | 101.02 | 427 | 415 | 86.3 |
| C | 1 | 16 | 14536 | 139.14 | 419 | 420 | 101.4 |
| C | 8 | 128 | 4556 | 40.77 | 419 | 420 | 101.4 |
| C | 13 | 61 | 3223 | 27.63 | 419 | 420 | 101.4 |
| D | 12 | 221 | 210712 | 2012.82 | 420 | 408 | 104.5 |
| D | 4 | 95 | 63091 | 599.94 | 420 | 408 | 104.5 |
| D | 12 | 233 | 49834 | 473.06 | 420 | 408 | 104.5 |
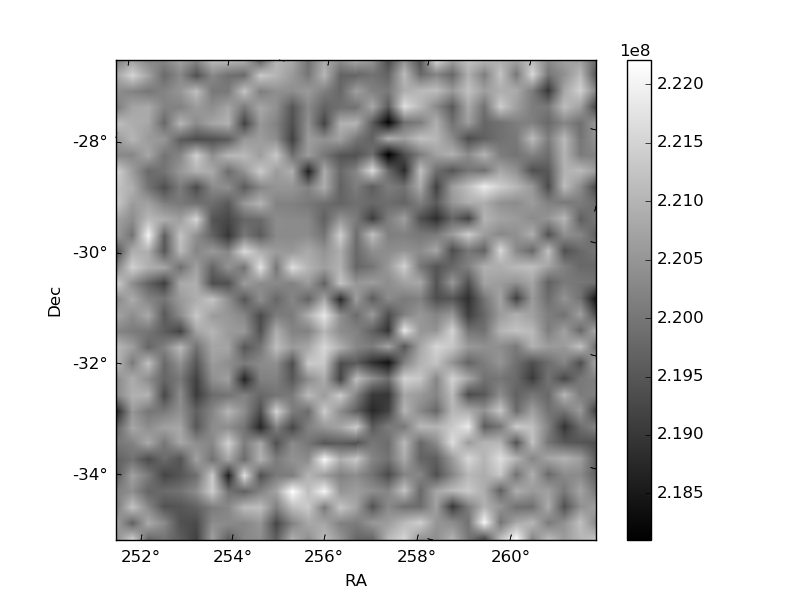
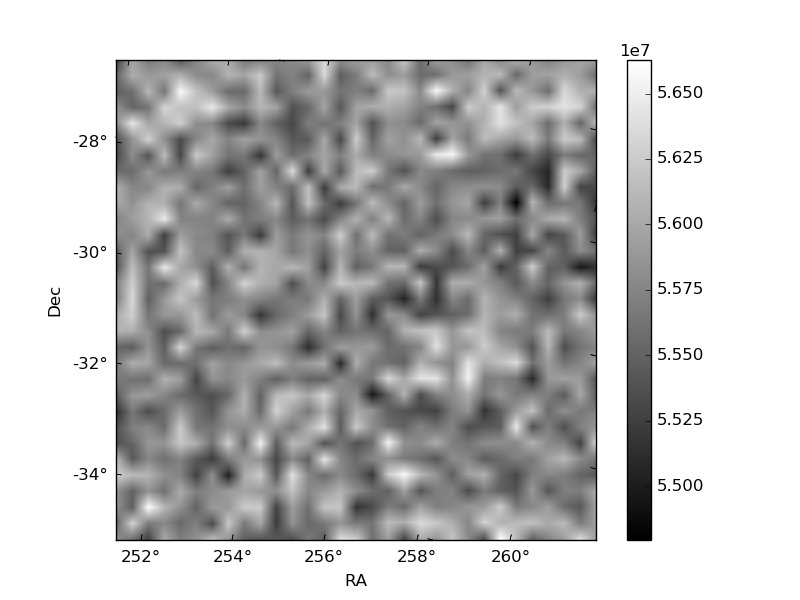
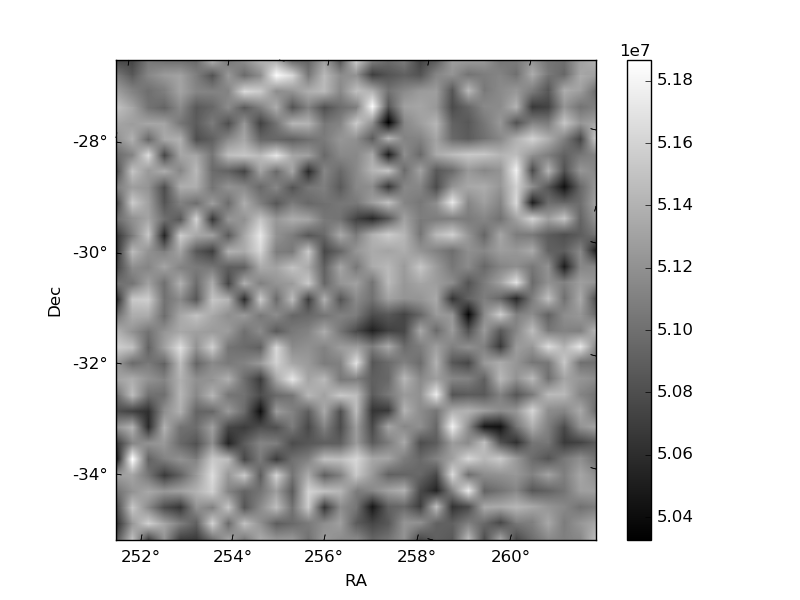
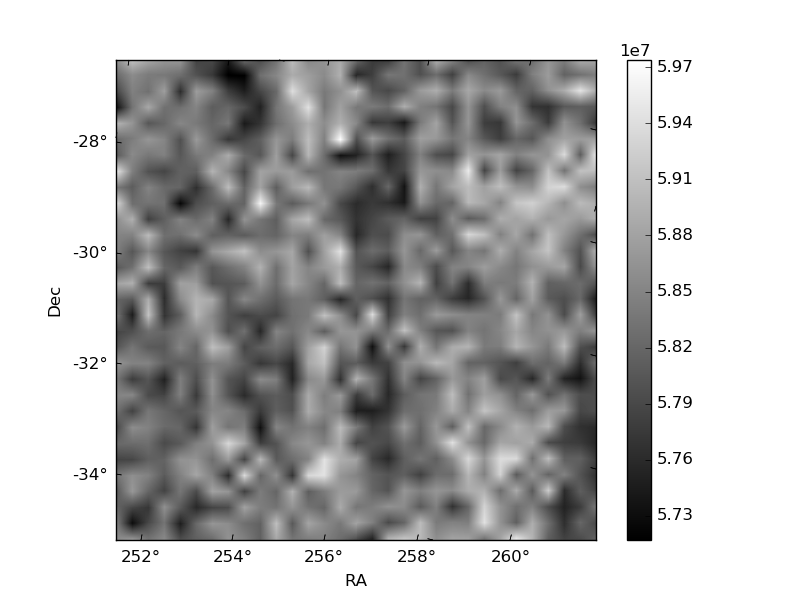
Histogram calculated using DETX and DETY for each event in the final _common_clean file
| Quadrant A | 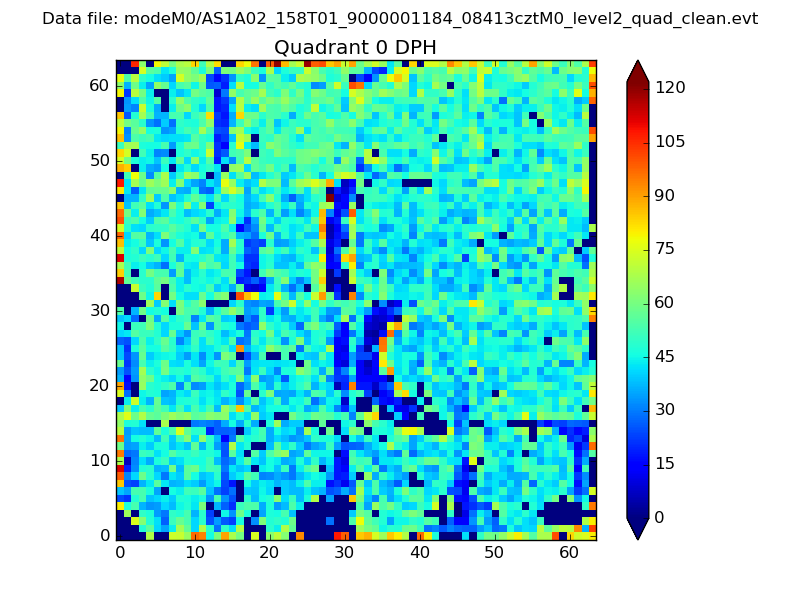 |
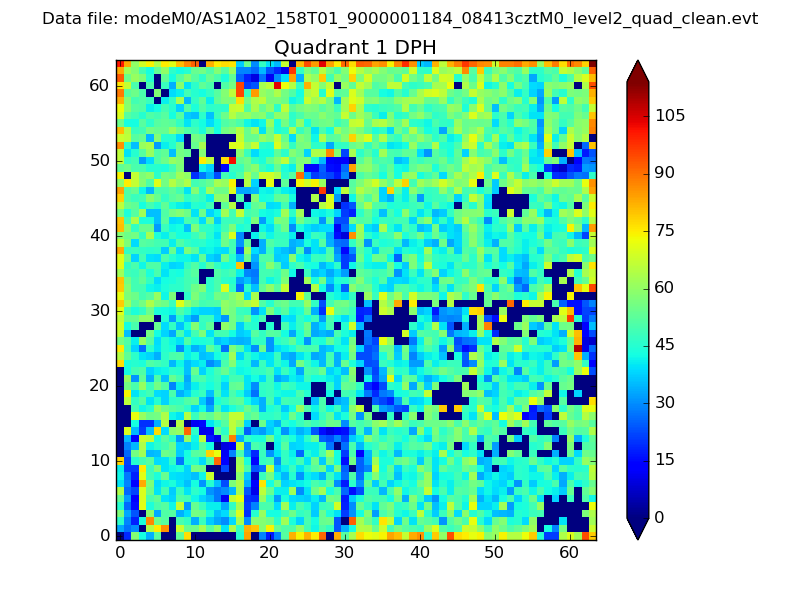 |
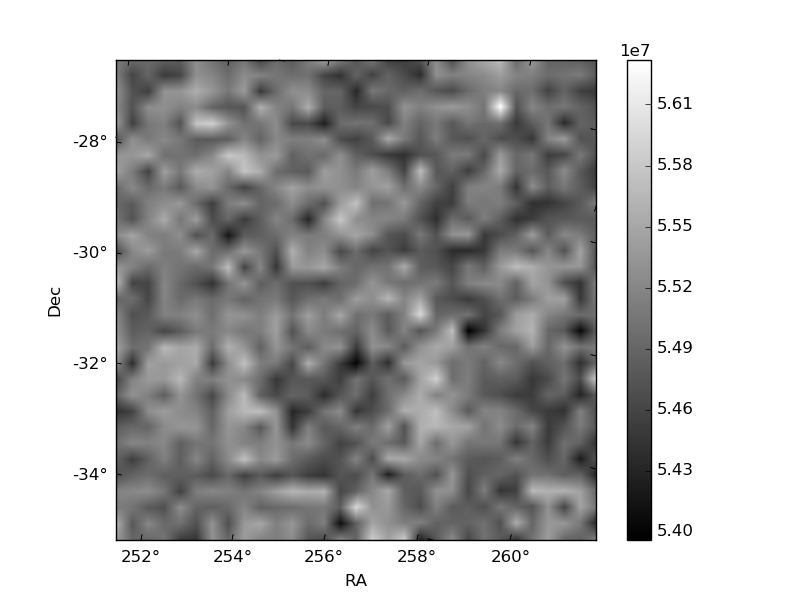
Quadrant B |
|---|---|---|---|
| Quadrant D | 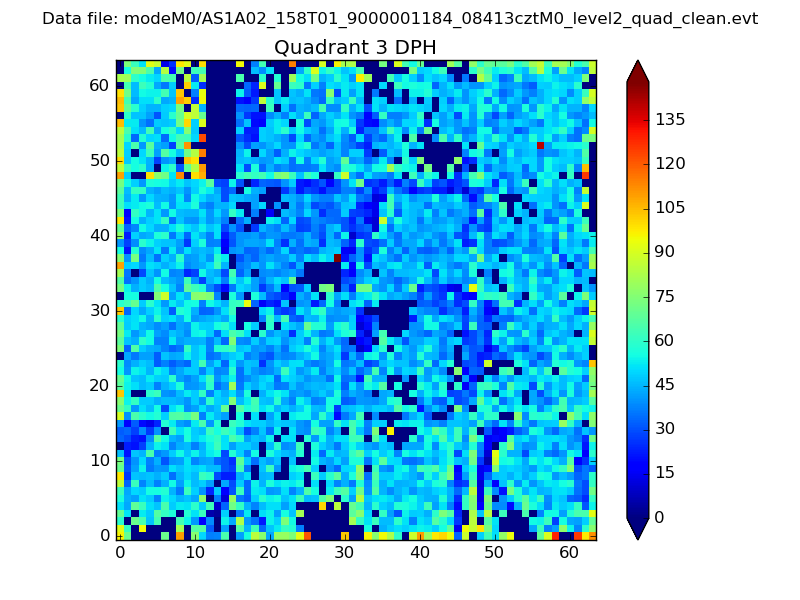 |
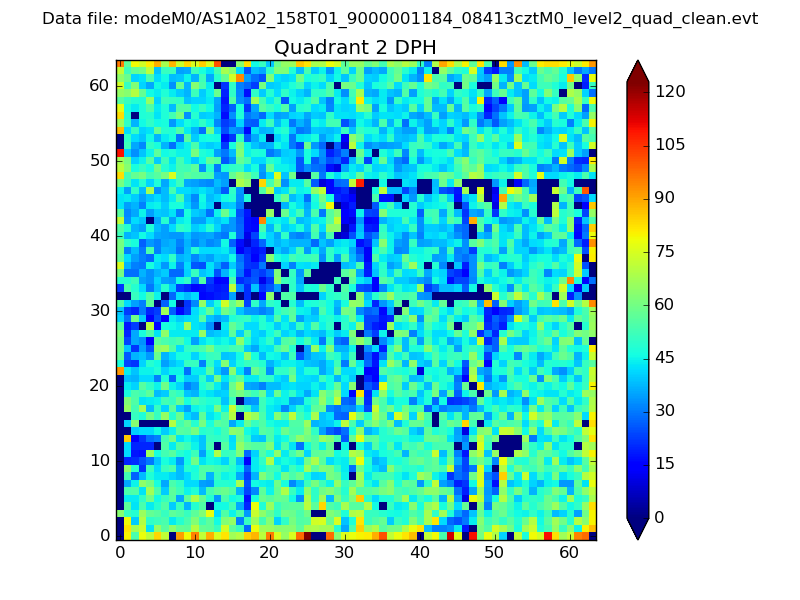 |
Quadrant C |
| Plot type | Count rate plots | Images |
|---|---|---|
| Comparison with Poisson distribution Blue bars denote a histogram of data divided into 1 sec bins. Red curve is a Poisson curve with rate = median count rate of data. |
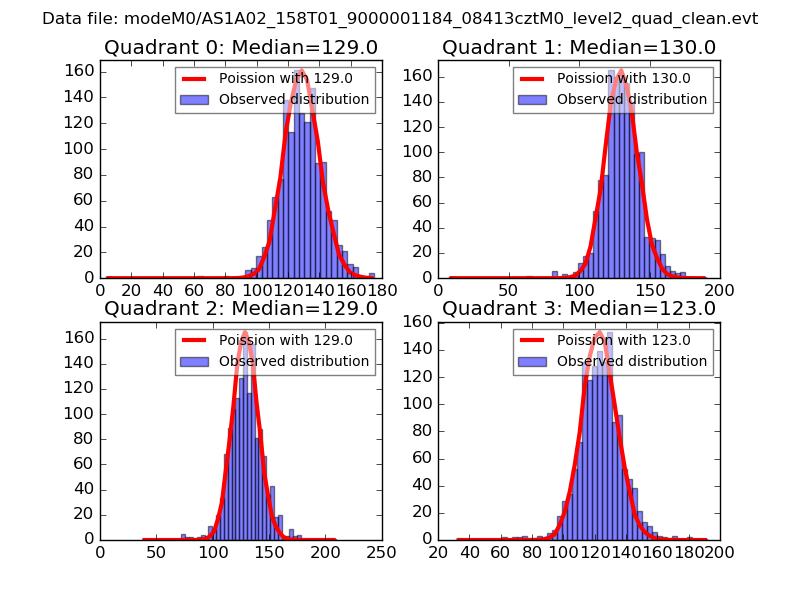 |
 |
| Quadrant-wise count rates Data is divided into 100 sec bins |
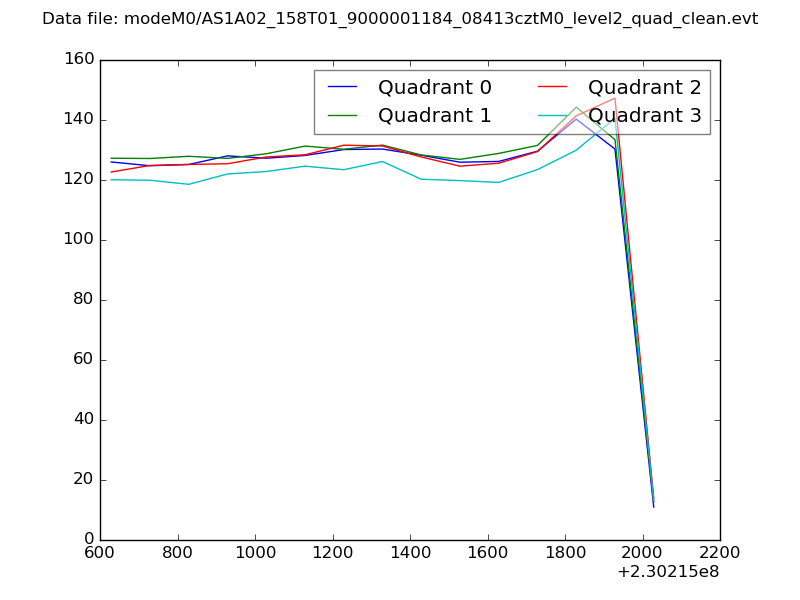 |
|
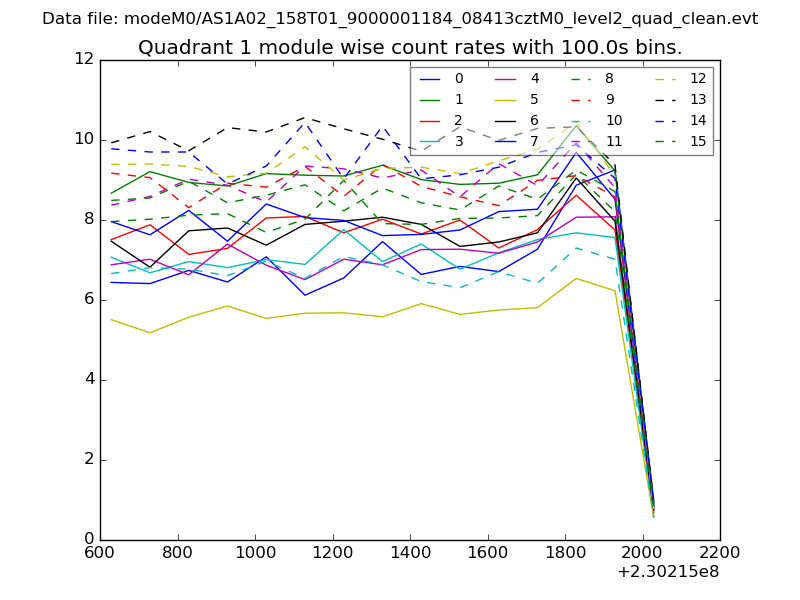
| Module-wise count rates for Quadrant A Data is divided into 100 sec bins |
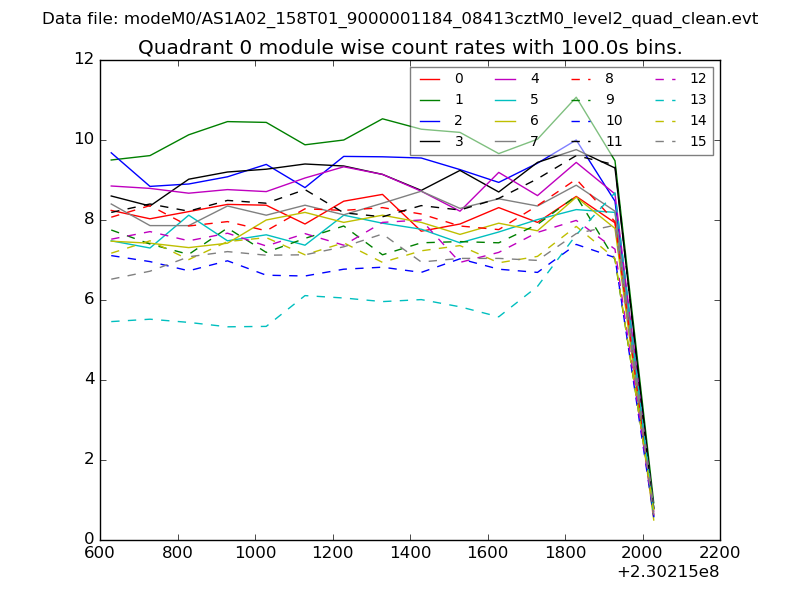 |
 |
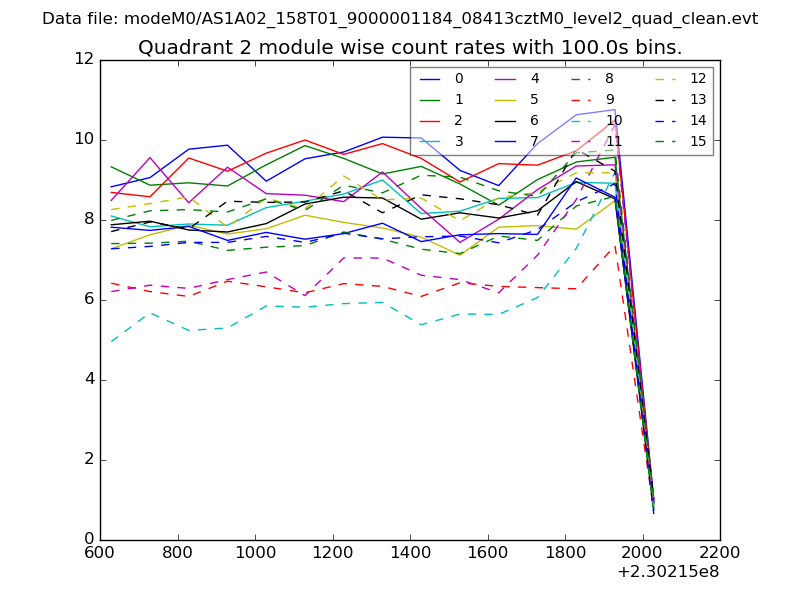
| Module-wise count rates for Quadrant B Data is divided into 100 sec bins |
 |
 |
| Module-wise count rates for Quadrant C Data is divided into 100 sec bins |
 |
 |
| Module-wise count rates for Quadrant D Data is divided into 100 sec bins |
 |
 |
| Parameter | Plot |
|---|---|
| CZT HV Monitor | 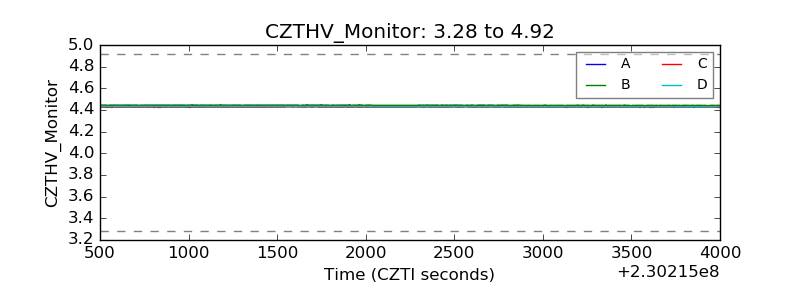 |
| D_VDD | 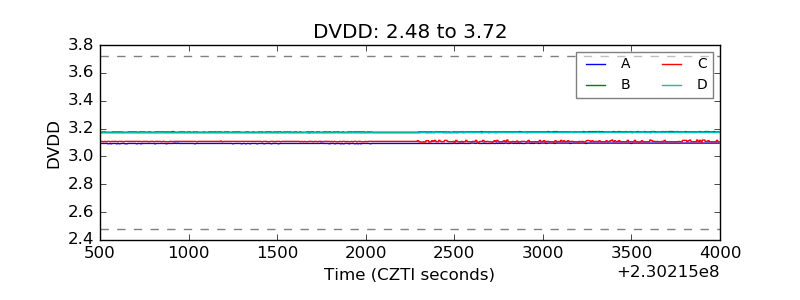 |
| Temperature 1 | 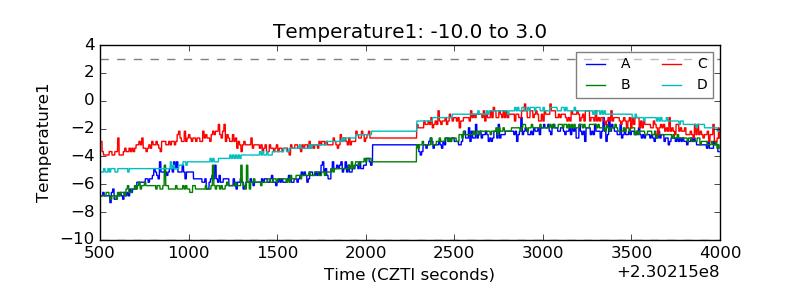 |
| Veto HV Monitor | 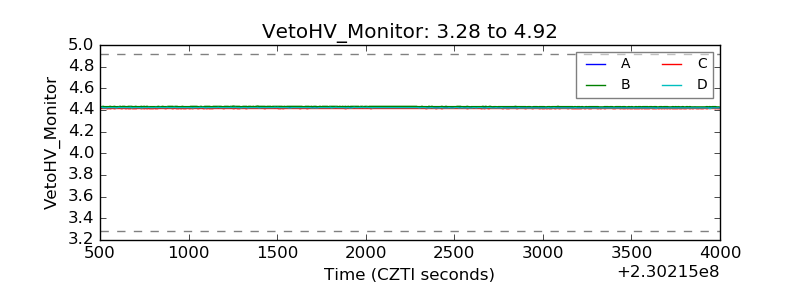 |
| Veto LLD | 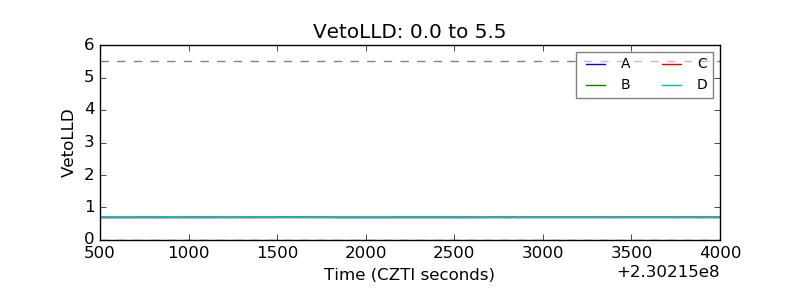 |
| Alpha Counter |  |
| _CPM_Rate | 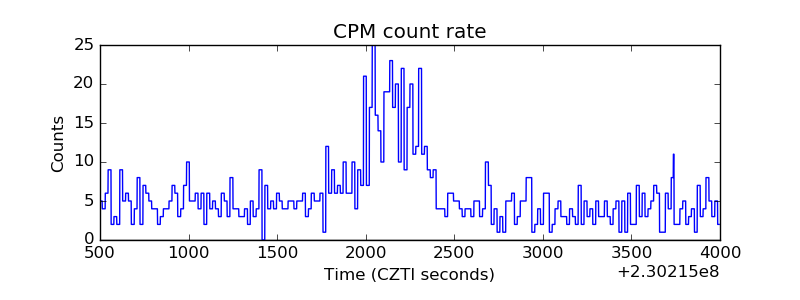 |
| CZT Counter | 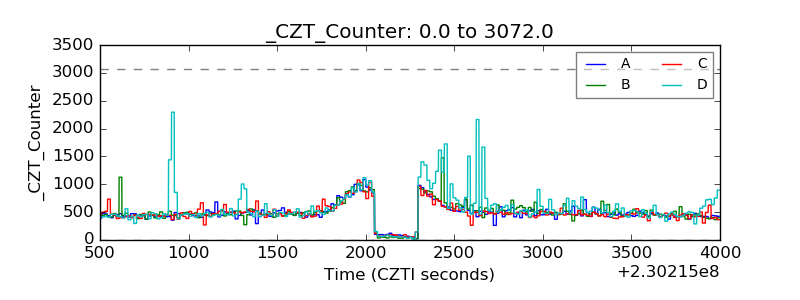 |
| +2.5 Volts monitor | 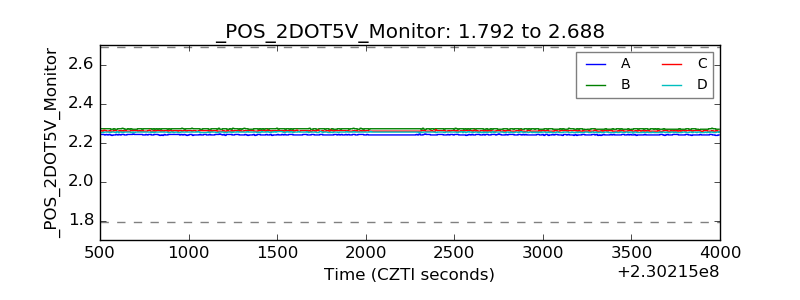 |
| +5 Volts monitor |  |
| _ROLL_ROT | 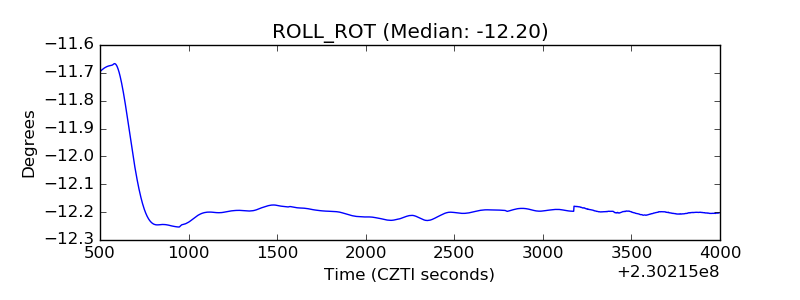 |
| _Roll_DEC | 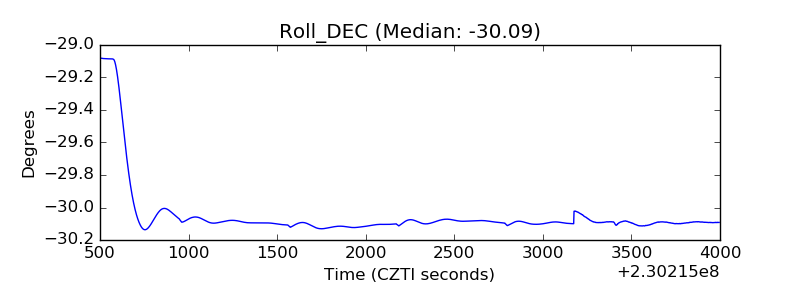 |
| _Roll_RA | 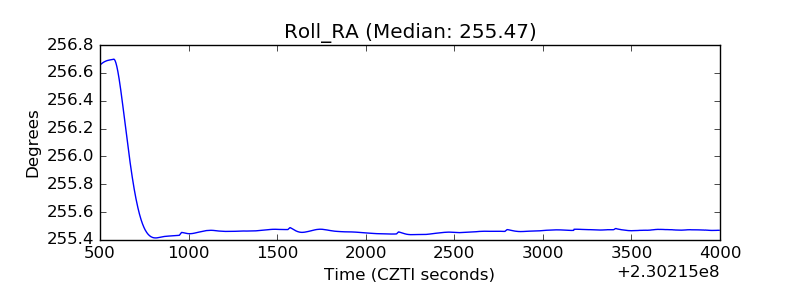 |
| Veto Counter | 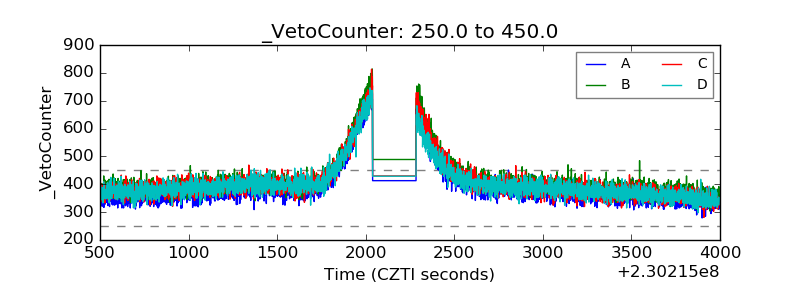 |