| Param | Original file | Final file |
|---|---|---|
| Filename | modeM0/AS1A02_158T01_9000001184_08414cztM0_level2.evt | modeM0/AS1A02_158T01_9000001184_08414cztM0_level2_quad_clean.evt |
| Size (bytes) | 592,522,560 | 84,280,320 |
| Size | 565.1 MB | 80.4 MB |
| Events in quadrant A | 3,985,133 | 500,344 |
| Events in quadrant B | 4,265,257 | 506,083 |
| Events in quadrant C | 3,970,110 | 499,620 |
| Events in quadrant D | 5,166,436 | 474,886 |
| Mode SS | |||
|---|---|---|---|
| Quadrant | BADHDUFLAG | Total packets | Discarded packets |
| A | 0 | 170 | 0 |
| B | 0 | 170 | 2 |
| C | 0 | 170 | 0 |
| D | 0 | 170 | 0 |
| Mode M9 | |||
|---|---|---|---|
| Quadrant | BADHDUFLAG | Total packets | Discarded packets |
| A | 0 | 2 | 0 |
| B | 0 | 2 | 0 |
| C | 0 | 2 | 0 |
| D | 0 | 2 | 0 |
| Mode M0 | |||
|---|---|---|---|
| Quadrant | BADHDUFLAG | Total packets | Discarded packets |
| A | 0 | 17452 | 71 |
| B | 0 | 18159 | 105 |
| C | 0 | 17503 | 81 |
| D | 0 | 20835 | 87 |
| Quadrant | Total seconds | Saturated seconds | Saturation percentage |
|---|---|---|---|
| A | 8211 | 308 | 3.751066% |
| B | 8208 | 339 | 4.130117% |
| C | 8207 | 161 | 1.961740% |
| D | 8207 | 304 | 3.704155% |
Noise dominated data is calculated using 1-second bins in cleaned event files. If a bin has >2000 counts, and if more than 50% of those come from <1% of pixels, then it is considered to be noise-dominated and hence unusable.
| Quadrant | # 1 sec bins | Bins with >0 counts | Bins with >2000 counts | High rate bins dominated by noise | Noise dominated (total time) | Noise dominated (detector-on time) | Marked lightcurve |
|---|---|---|---|---|---|---|---|
| A | 8594 | 8243 | 0 | 0 | 0.00% | 0.00% | 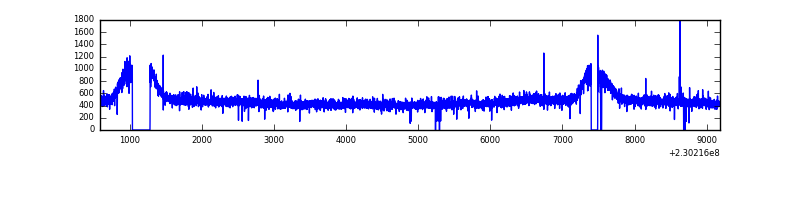 |
| B | 8594 | 8244 | 8 | 8 | 0.09% | 0.10% | 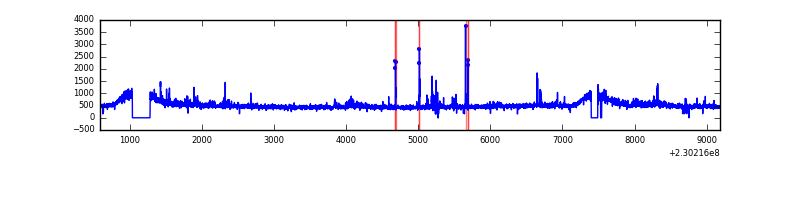 |
| C | 8594 | 8246 | 2 | 2 | 0.02% | 0.02% | 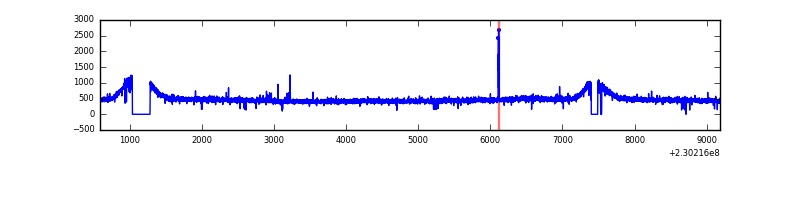 |
| D | 8594 | 8245 | 83 | 83 | 0.97% | 1.01% | 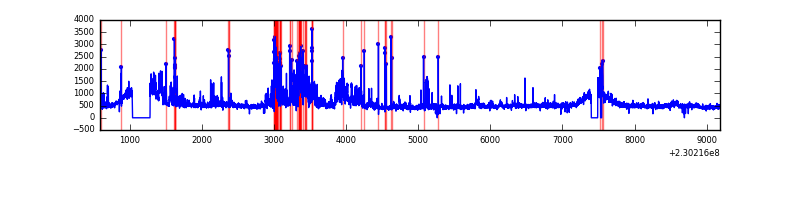 |
Top three noisy pixels from each quadrant. If the there are fewer than three noisy pixels in the level2.evt file, extra rows are filled as -1
| Pixel properties | Quadrant properties | ||||||
|---|---|---|---|---|---|---|---|
| Quadrant | DetID | PixID | Counts | Sigma | Mean | Median | Sigma |
| A | 0 | 226 | 9666 | 40.59 | 1034 | 1007 | 213.3 |
| A | 12 | 194 | 9224 | 38.52 | 1034 | 1007 | 213.3 |
| A | 5 | 16 | 7815 | 31.91 | 1034 | 1007 | 213.3 |
| B | 0 | 214 | 101858 | 497.14 | 1032 | 1005 | 202.9 |
| B | 5 | 255 | 49463 | 238.87 | 1032 | 1005 | 202.9 |
| B | 4 | 81 | 25911 | 122.77 | 1032 | 1005 | 202.9 |
| C | 1 | 16 | 26846 | 109.34 | 1004 | 1007 | 236.3 |
| C | 8 | 128 | 13673 | 53.6 | 1004 | 1007 | 236.3 |
| C | 13 | 61 | 7805 | 28.77 | 1004 | 1007 | 236.3 |
| D | 12 | 221 | 742858 | 3010.77 | 1000 | 970 | 246.4 |
| D | 4 | 95 | 268057 | 1083.91 | 1000 | 970 | 246.4 |
| D | 1 | 52 | 182290 | 735.84 | 1000 | 970 | 246.4 |
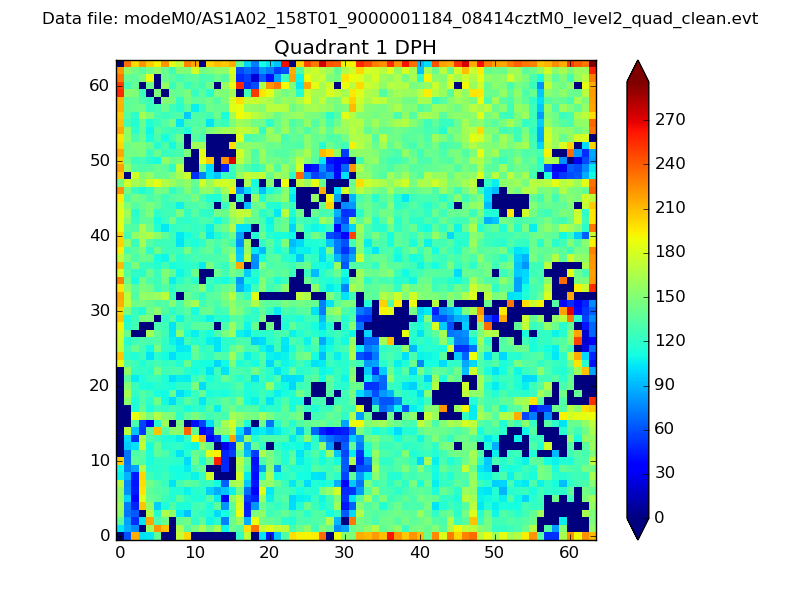
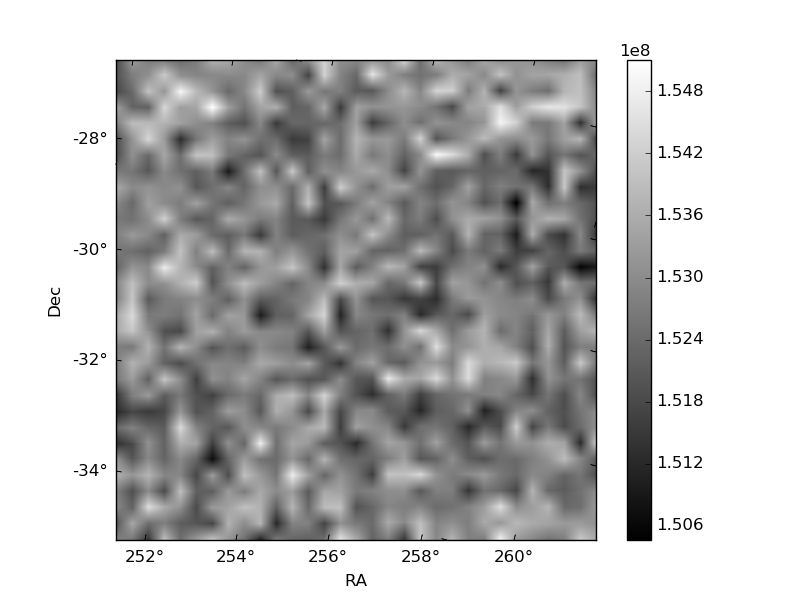
Histogram calculated using DETX and DETY for each event in the final _common_clean file
| Quadrant A |  |
 |
Quadrant B |
|---|---|---|---|
| Quadrant D | 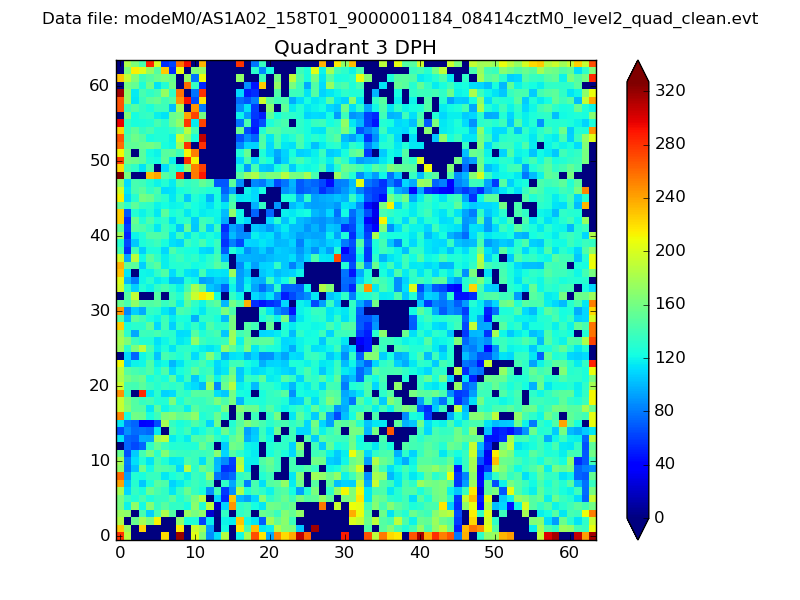 |
 |
Quadrant C |
| Plot type | Count rate plots | Images |
|---|---|---|
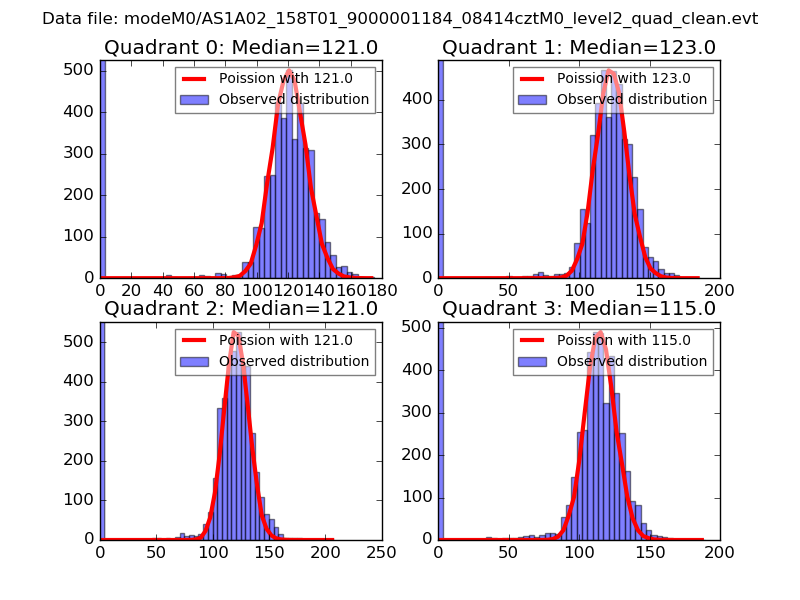
| Comparison with Poisson distribution Blue bars denote a histogram of data divided into 1 sec bins. Red curve is a Poisson curve with rate = median count rate of data. |
 |
 |
| Quadrant-wise count rates Data is divided into 100 sec bins |
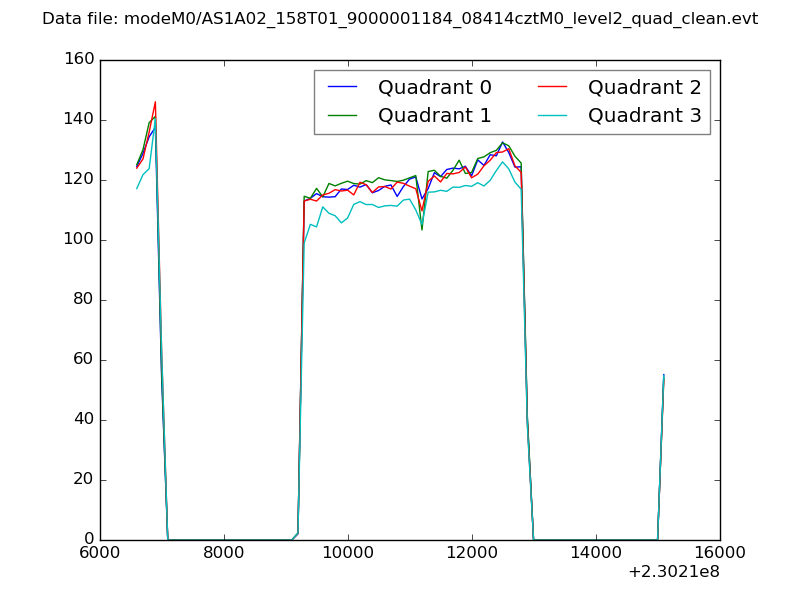 |
|
| Module-wise count rates for Quadrant A Data is divided into 100 sec bins |
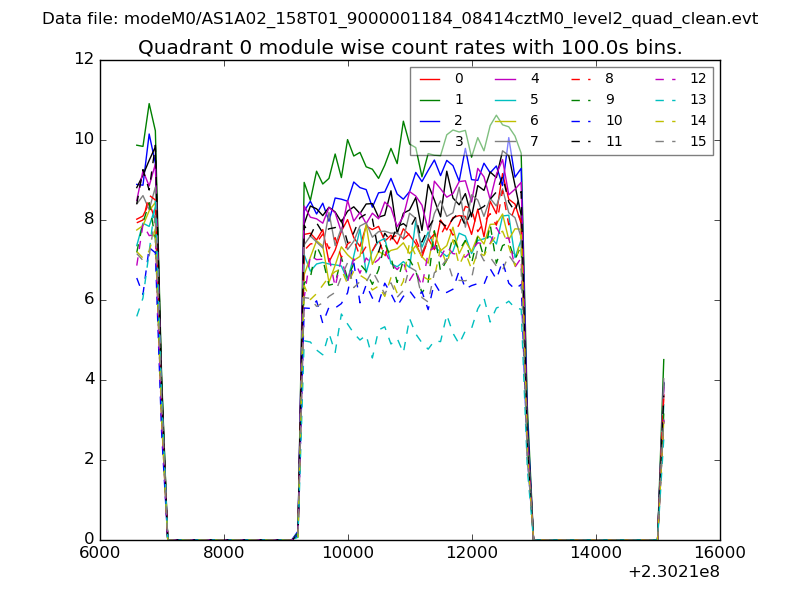 |
 |
| Module-wise count rates for Quadrant B Data is divided into 100 sec bins |
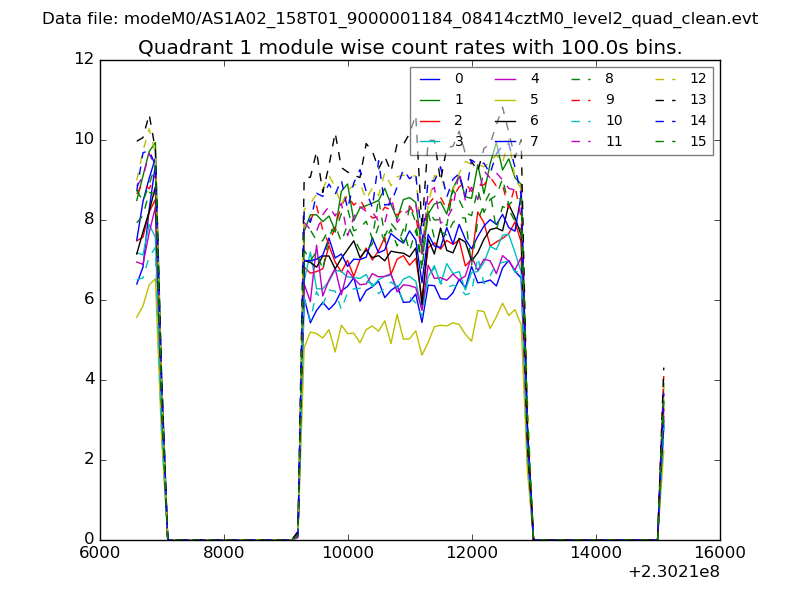 |
 |
| Module-wise count rates for Quadrant C Data is divided into 100 sec bins |
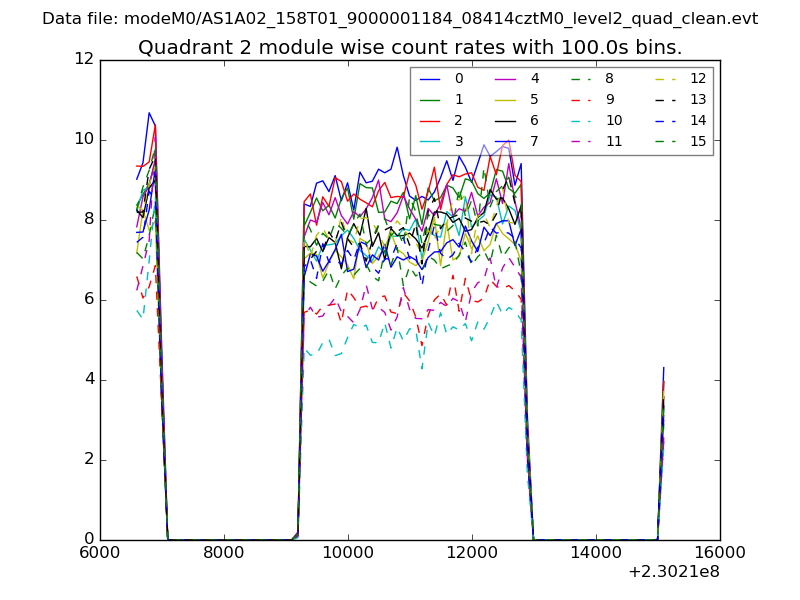 |
 |
| Module-wise count rates for Quadrant D Data is divided into 100 sec bins |
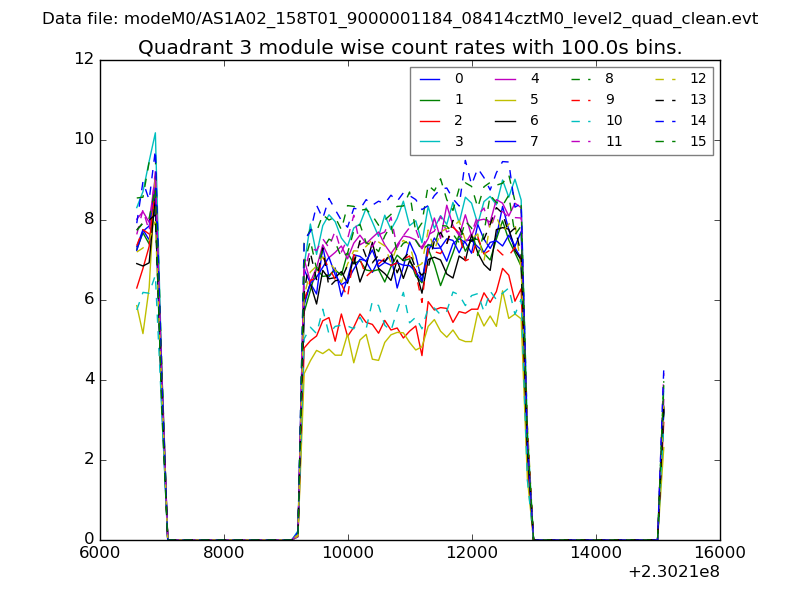 |
 |
| Parameter | Plot |
|---|---|
| CZT HV Monitor | 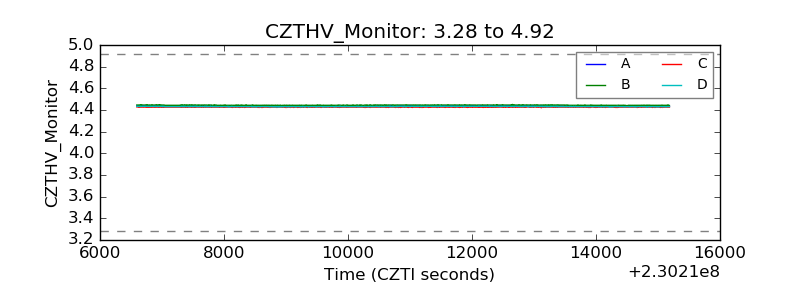 |
| D_VDD | 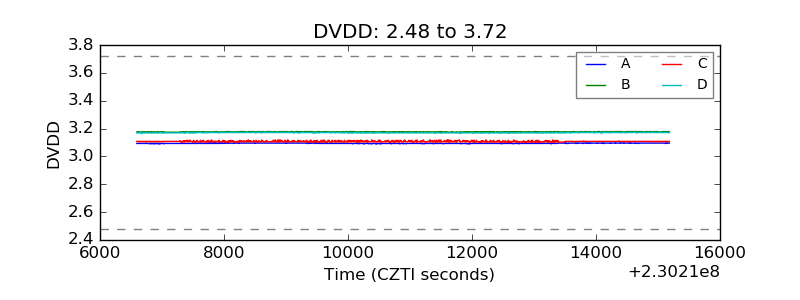 |
| Temperature 1 | 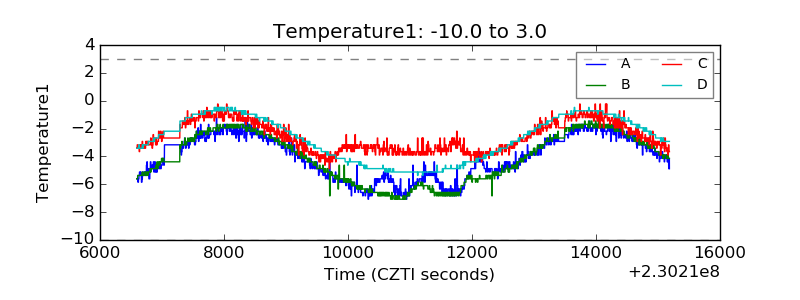 |
| Veto HV Monitor | 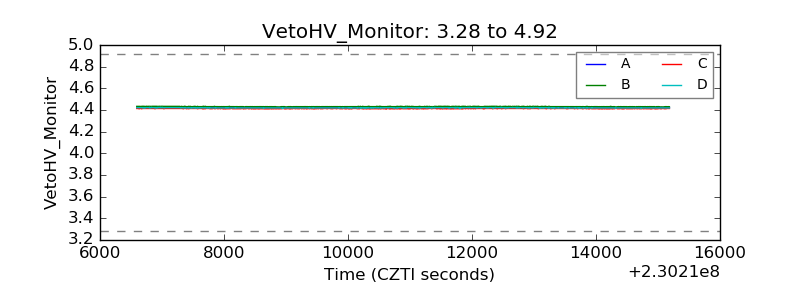 |
| Veto LLD | 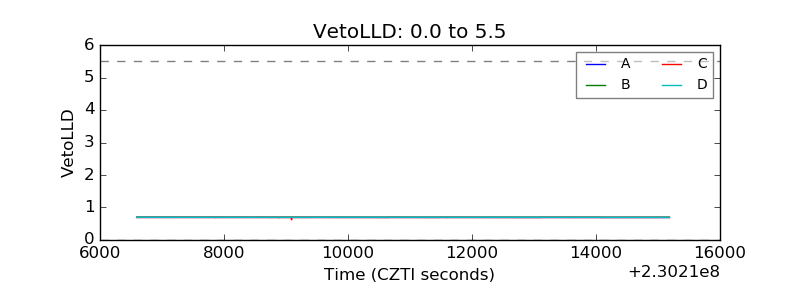 |
| Alpha Counter | 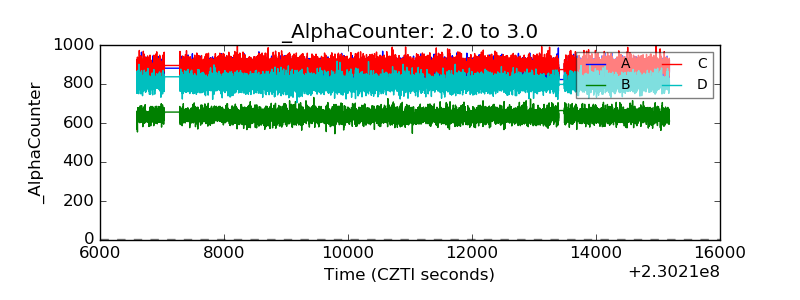 |
| _CPM_Rate | 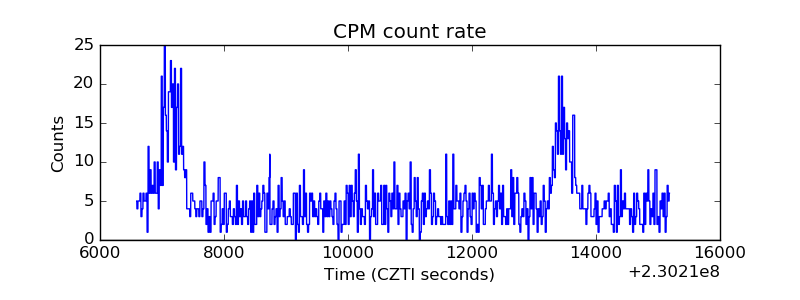 |
| CZT Counter | 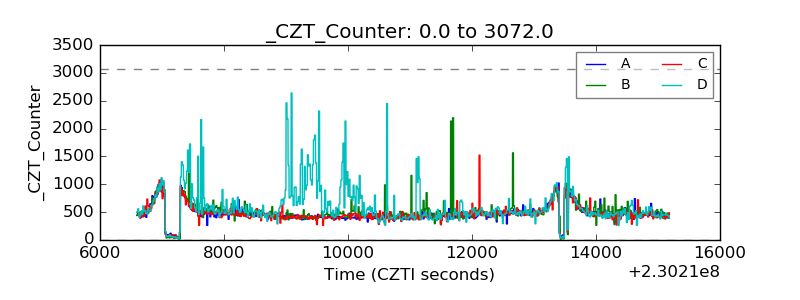 |
| +2.5 Volts monitor |  |
| +5 Volts monitor |  |
| _ROLL_ROT | 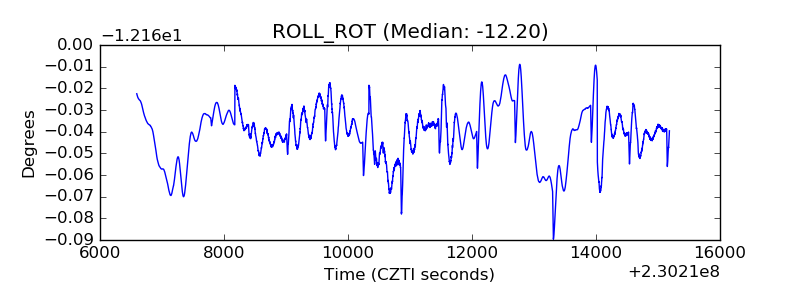 |
| _Roll_DEC | 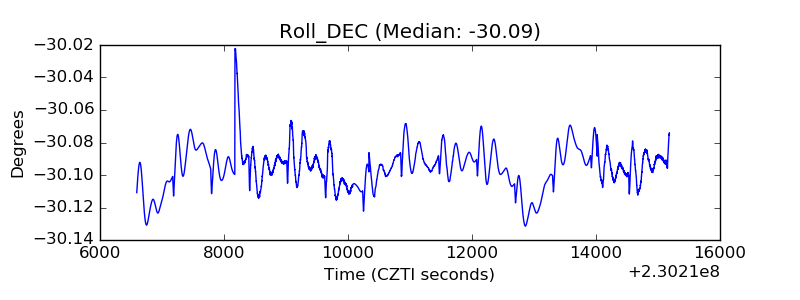 |
| _Roll_RA | 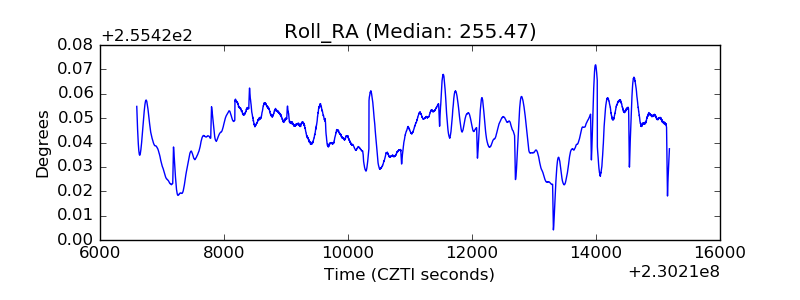 |
| Veto Counter | 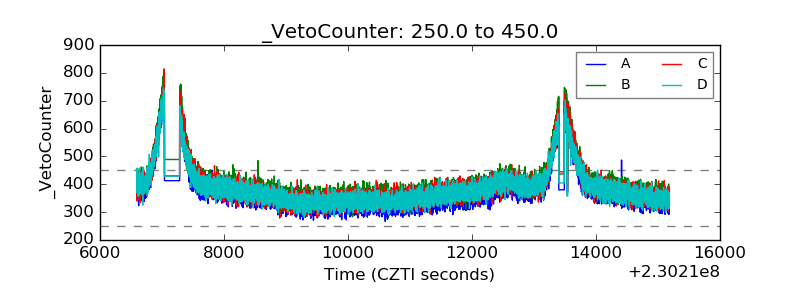 |