| Param | Original file | Final file |
|---|---|---|
| Filename | modeM0/AS1A02_158T01_9000001184_08415cztM0_level2.evt | modeM0/AS1A02_158T01_9000001184_08415cztM0_level2_quad_clean.evt |
| Size (bytes) | 557,354,880 | 85,904,640 |
| Size | 531.5 MB | 81.9 MB |
| Events in quadrant A | 3,960,038 | 509,585 |
| Events in quadrant B | 4,189,726 | 516,373 |
| Events in quadrant C | 3,898,270 | 511,450 |
| Events in quadrant D | 4,268,502 | 487,876 |
| Mode SS | |||
|---|---|---|---|
| Quadrant | BADHDUFLAG | Total packets | Discarded packets |
| A | 0 | 168 | 0 |
| B | 0 | 168 | 0 |
| C | 0 | 168 | 0 |
| D | 0 | 168 | 0 |
| Mode M9 | |||
|---|---|---|---|
| Quadrant | BADHDUFLAG | Total packets | Discarded packets |
| A | 0 | 4 | 0 |
| B | 0 | 4 | 0 |
| C | 0 | 4 | 0 |
| D | 0 | 4 | 0 |
| Mode M0 | |||
|---|---|---|---|
| Quadrant | BADHDUFLAG | Total packets | Discarded packets |
| A | 0 | 17329 | 4 |
| B | 0 | 17865 | 3 |
| C | 0 | 17305 | 3 |
| D | 0 | 18418 | 3 |
| Quadrant | Total seconds | Saturated seconds | Saturation percentage |
|---|---|---|---|
| A | 8290 | 213 | 2.569361% |
| B | 8290 | 228 | 2.750302% |
| C | 8290 | 98 | 1.182147% |
| D | 8290 | 184 | 2.219542% |
Noise dominated data is calculated using 1-second bins in cleaned event files. If a bin has >2000 counts, and if more than 50% of those come from <1% of pixels, then it is considered to be noise-dominated and hence unusable.
| Quadrant | # 1 sec bins | Bins with >0 counts | Bins with >2000 counts | High rate bins dominated by noise | Noise dominated (total time) | Noise dominated (detector-on time) | Marked lightcurve |
|---|---|---|---|---|---|---|---|
| A | 8730 | 8293 | 0 | 0 | 0.00% | 0.00% | 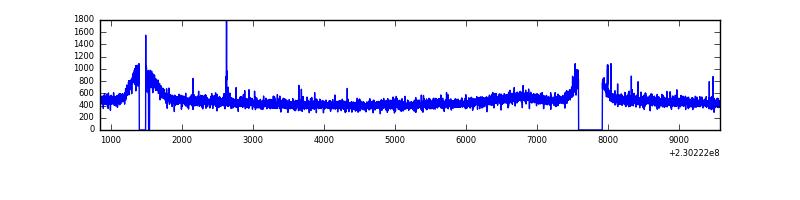 |
| B | 8730 | 8293 | 1 | 1 | 0.01% | 0.01% | 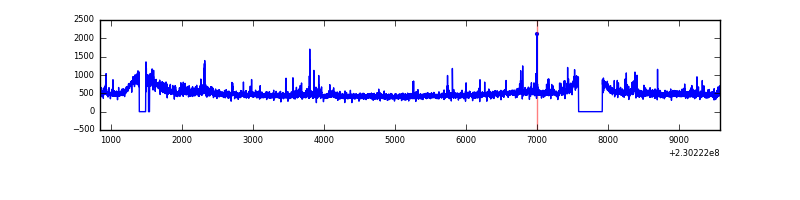 |
| C | 8730 | 8293 | 2 | 2 | 0.02% | 0.02% | 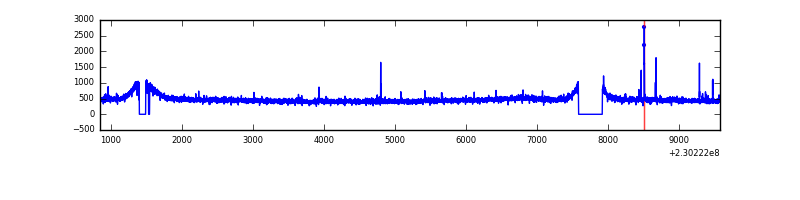 |
| D | 8730 | 8292 | 39 | 39 | 0.45% | 0.47% |  |
Top three noisy pixels from each quadrant. If the there are fewer than three noisy pixels in the level2.evt file, extra rows are filled as -1
| Pixel properties | Quadrant properties | ||||||
|---|---|---|---|---|---|---|---|
| Quadrant | DetID | PixID | Counts | Sigma | Mean | Median | Sigma |
| A | 13 | 251 | 21728 | 98.29 | 1020 | 993 | 210.9 |
| A | 5 | 16 | 9539 | 40.51 | 1020 | 993 | 210.9 |
| A | 0 | 226 | 9454 | 40.11 | 1020 | 993 | 210.9 |
| B | 0 | 214 | 129268 | 646.33 | 1022 | 996 | 198.5 |
| B | 5 | 255 | 23365 | 112.71 | 1022 | 996 | 198.5 |
| B | 12 | 111 | 20773 | 99.65 | 1022 | 996 | 198.5 |
| C | 1 | 16 | 33045 | 138.54 | 990 | 993 | 231.4 |
| C | 13 | 61 | 7556 | 28.37 | 990 | 993 | 231.4 |
| C | 8 | 222 | 2874 | 8.13 | 990 | 993 | 231.4 |
| D | 4 | 95 | 132459 | 542.47 | 984 | 952 | 242.4 |
| D | 14 | 34 | 99667 | 407.2 | 984 | 952 | 242.4 |
| D | 12 | 221 | 77116 | 314.18 | 984 | 952 | 242.4 |
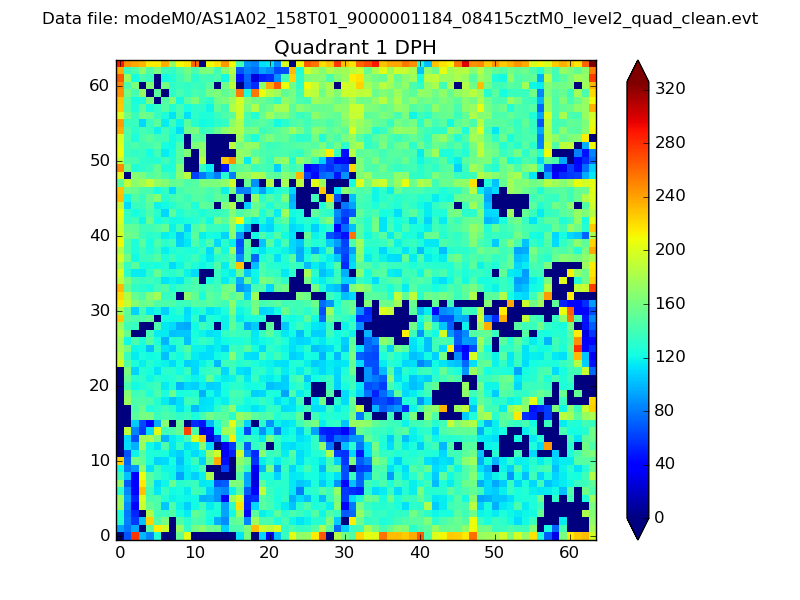
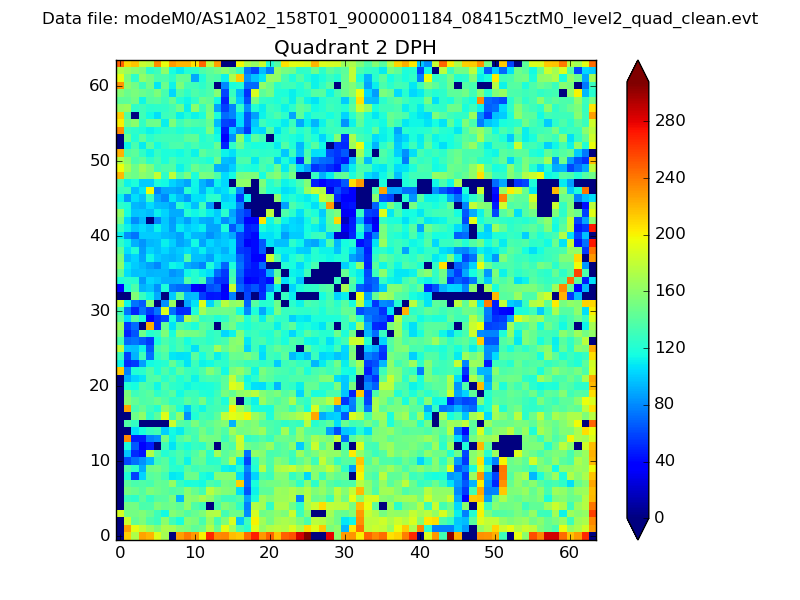
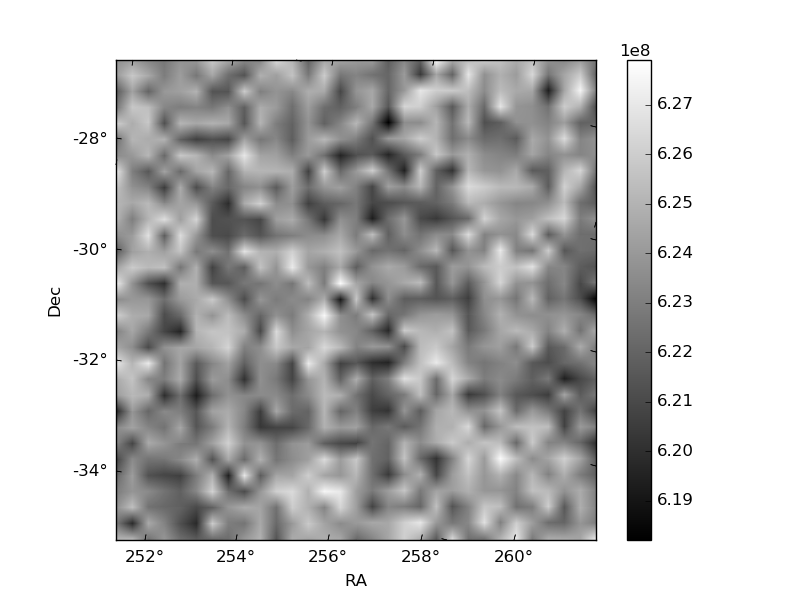
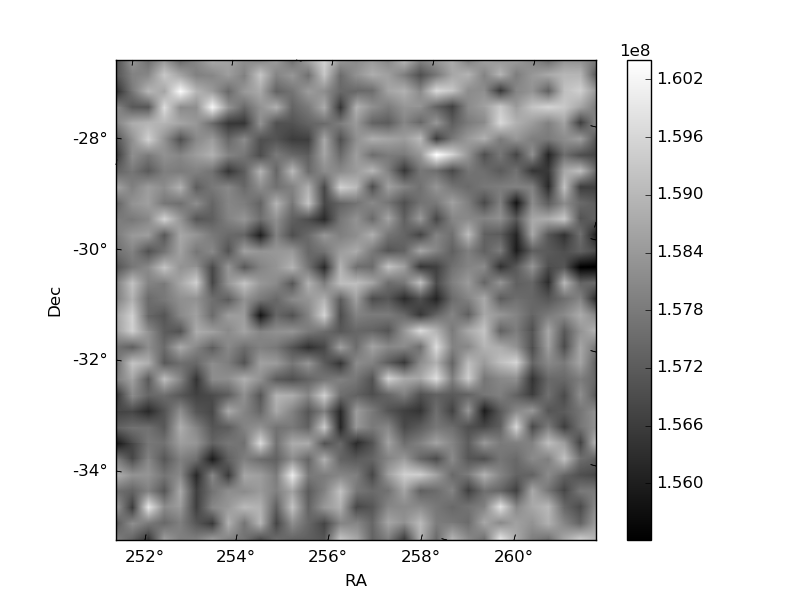
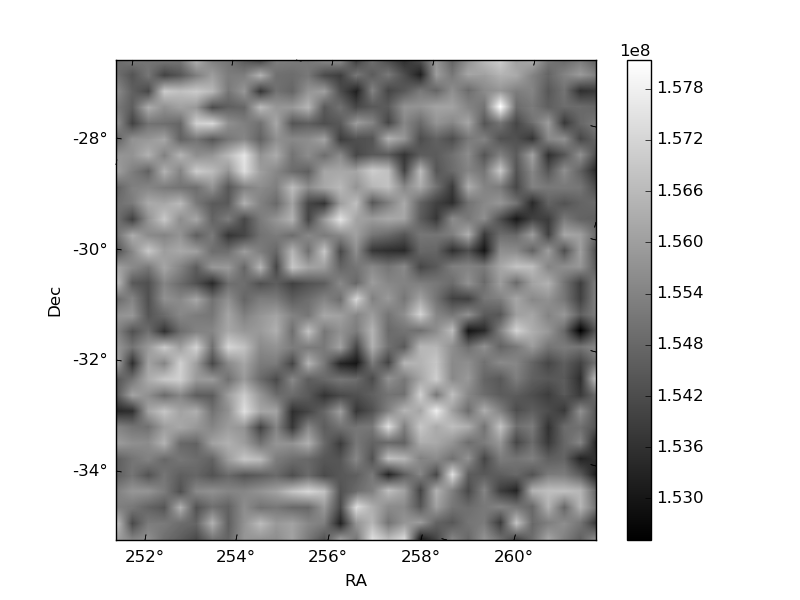
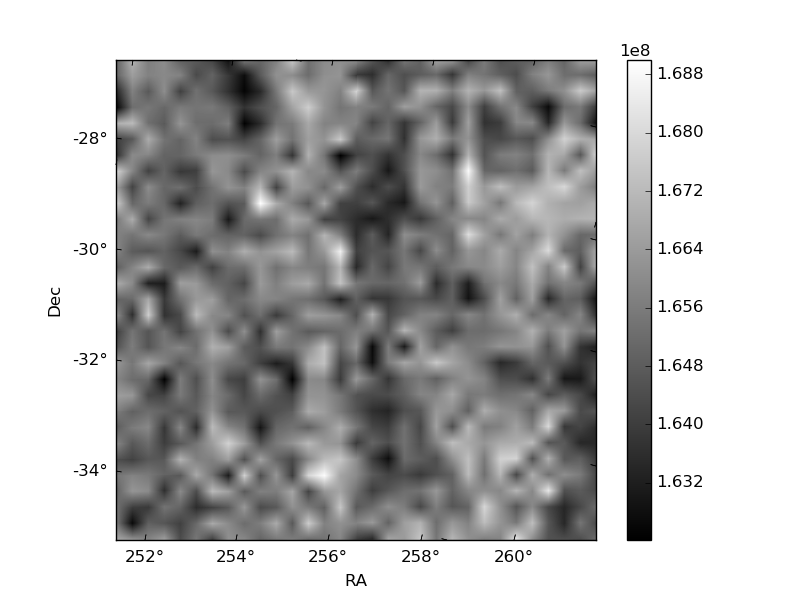
Histogram calculated using DETX and DETY for each event in the final _common_clean file
| Quadrant A | 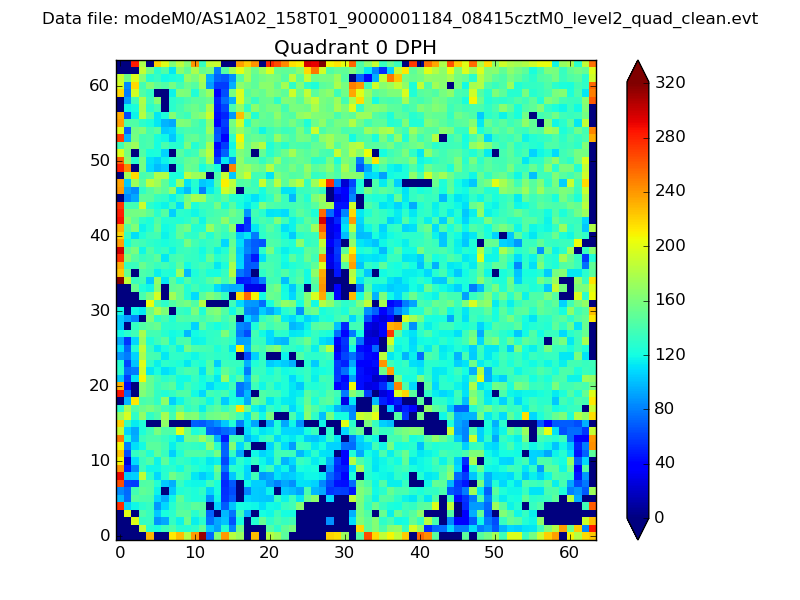 |
 |
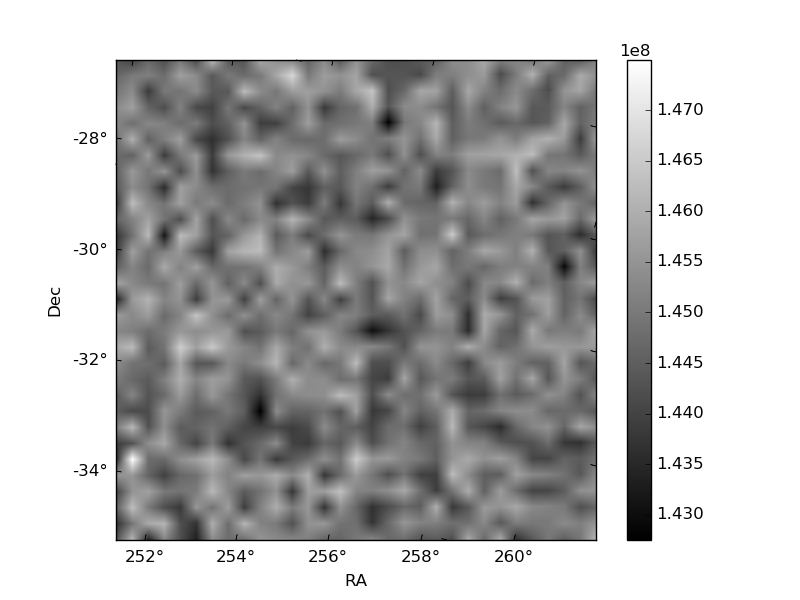
Quadrant B |
|---|---|---|---|
| Quadrant D | 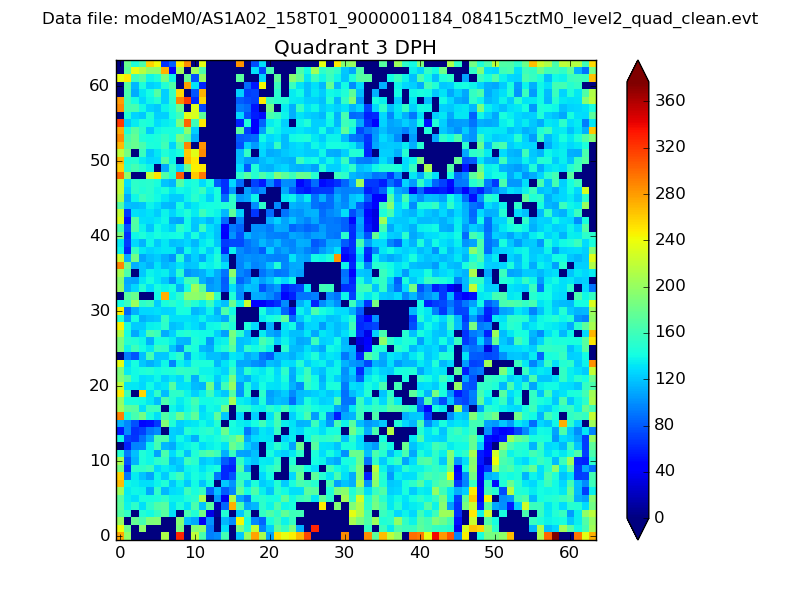 |
 |
Quadrant C |
| Plot type | Count rate plots | Images |
|---|---|---|
| Comparison with Poisson distribution Blue bars denote a histogram of data divided into 1 sec bins. Red curve is a Poisson curve with rate = median count rate of data. |
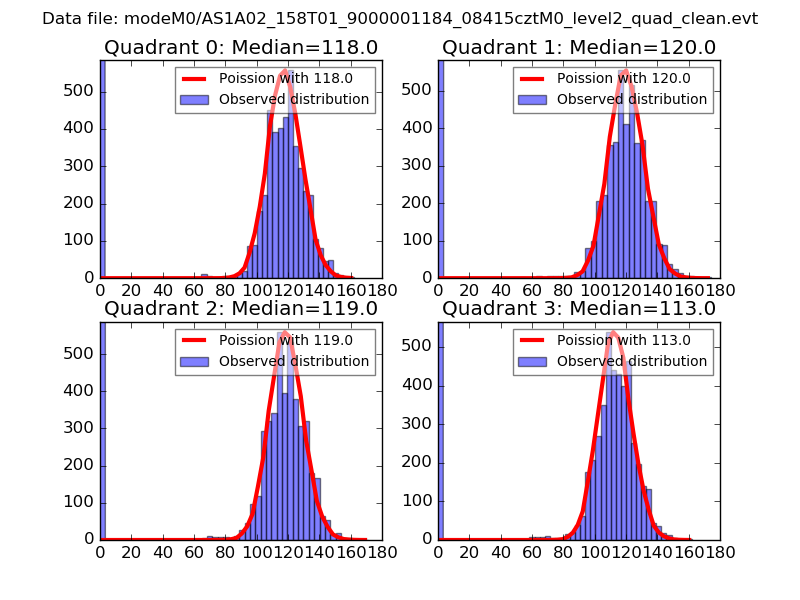 |
 |
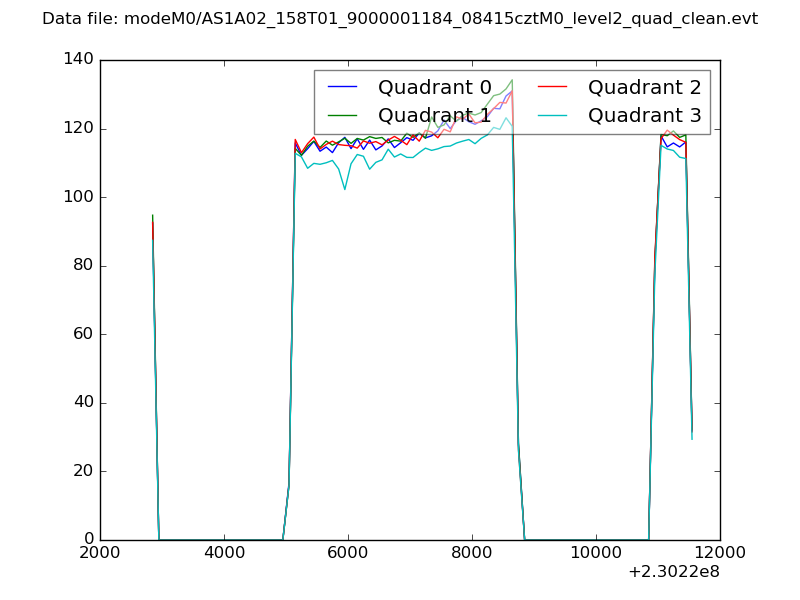
| Quadrant-wise count rates Data is divided into 100 sec bins |
 |
|
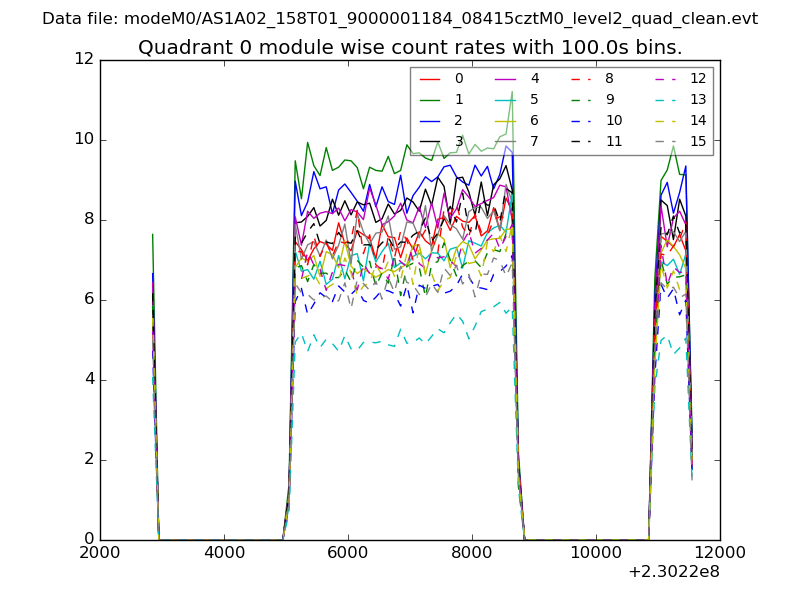
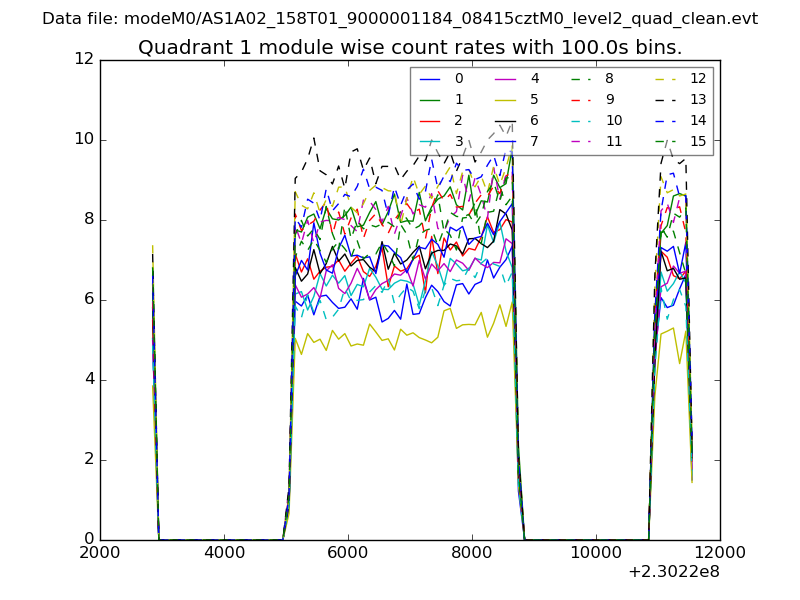
| Module-wise count rates for Quadrant A Data is divided into 100 sec bins |
 |
 |
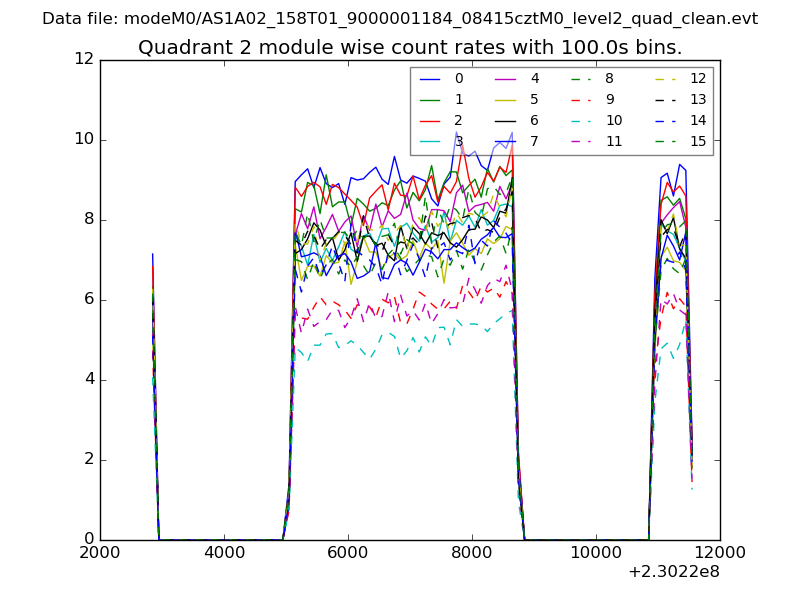
| Module-wise count rates for Quadrant B Data is divided into 100 sec bins |
 |
 |
| Module-wise count rates for Quadrant C Data is divided into 100 sec bins |
 |
 |
| Module-wise count rates for Quadrant D Data is divided into 100 sec bins |
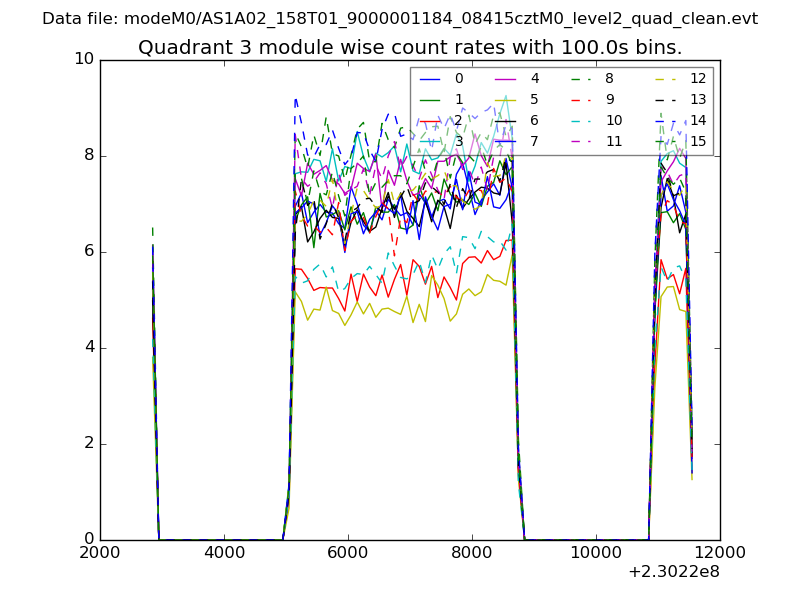 |
 |
| Parameter | Plot |
|---|---|
| CZT HV Monitor | 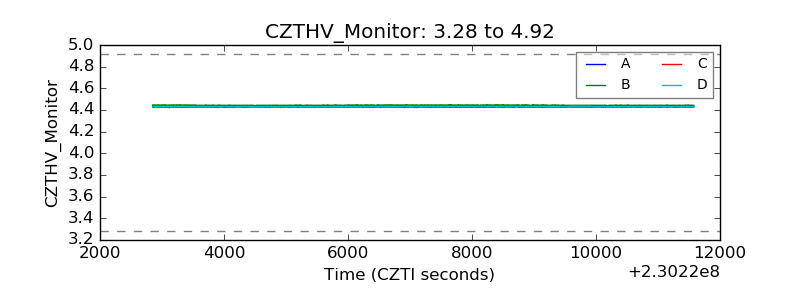 |
| D_VDD | 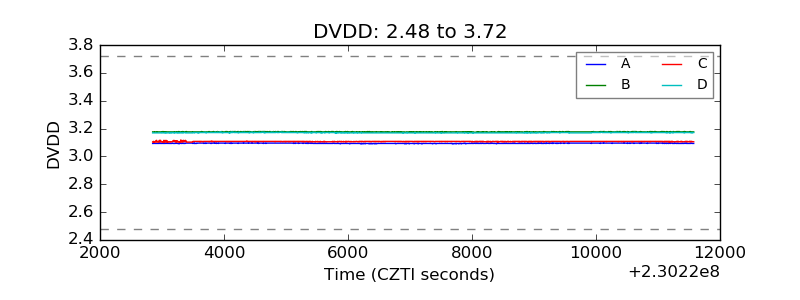 |
| Temperature 1 | 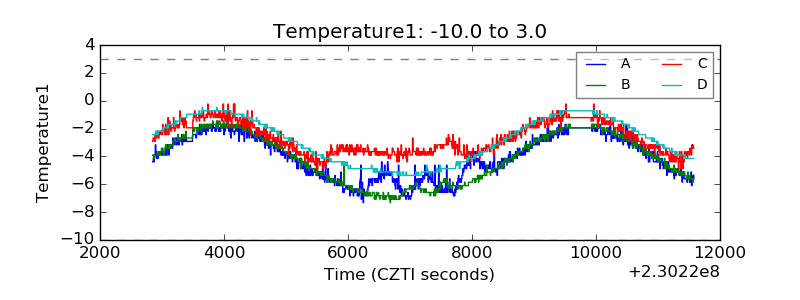 |
| Veto HV Monitor | 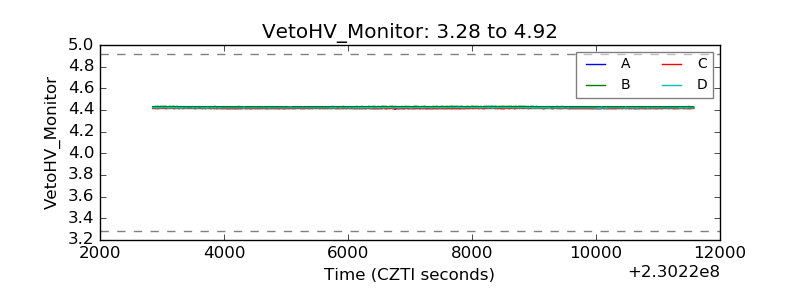 |
| Veto LLD | 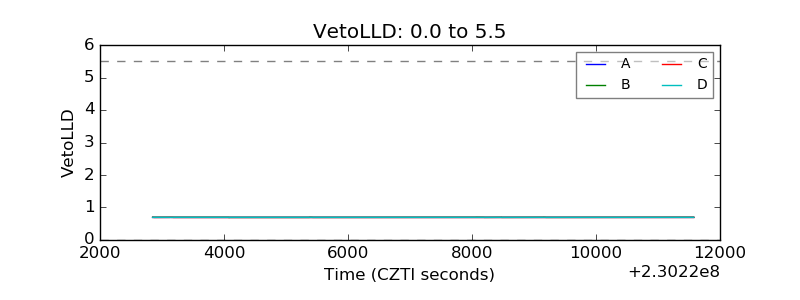 |
| Alpha Counter | 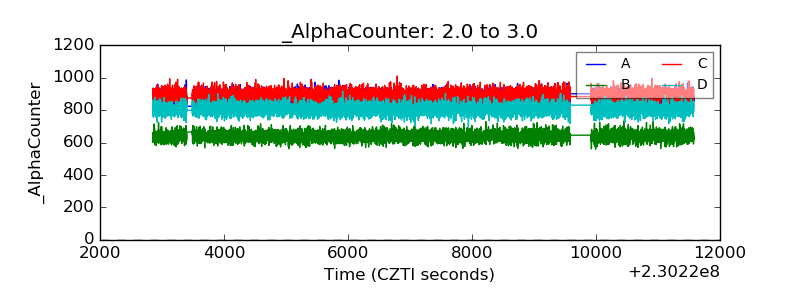 |
| _CPM_Rate | 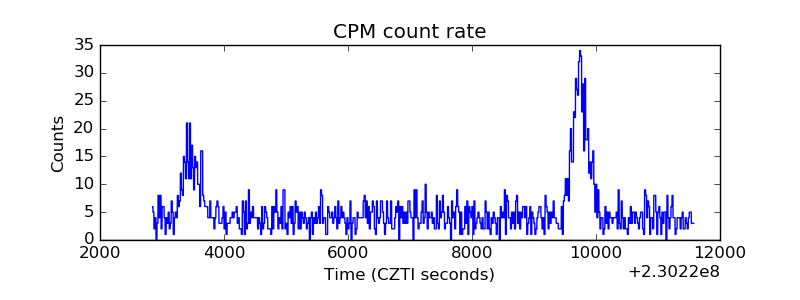 |
| CZT Counter | 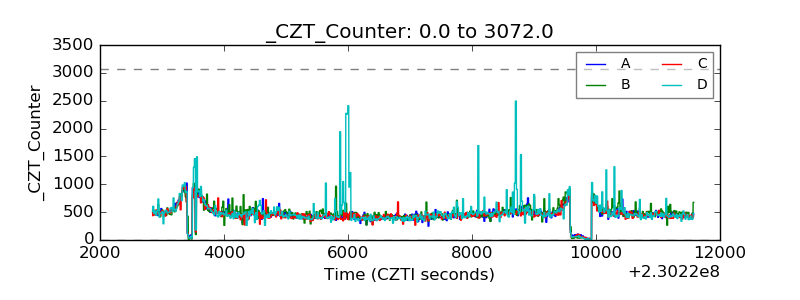 |
| +2.5 Volts monitor |  |
| +5 Volts monitor |  |
| _ROLL_ROT | 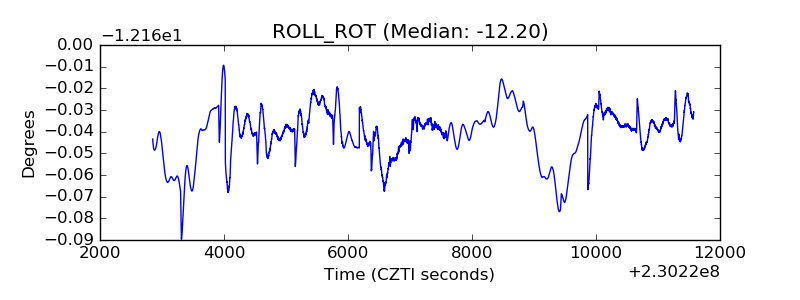 |
| _Roll_DEC | 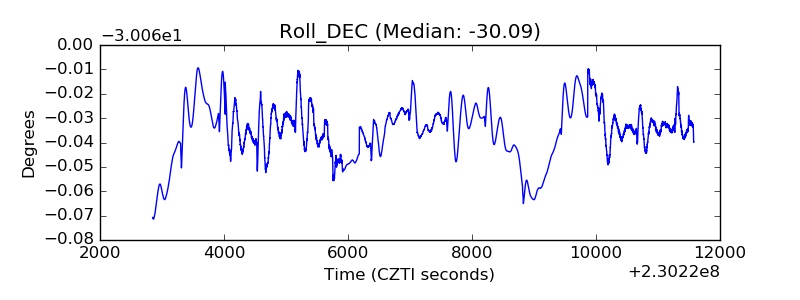 |
| _Roll_RA | 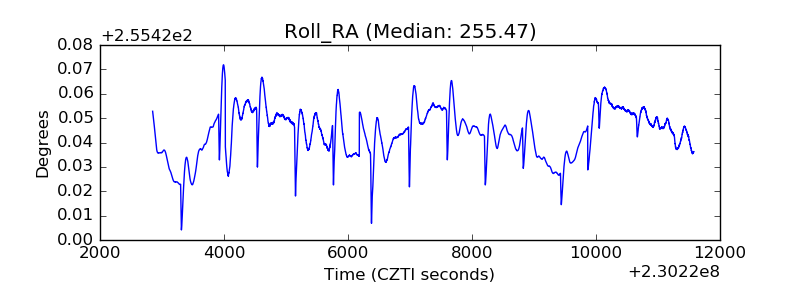 |
| Veto Counter | 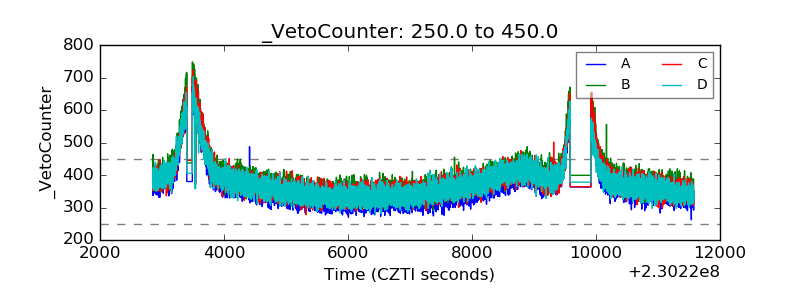 |