| Param | Original file | Final file |
|---|---|---|
| Filename | modeM0/AS1A02_158T01_9000001184_08417cztM0_level2.evt | modeM0/AS1A02_158T01_9000001184_08417cztM0_level2_quad_clean.evt |
| Size (bytes) | 718,876,800 | 136,454,400 |
| Size | 685.6 MB | 130.1 MB |
| Events in quadrant A | 5,174,819 | 844,122 |
| Events in quadrant B | 5,407,362 | 861,299 |
| Events in quadrant C | 4,977,069 | 847,819 |
| Events in quadrant D | 5,458,559 | 810,186 |
| Mode SS | |||
|---|---|---|---|
| Quadrant | BADHDUFLAG | Total packets | Discarded packets |
| A | 0 | 226 | 0 |
| B | 0 | 226 | 0 |
| C | 0 | 226 | 0 |
| D | 0 | 226 | 0 |
| Mode M9 | |||
|---|---|---|---|
| Quadrant | BADHDUFLAG | Total packets | Discarded packets |
| A | 0 | 10 | 0 |
| B | 0 | 9 | 0 |
| C | 0 | 9 | 0 |
| D | 0 | 9 | 0 |
| Mode M0 | |||
|---|---|---|---|
| Quadrant | BADHDUFLAG | Total packets | Discarded packets |
| A | 0 | 22941 | 1 |
| B | 0 | 23464 | 3 |
| C | 0 | 22506 | 1 |
| D | 0 | 24243 | 1 |
| Quadrant | Total seconds | Saturated seconds | Saturation percentage |
|---|---|---|---|
| A | 11114 | 94 | 0.845780% |
| B | 11113 | 55 | 0.494916% |
| C | 11114 | 21 | 0.188951% |
| D | 11114 | 132 | 1.187691% |
Noise dominated data is calculated using 1-second bins in cleaned event files. If a bin has >2000 counts, and if more than 50% of those come from <1% of pixels, then it is considered to be noise-dominated and hence unusable.
| Quadrant | # 1 sec bins | Bins with >0 counts | Bins with >2000 counts | High rate bins dominated by noise | Noise dominated (total time) | Noise dominated (detector-on time) | Marked lightcurve |
|---|---|---|---|---|---|---|---|
| A | 11644 | 11115 | 10 | 10 | 0.09% | 0.09% |  |
| B | 11644 | 11115 | 1 | 1 | 0.01% | 0.01% |  |
| C | 11644 | 11115 | 2 | 2 | 0.02% | 0.02% | 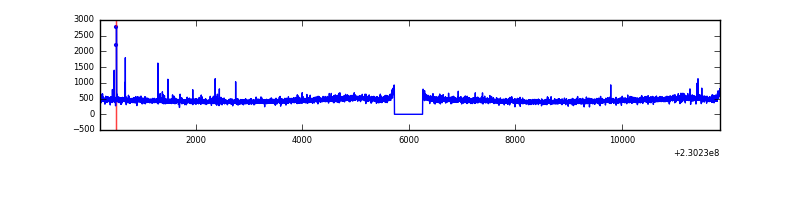 |
| D | 11644 | 11115 | 80 | 80 | 0.69% | 0.72% |  |
Top three noisy pixels from each quadrant. If the there are fewer than three noisy pixels in the level2.evt file, extra rows are filled as -1
| Pixel properties | Quadrant properties | ||||||
|---|---|---|---|---|---|---|---|
| Quadrant | DetID | PixID | Counts | Sigma | Mean | Median | Sigma |
| A | 5 | 16 | 70966 | 265.25 | 1289 | 1260 | 262.8 |
| A | 14 | 111 | 60562 | 225.66 | 1289 | 1260 | 262.8 |
| A | 15 | 236 | 42508 | 156.96 | 1289 | 1260 | 262.8 |
| B | 0 | 214 | 163212 | 653.02 | 1299 | 1267 | 248.0 |
| B | 4 | 81 | 88365 | 351.21 | 1299 | 1267 | 248.0 |
| B | 5 | 255 | 57149 | 225.34 | 1299 | 1267 | 248.0 |
| C | 1 | 16 | 38354 | 126.13 | 1260 | 1266 | 294.1 |
| C | 8 | 128 | 12729 | 38.98 | 1260 | 1266 | 294.1 |
| C | 13 | 61 | 9579 | 28.27 | 1260 | 1266 | 294.1 |
| D | 4 | 95 | 370066 | 1192.8 | 1251 | 1212 | 309.2 |
| D | 1 | 52 | 69239 | 219.99 | 1251 | 1212 | 309.2 |
| D | 12 | 221 | 66323 | 210.56 | 1251 | 1212 | 309.2 |
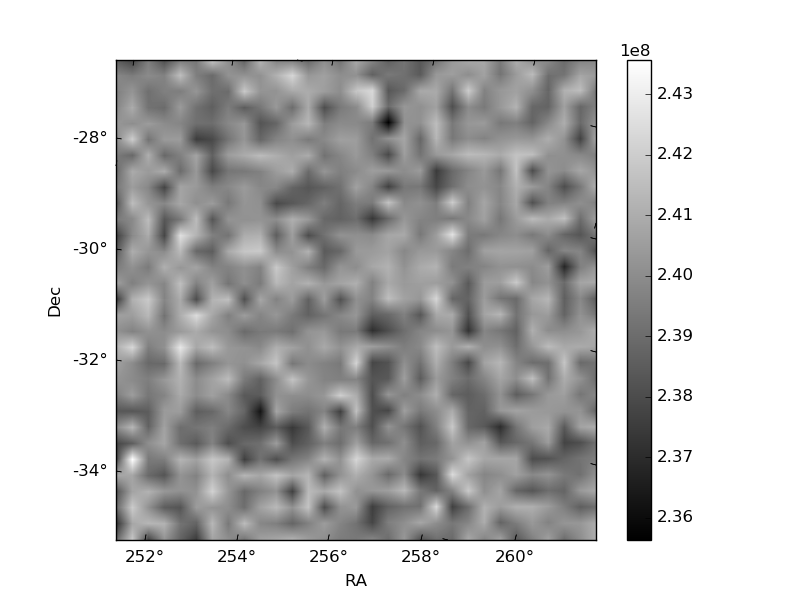
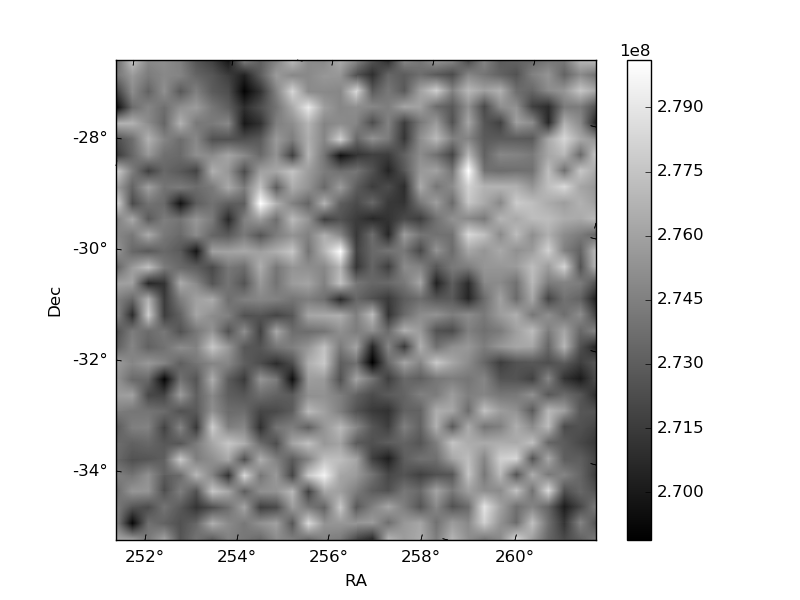
Histogram calculated using DETX and DETY for each event in the final _common_clean file
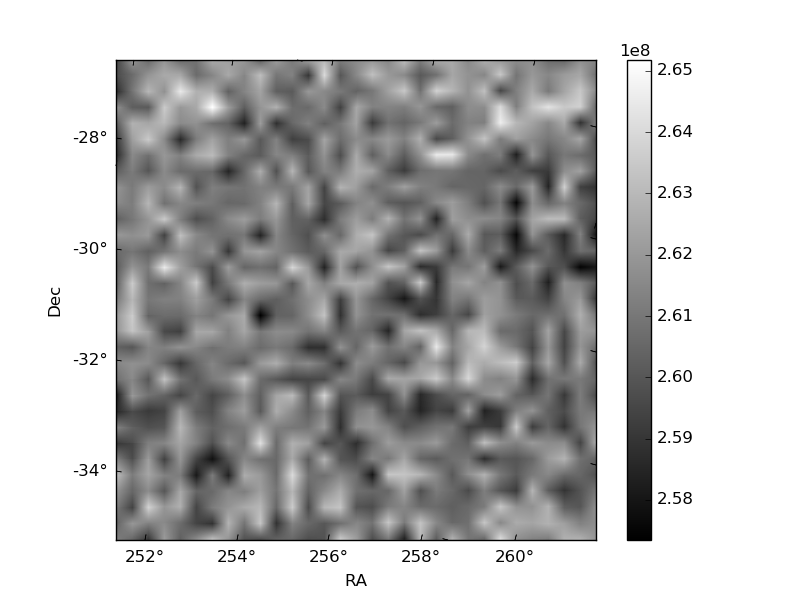
| Quadrant A | 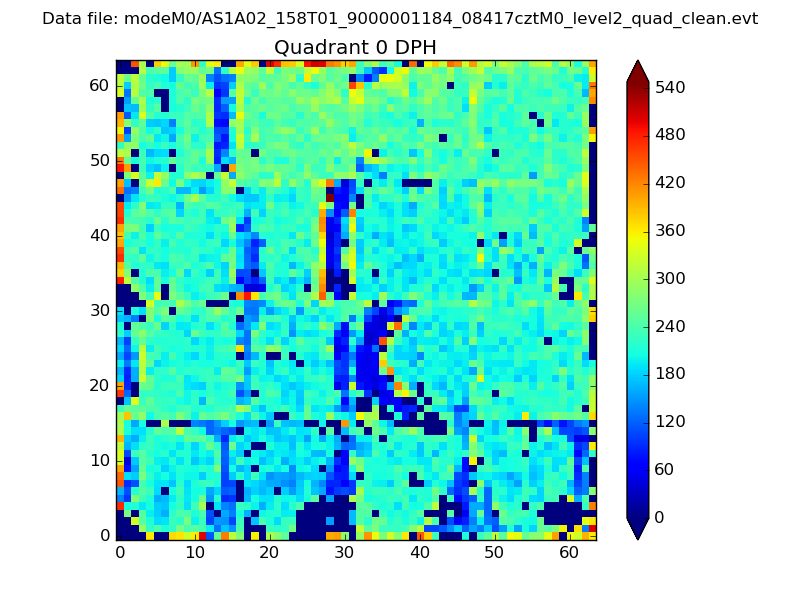 |
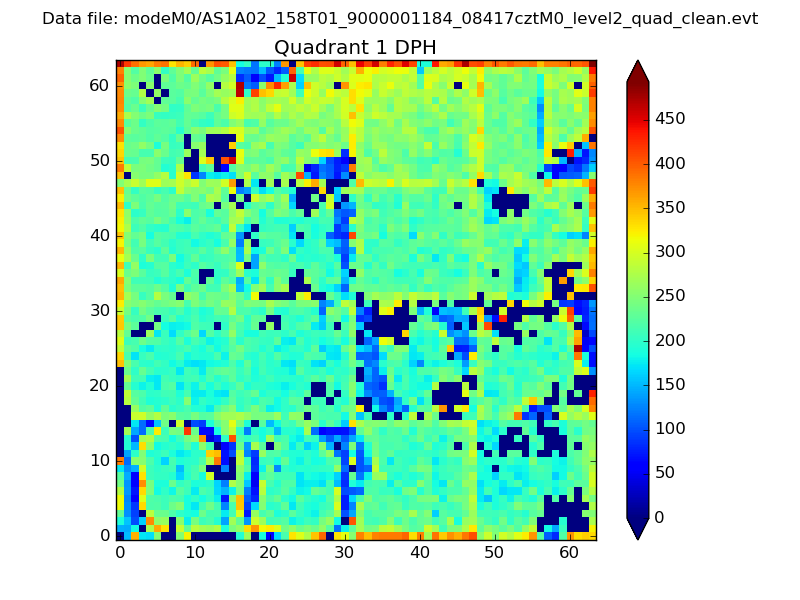 |
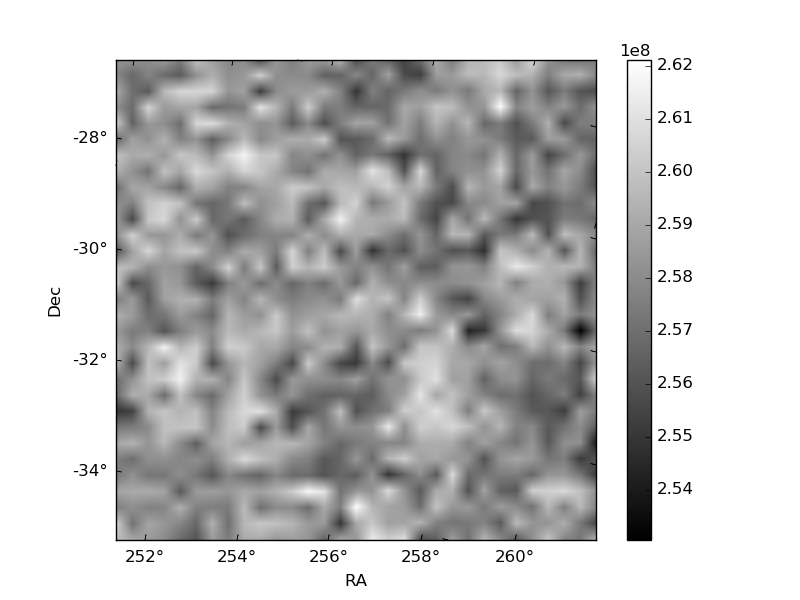
Quadrant B |
|---|---|---|---|
| Quadrant D | 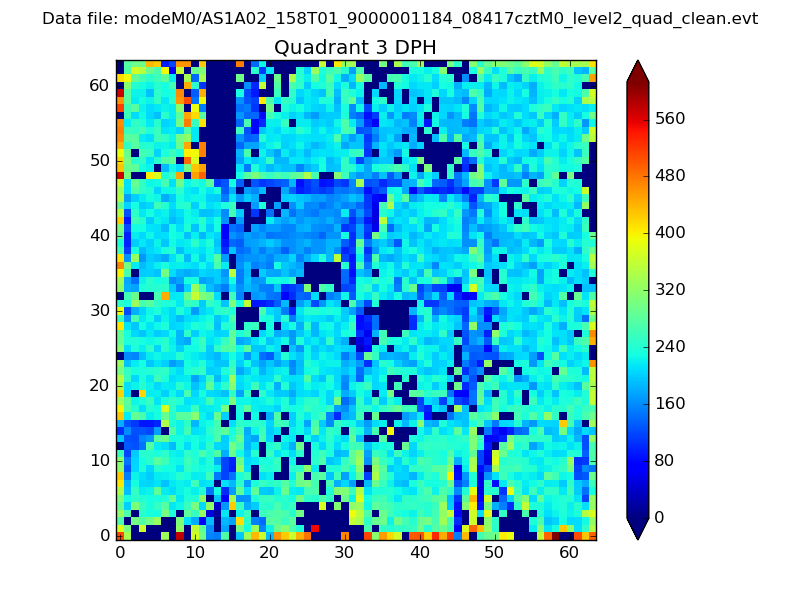 |
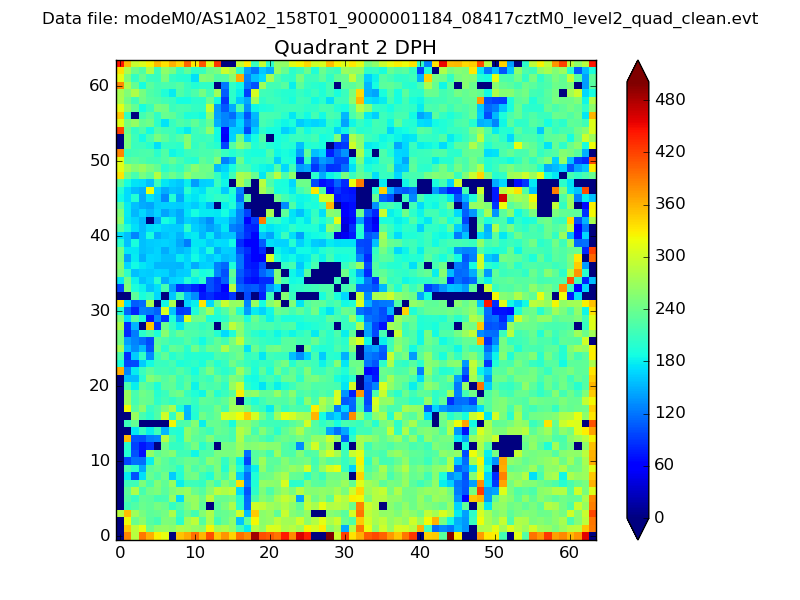 |
Quadrant C |
| Plot type | Count rate plots | Images |
|---|---|---|
| Comparison with Poisson distribution Blue bars denote a histogram of data divided into 1 sec bins. Red curve is a Poisson curve with rate = median count rate of data. |
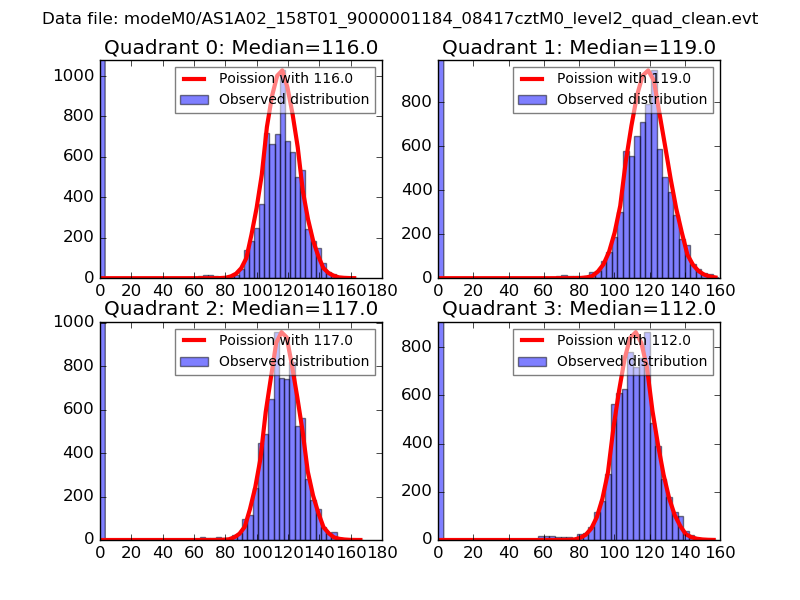 |
 |
| Quadrant-wise count rates Data is divided into 100 sec bins |
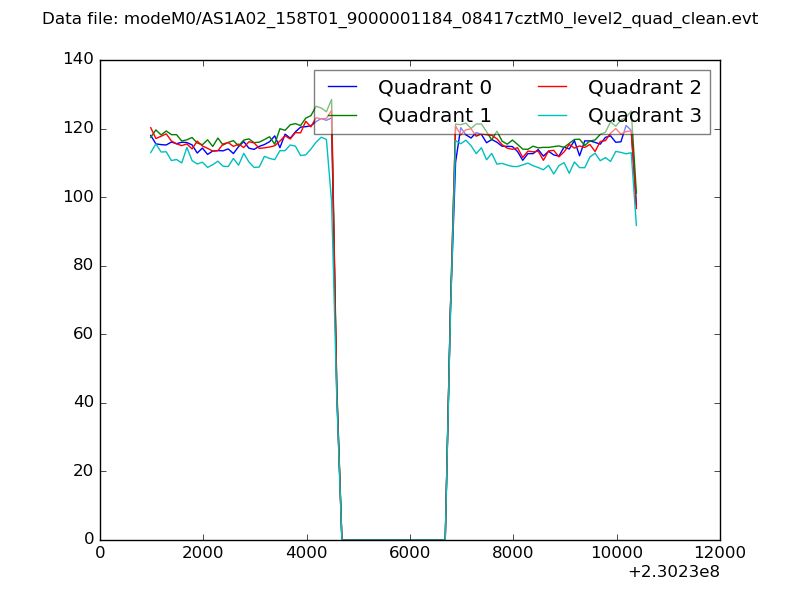 |
|
| Module-wise count rates for Quadrant A Data is divided into 100 sec bins |
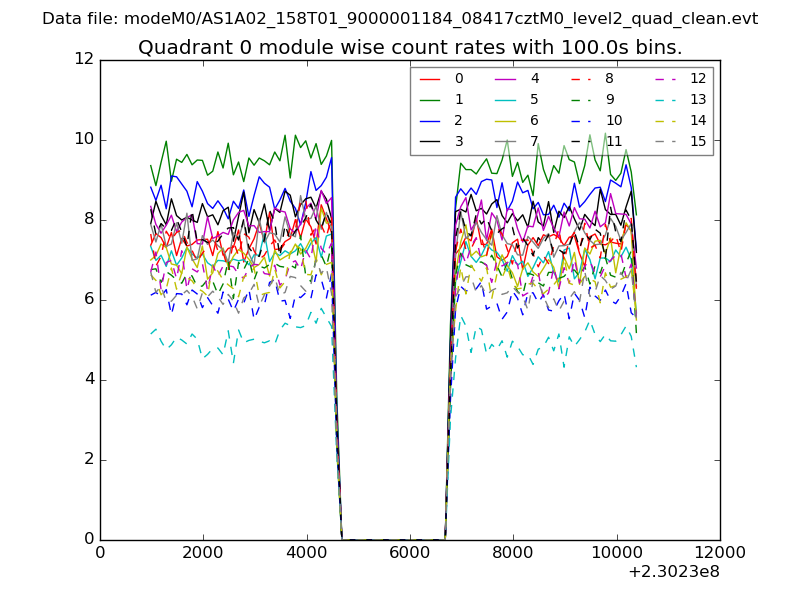 |
 |
| Module-wise count rates for Quadrant B Data is divided into 100 sec bins |
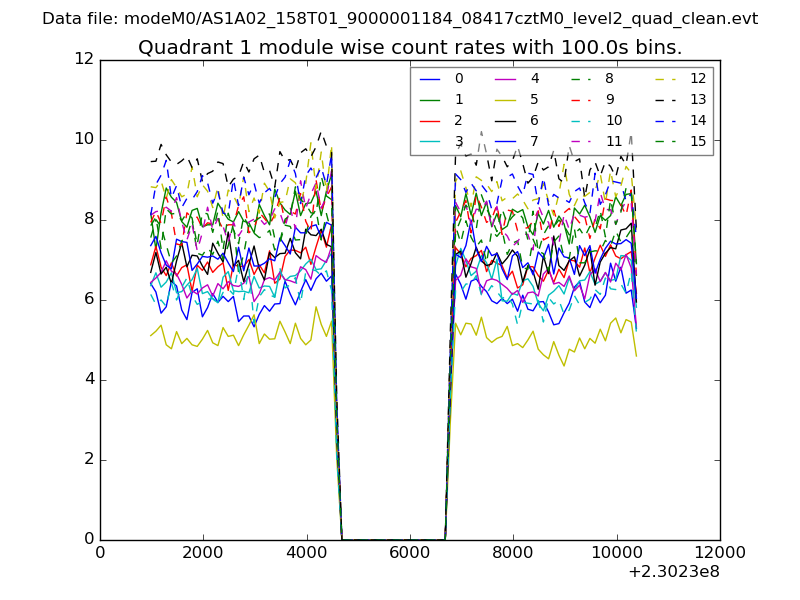 |
 |
| Module-wise count rates for Quadrant C Data is divided into 100 sec bins |
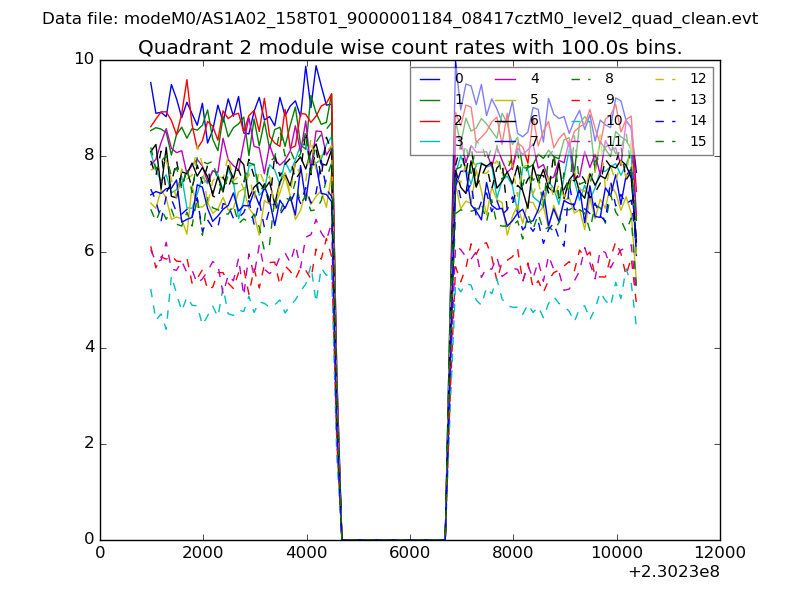 |
 |
| Module-wise count rates for Quadrant D Data is divided into 100 sec bins |
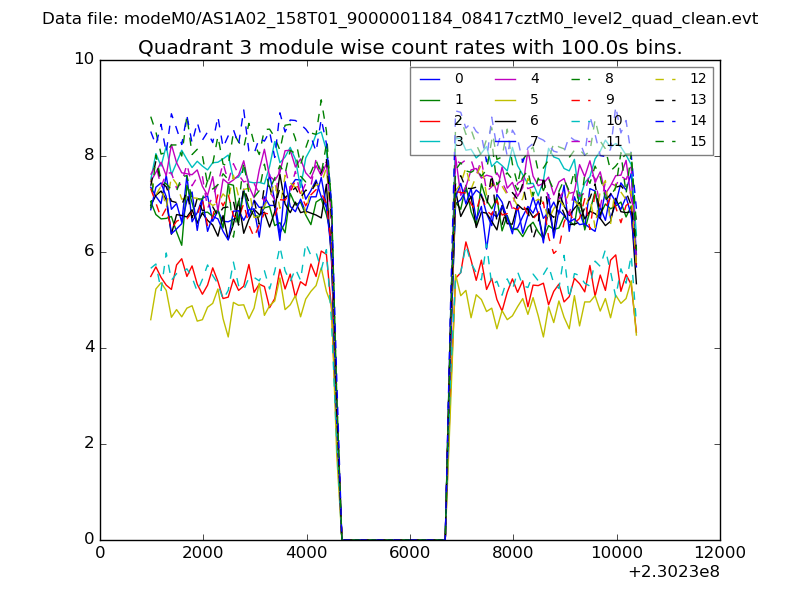 |
 |
| Parameter | Plot |
|---|---|
| CZT HV Monitor | 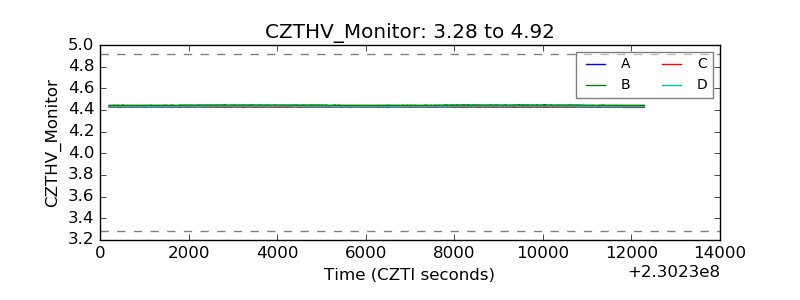 |
| D_VDD | 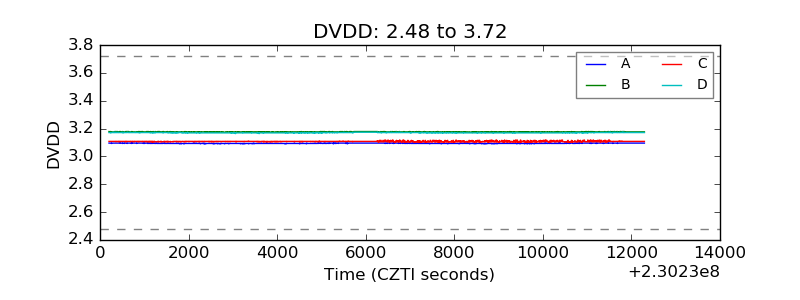 |
| Temperature 1 | 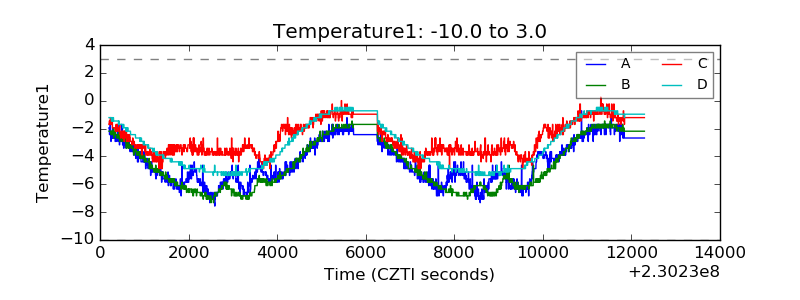 |
| Veto HV Monitor | 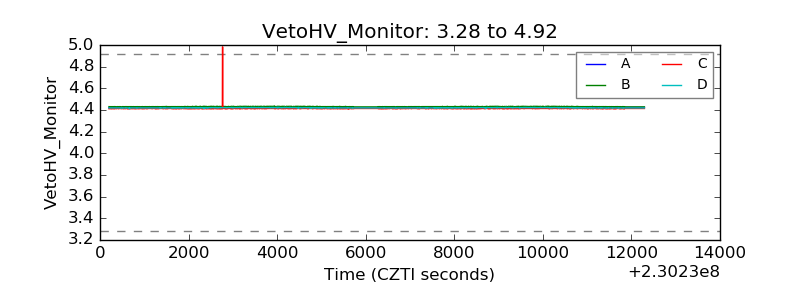 |
| Veto LLD | 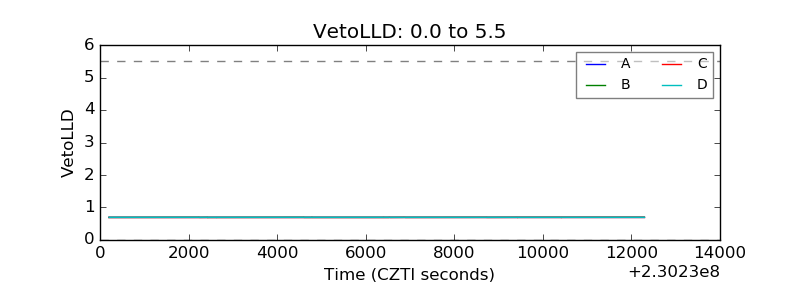 |
| Alpha Counter | 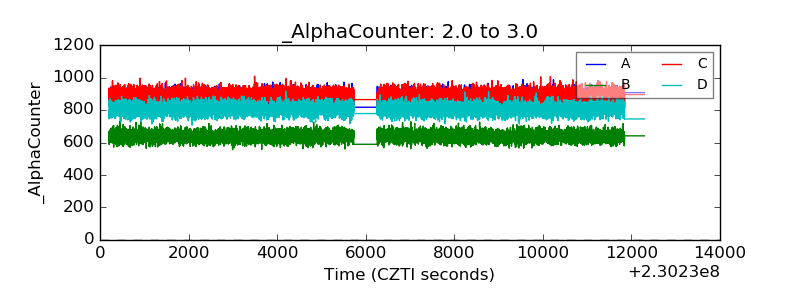 |
| _CPM_Rate | 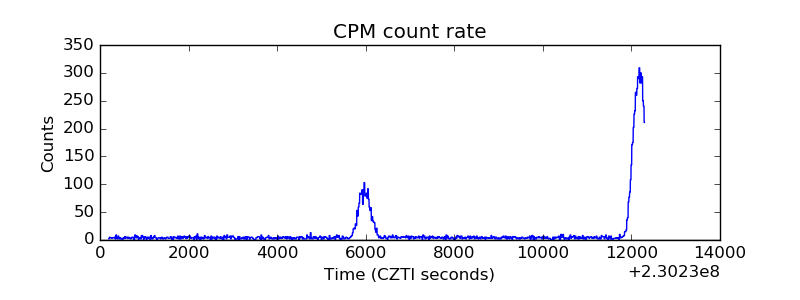 |
| CZT Counter | 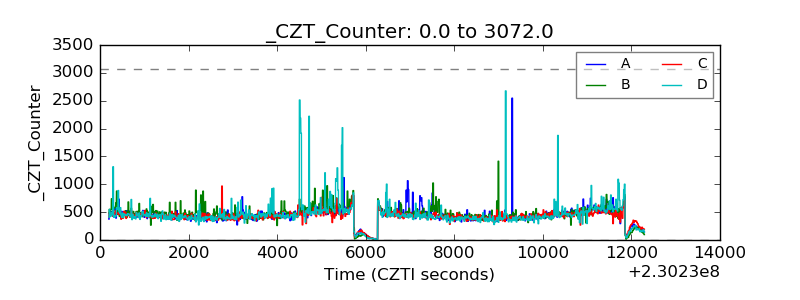 |
| +2.5 Volts monitor |  |
| +5 Volts monitor | 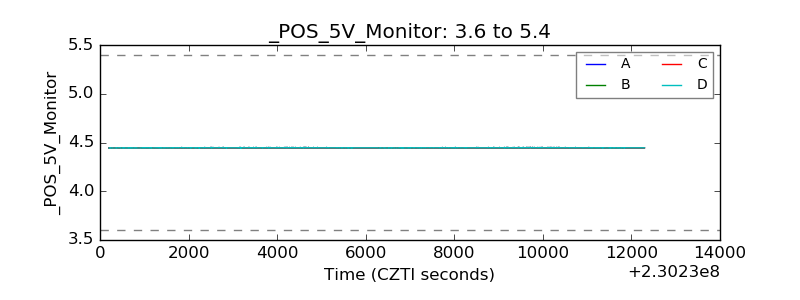 |
| _ROLL_ROT | 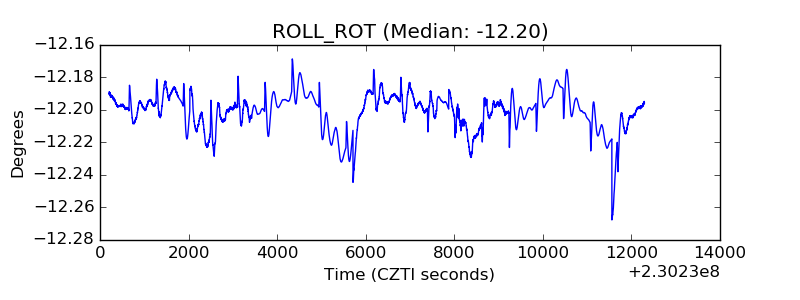 |
| _Roll_DEC | 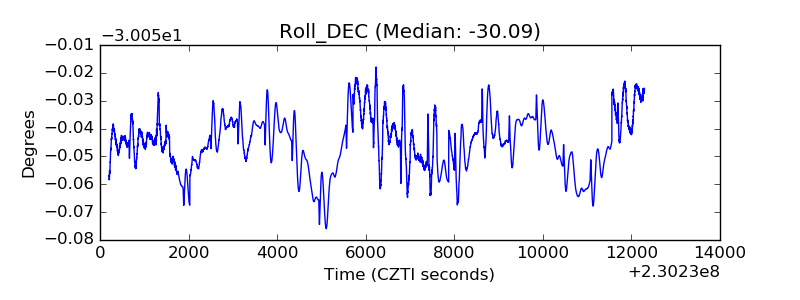 |
| _Roll_RA | 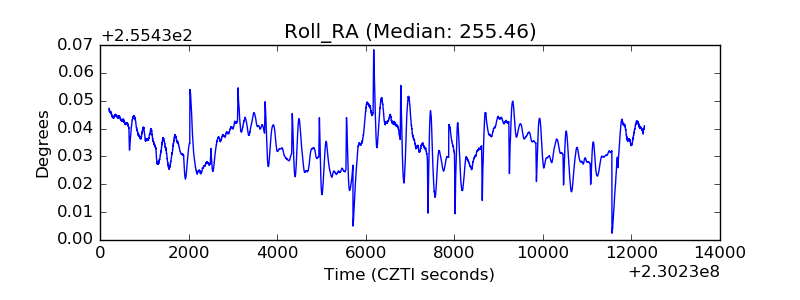 |
| Veto Counter | 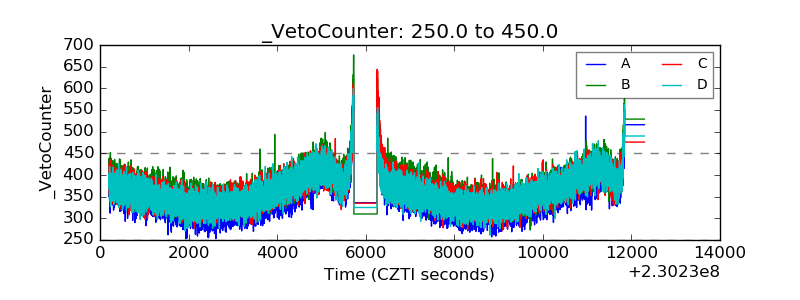 |