| Param | Original file | Final file |
|---|---|---|
| Filename | modeM0/AS1A02_158T01_9000001184_08418cztM0_level2.evt | modeM0/AS1A02_158T01_9000001184_08418cztM0_level2_quad_clean.evt |
| Size (bytes) | 464,382,720 | 92,983,680 |
| Size | 442.9 MB | 88.7 MB |
| Events in quadrant A | 3,152,860 | 589,428 |
| Events in quadrant B | 3,276,924 | 604,941 |
| Events in quadrant C | 3,108,305 | 594,408 |
| Events in quadrant D | 4,068,638 | 558,230 |
| Mode SS | |||
|---|---|---|---|
| Quadrant | BADHDUFLAG | Total packets | Discarded packets |
| A | 0 | 138 | 0 |
| B | 0 | 138 | 0 |
| C | 0 | 138 | 0 |
| D | 0 | 138 | 0 |
| Mode M9 | |||
|---|---|---|---|
| Quadrant | BADHDUFLAG | Total packets | Discarded packets |
| A | 0 | 12 | 0 |
| B | 0 | 12 | 0 |
| C | 0 | 12 | 0 |
| D | 0 | 13 | 0 |
| Mode M0 | |||
|---|---|---|---|
| Quadrant | BADHDUFLAG | Total packets | Discarded packets |
| A | 0 | 13899 | 3 |
| B | 0 | 14197 | 2 |
| C | 0 | 13805 | 4 |
| D | 0 | 16705 | 2 |
| Quadrant | Total seconds | Saturated seconds | Saturation percentage |
|---|---|---|---|
| A | 6723 | 18 | 0.267738% |
| B | 6723 | 36 | 0.535475% |
| C | 6722 | 27 | 0.401666% |
| D | 6723 | 175 | 2.603005% |
Noise dominated data is calculated using 1-second bins in cleaned event files. If a bin has >2000 counts, and if more than 50% of those come from <1% of pixels, then it is considered to be noise-dominated and hence unusable.
| Quadrant | # 1 sec bins | Bins with >0 counts | Bins with >2000 counts | High rate bins dominated by noise | Noise dominated (total time) | Noise dominated (detector-on time) | Marked lightcurve |
|---|---|---|---|---|---|---|---|
| A | 7618 | 6724 | 1 | 1 | 0.01% | 0.01% |  |
| B | 7618 | 6724 | 1 | 1 | 0.01% | 0.01% |  |
| C | 7618 | 6724 | 10 | 10 | 0.13% | 0.15% |  |
| D | 7618 | 6724 | 163 | 163 | 2.14% | 2.42% | 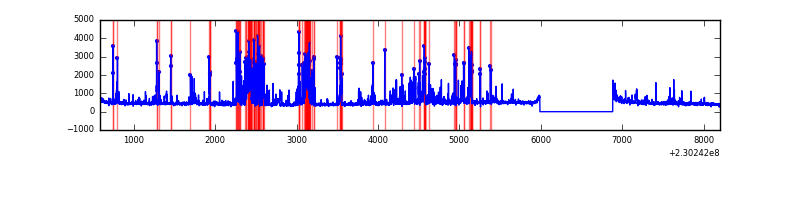 |
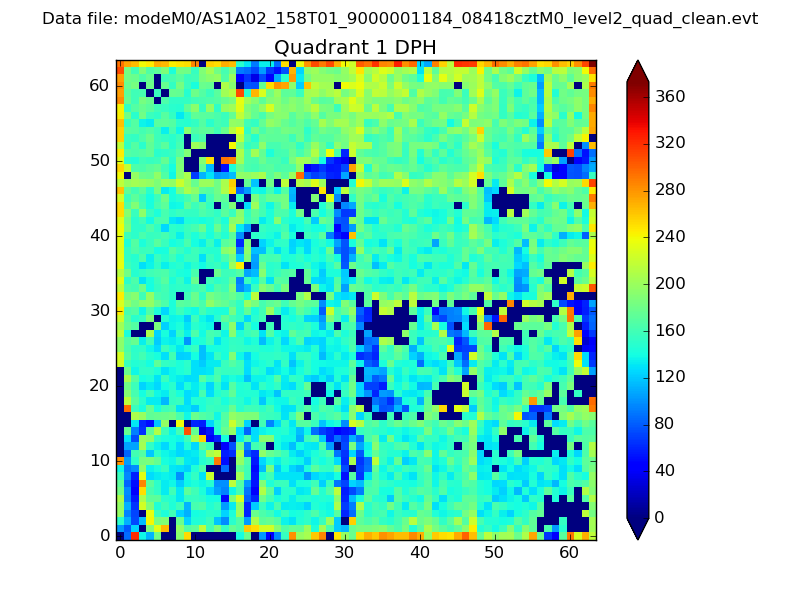
Top three noisy pixels from each quadrant. If the there are fewer than three noisy pixels in the level2.evt file, extra rows are filled as -1
| Pixel properties | Quadrant properties | ||||||
|---|---|---|---|---|---|---|---|
| Quadrant | DetID | PixID | Counts | Sigma | Mean | Median | Sigma |
| A | 5 | 16 | 75141 | 451.56 | 791 | 771 | 164.7 |
| A | 13 | 14 | 15036 | 86.61 | 791 | 771 | 164.7 |
| A | 13 | 251 | 12499 | 71.21 | 791 | 771 | 164.7 |
| B | 0 | 214 | 93334 | 603.54 | 798 | 777 | 153.4 |
| B | 4 | 81 | 32861 | 209.21 | 798 | 777 | 153.4 |
| B | 5 | 255 | 17143 | 106.72 | 798 | 777 | 153.4 |
| C | 1 | 16 | 85544 | 467.93 | 775 | 776 | 181.2 |
| C | 13 | 61 | 5909 | 28.33 | 775 | 776 | 181.2 |
| C | 3 | 202 | 1998 | 6.75 | 775 | 776 | 181.2 |
| D | 12 | 227 | 738027 | 3962.23 | 761 | 738 | 186.1 |
| D | 1 | 52 | 207107 | 1109.04 | 761 | 738 | 186.1 |
| D | 14 | 34 | 85307 | 454.48 | 761 | 738 | 186.1 |
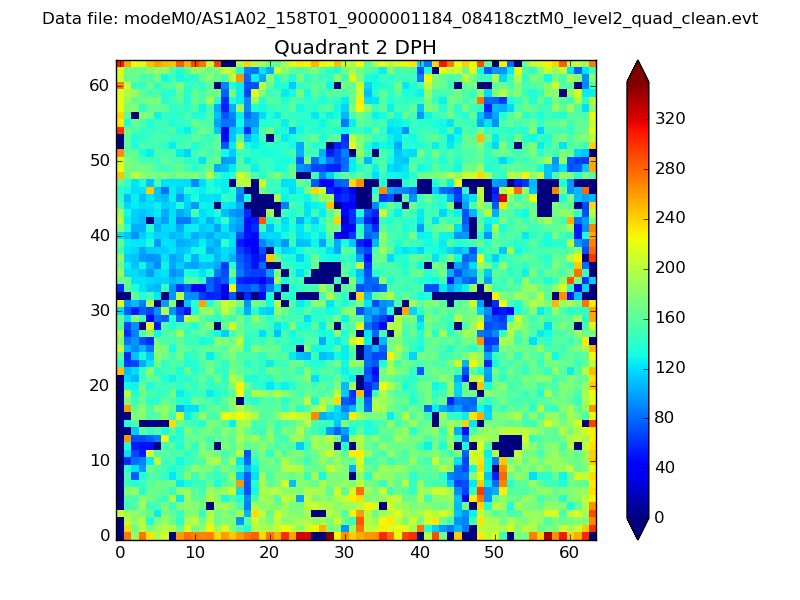
Histogram calculated using DETX and DETY for each event in the final _common_clean file
| Quadrant A | 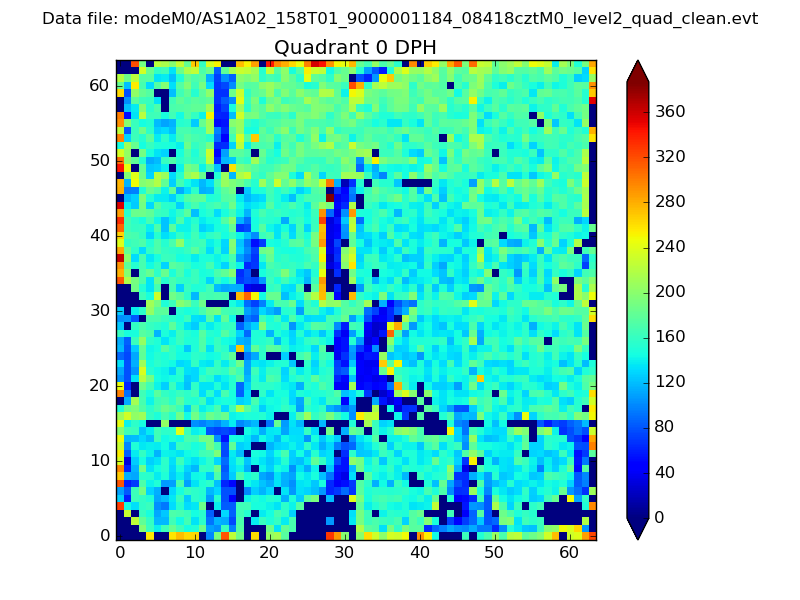 |
 |
Quadrant B |
|---|---|---|---|
| Quadrant D | 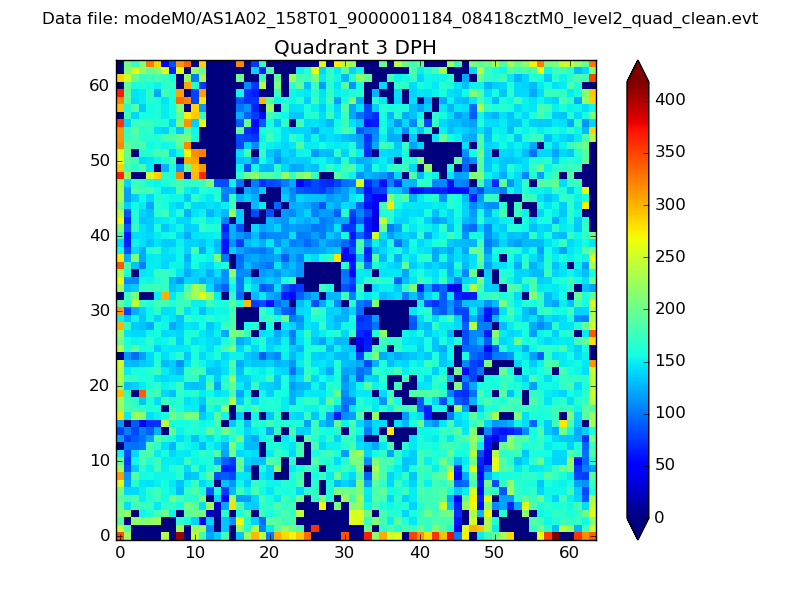 |
 |
Quadrant C |
| Plot type | Count rate plots | Images |
|---|---|---|
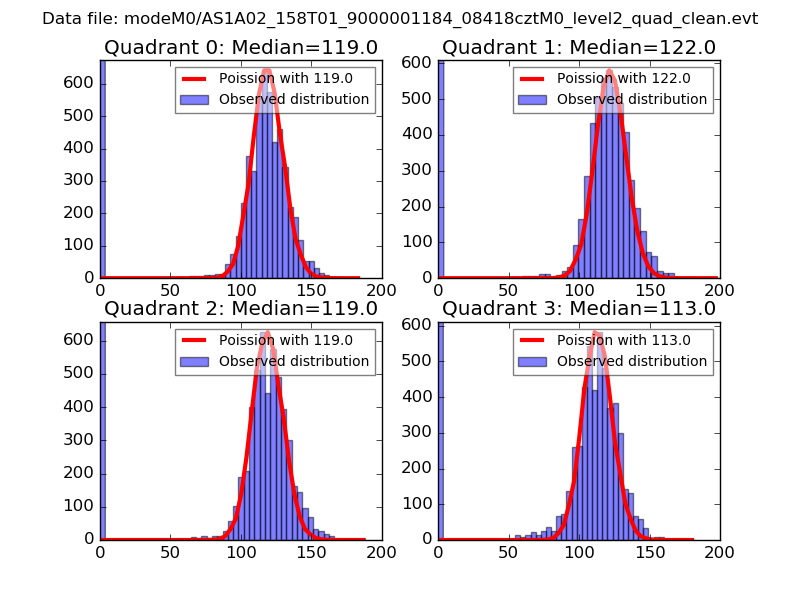
| Comparison with Poisson distribution Blue bars denote a histogram of data divided into 1 sec bins. Red curve is a Poisson curve with rate = median count rate of data. |
 |
 |
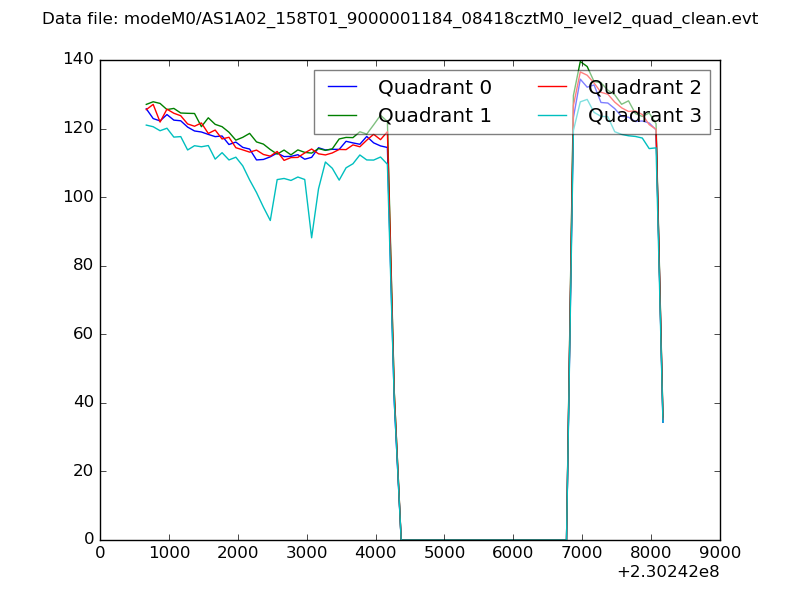
| Quadrant-wise count rates Data is divided into 100 sec bins |
 |
|
| Module-wise count rates for Quadrant A Data is divided into 100 sec bins |
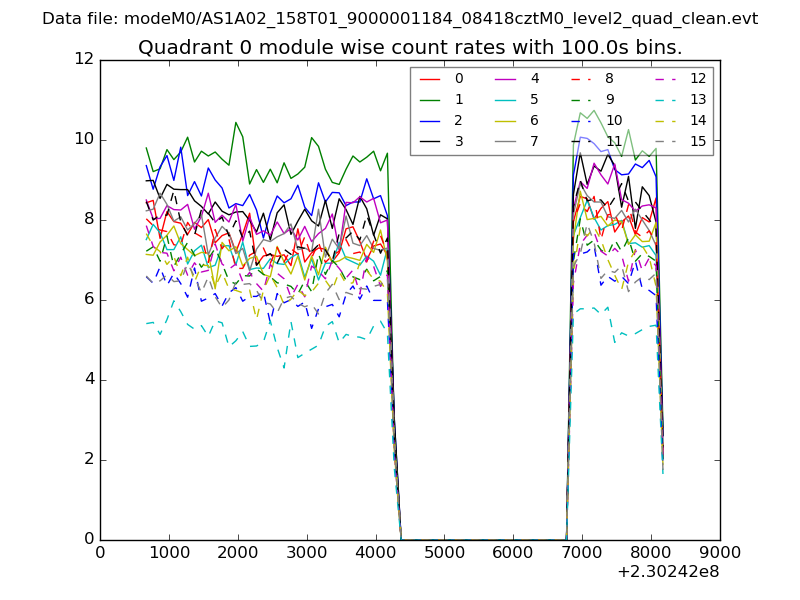 |
 |
| Module-wise count rates for Quadrant B Data is divided into 100 sec bins |
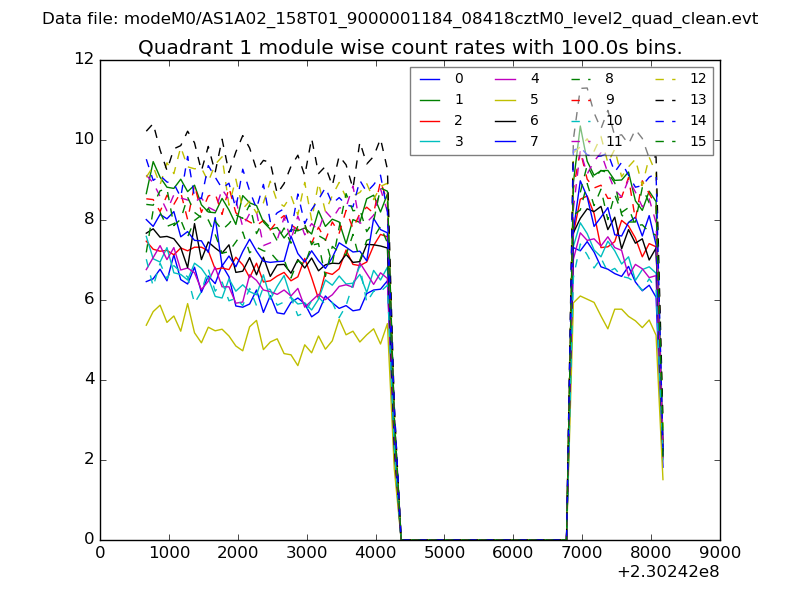 |
 |
| Module-wise count rates for Quadrant C Data is divided into 100 sec bins |
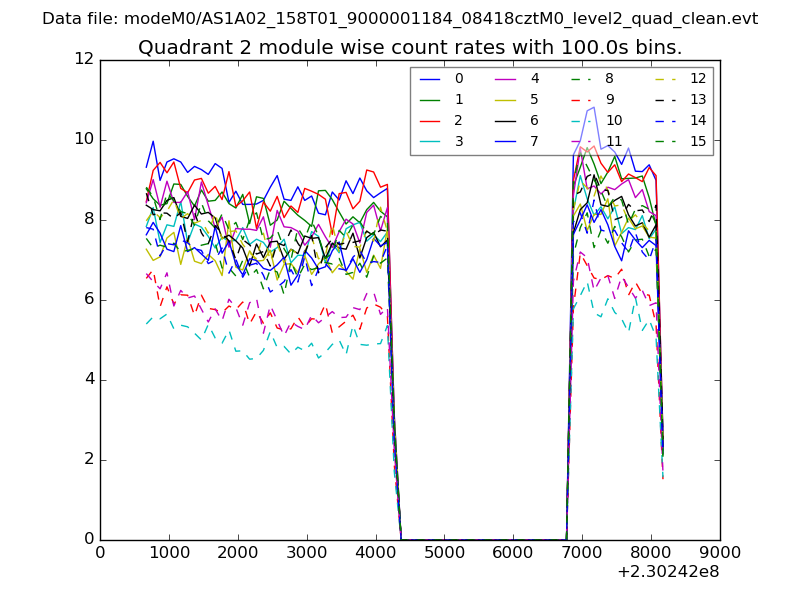 |
 |
| Module-wise count rates for Quadrant D Data is divided into 100 sec bins |
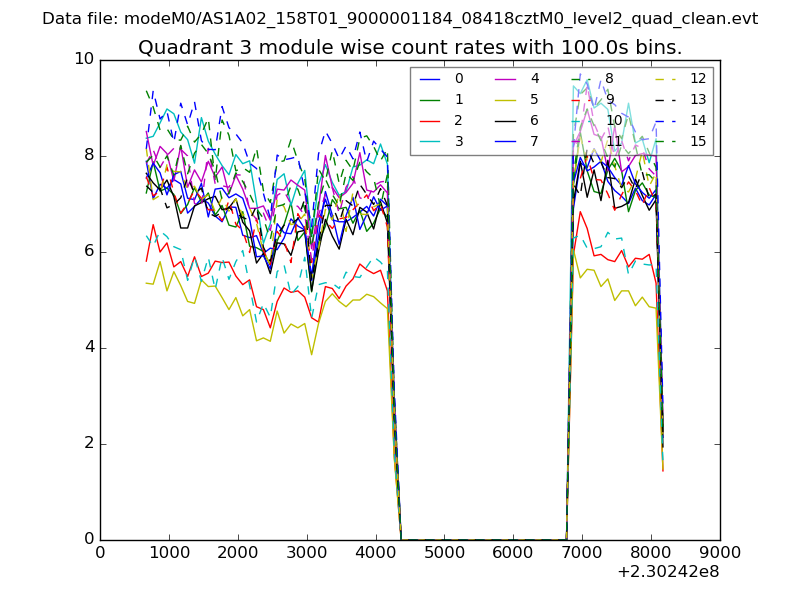 |
 |
| Parameter | Plot |
|---|---|
| CZT HV Monitor | 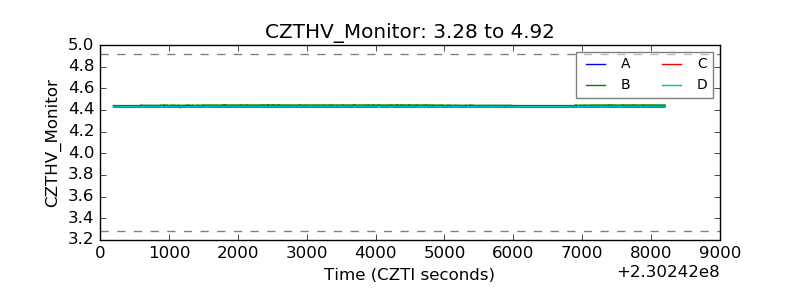 |
| D_VDD | 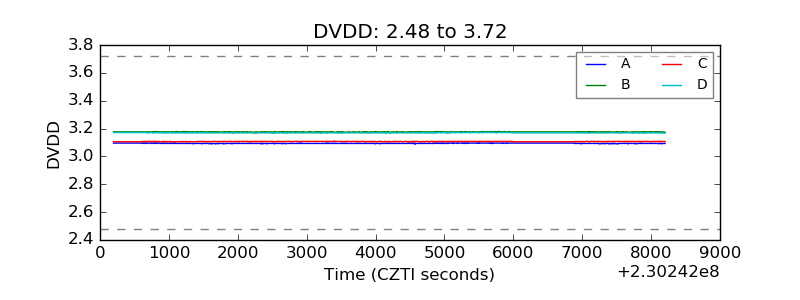 |
| Temperature 1 | 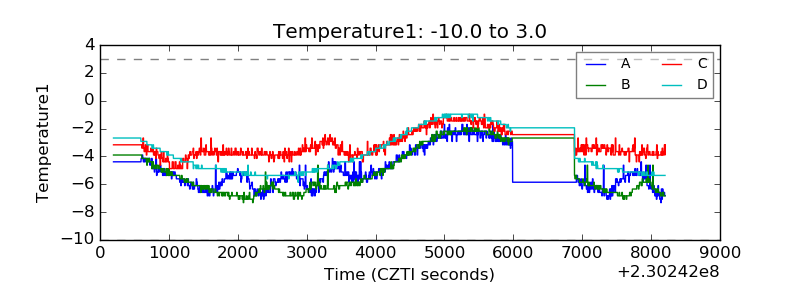 |
| Veto HV Monitor | 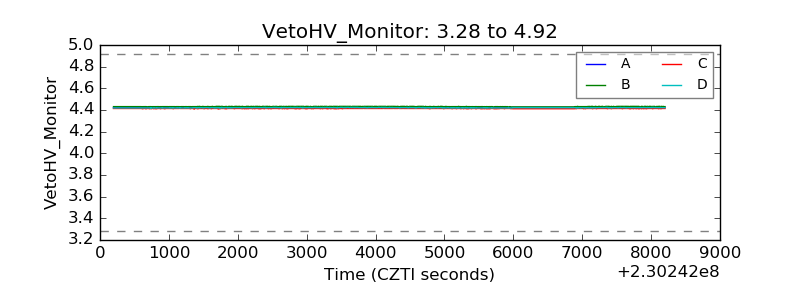 |
| Veto LLD | 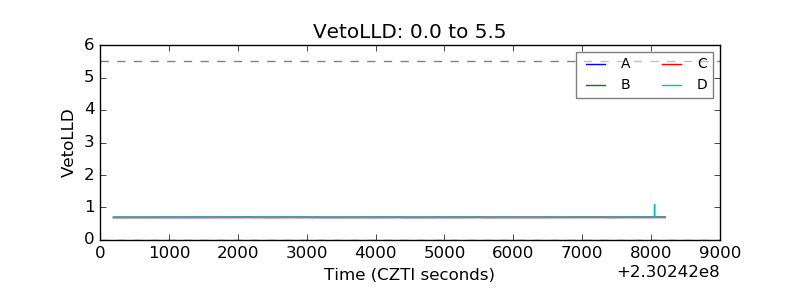 |
| Alpha Counter | 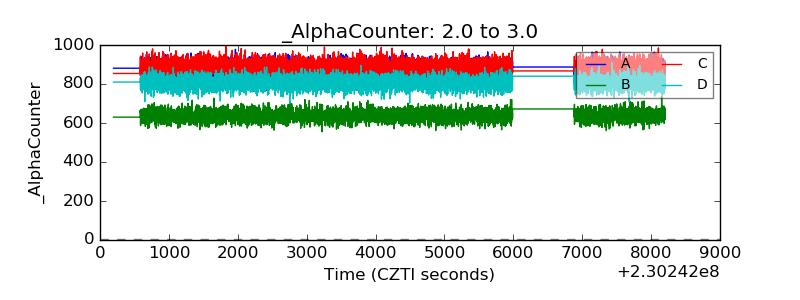 |
| _CPM_Rate | 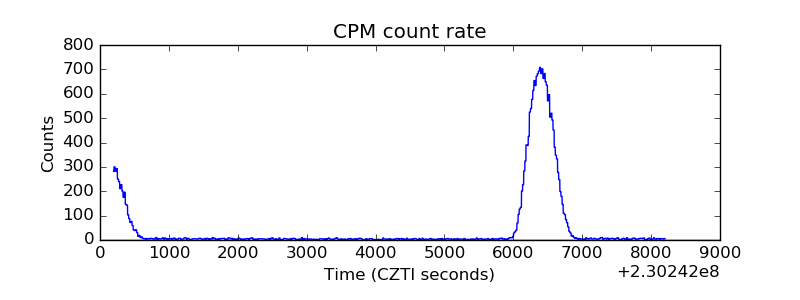 |
| CZT Counter | 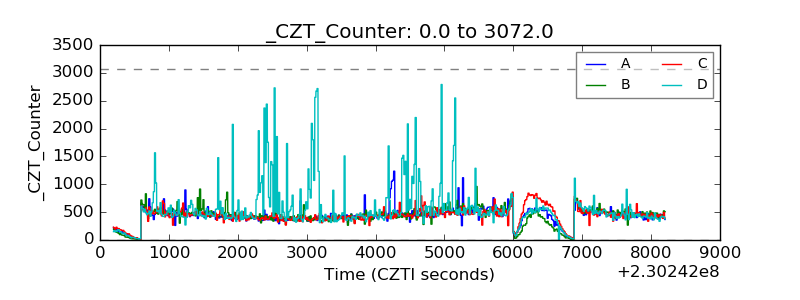 |
| +2.5 Volts monitor |  |
| +5 Volts monitor |  |
| _ROLL_ROT | 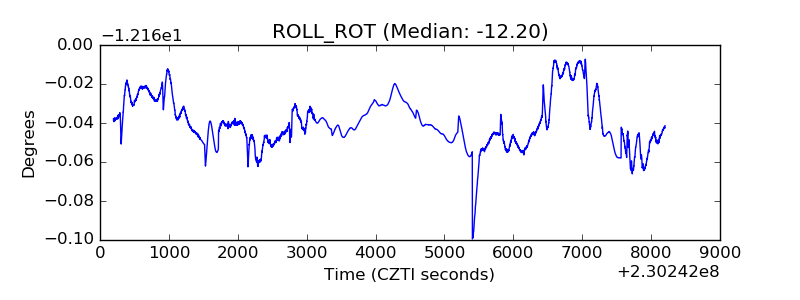 |
| _Roll_DEC | 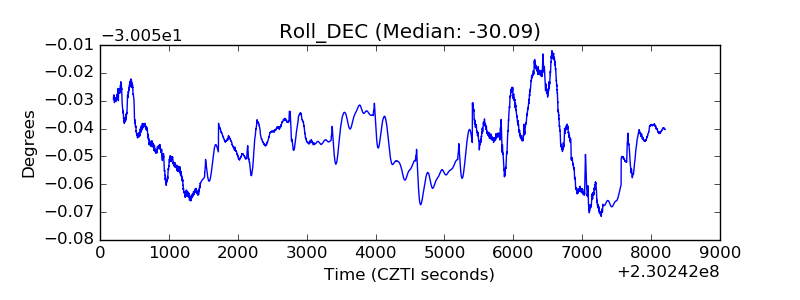 |
| _Roll_RA | 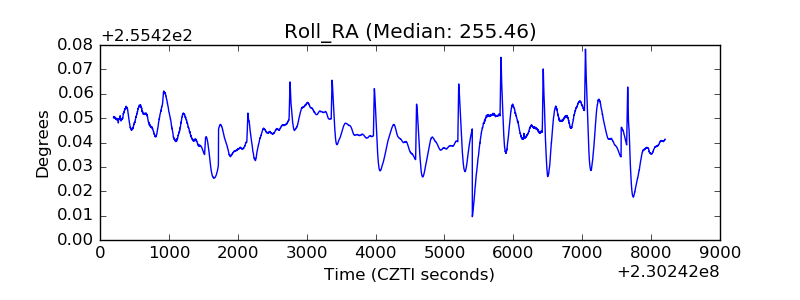 |
| Veto Counter | 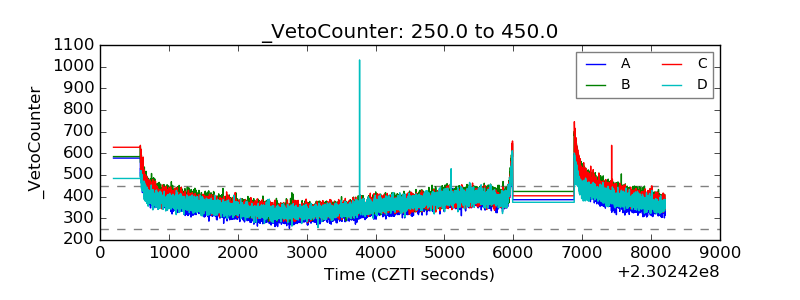 |