| Param | Original file | Final file |
|---|---|---|
| Filename | modeM0/AS1A02_158T01_9000001184_08419cztM0_level2.evt | modeM0/AS1A02_158T01_9000001184_08419cztM0_level2_quad_clean.evt |
| Size (bytes) | 184,633,920 | 46,321,920 |
| Size | 176.1 MB | 44.2 MB |
| Events in quadrant A | 1,322,235 | 299,014 |
| Events in quadrant B | 1,413,094 | 305,936 |
| Events in quadrant C | 1,314,728 | 302,076 |
| Events in quadrant D | 1,340,645 | 286,935 |
| Mode SS | |||
|---|---|---|---|
| Quadrant | BADHDUFLAG | Total packets | Discarded packets |
| A | 0 | 60 | 0 |
| B | 0 | 60 | 0 |
| C | 0 | 60 | 0 |
| D | 0 | 60 | 0 |
| Mode M9 | |||
|---|---|---|---|
| Quadrant | BADHDUFLAG | Total packets | Discarded packets |
| A | 0 | 9 | 0 |
| B | 0 | 9 | 0 |
| C | 0 | 9 | 0 |
| D | 0 | 9 | 0 |
| Mode M0 | |||
|---|---|---|---|
| Quadrant | BADHDUFLAG | Total packets | Discarded packets |
| A | 0 | 5997 | 1 |
| B | 0 | 6168 | 1 |
| C | 0 | 5939 | 1 |
| D | 0 | 6171 | 1 |
| Quadrant | Total seconds | Saturated seconds | Saturation percentage |
|---|---|---|---|
| A | 2923 | 11 | 0.376326% |
| B | 2923 | 24 | 0.821074% |
| C | 2923 | 13 | 0.444749% |
| D | 2923 | 12 | 0.410537% |
Noise dominated data is calculated using 1-second bins in cleaned event files. If a bin has >2000 counts, and if more than 50% of those come from <1% of pixels, then it is considered to be noise-dominated and hence unusable.
| Quadrant | # 1 sec bins | Bins with >0 counts | Bins with >2000 counts | High rate bins dominated by noise | Noise dominated (total time) | Noise dominated (detector-on time) | Marked lightcurve |
|---|---|---|---|---|---|---|---|
| A | 3818 | 2924 | 1 | 1 | 0.03% | 0.03% | 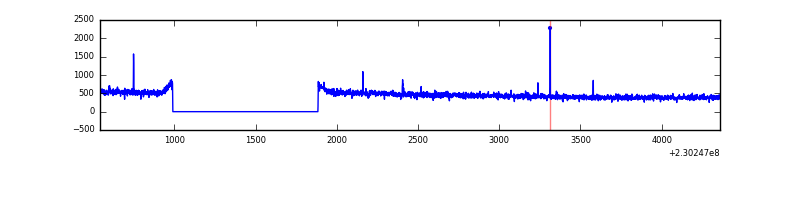 |
| B | 3818 | 2924 | 0 | 0 | 0.00% | 0.00% | 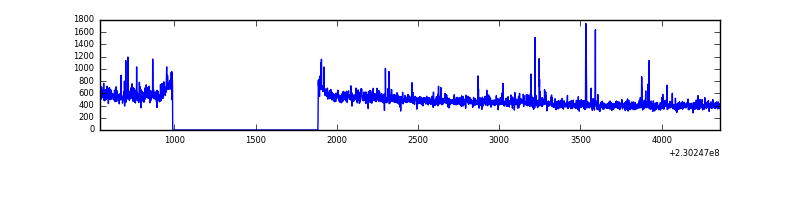 |
| C | 3818 | 2924 | 0 | 0 | 0.00% | 0.00% | 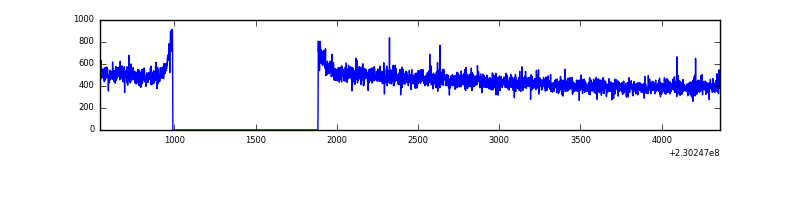 |
| D | 3818 | 2924 | 3 | 3 | 0.08% | 0.10% | 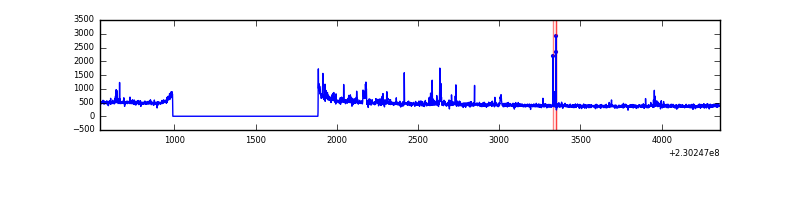 |
Top three noisy pixels from each quadrant. If the there are fewer than three noisy pixels in the level2.evt file, extra rows are filled as -1
| Pixel properties | Quadrant properties | ||||||
|---|---|---|---|---|---|---|---|
| Quadrant | DetID | PixID | Counts | Sigma | Mean | Median | Sigma |
| A | 14 | 111 | 5069 | 65.85 | 340 | 332 | 71.9 |
| A | 13 | 248 | 4012 | 51.16 | 340 | 332 | 71.9 |
| A | 5 | 16 | 3849 | 48.89 | 340 | 332 | 71.9 |
| B | 0 | 214 | 22607 | 325.86 | 347 | 338 | 68.3 |
| B | 4 | 81 | 14739 | 210.73 | 347 | 338 | 68.3 |
| B | 10 | 252 | 9071 | 127.79 | 347 | 338 | 68.3 |
| C | 13 | 61 | 2616 | 28.42 | 336 | 338 | 80.2 |
| C | 3 | 202 | 838 | 6.24 | 336 | 338 | 80.2 |
| C | 7 | 247 | 759 | 5.25 | 336 | 338 | 80.2 |
| D | 12 | 221 | 25293 | 304.19 | 329 | 319 | 82.1 |
| D | 1 | 52 | 19855 | 237.95 | 329 | 319 | 82.1 |
| D | 2 | 14 | 12834 | 152.43 | 329 | 319 | 82.1 |
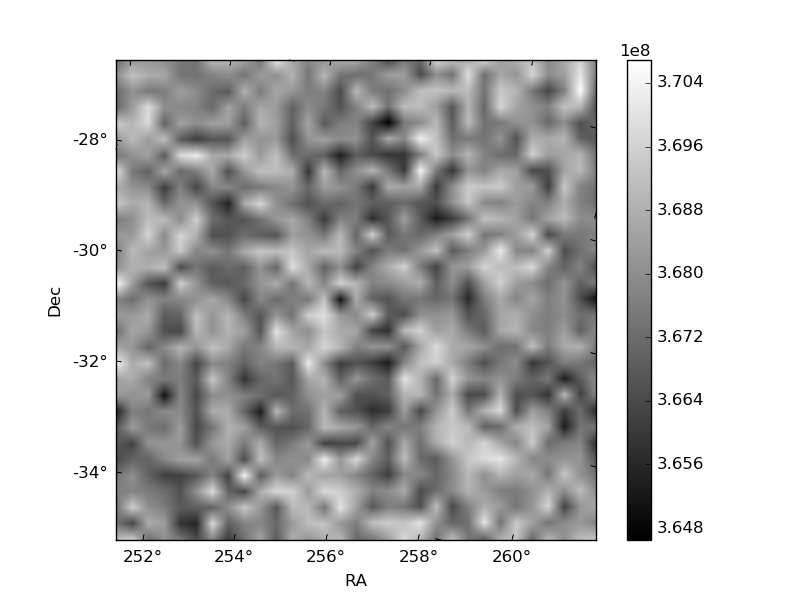
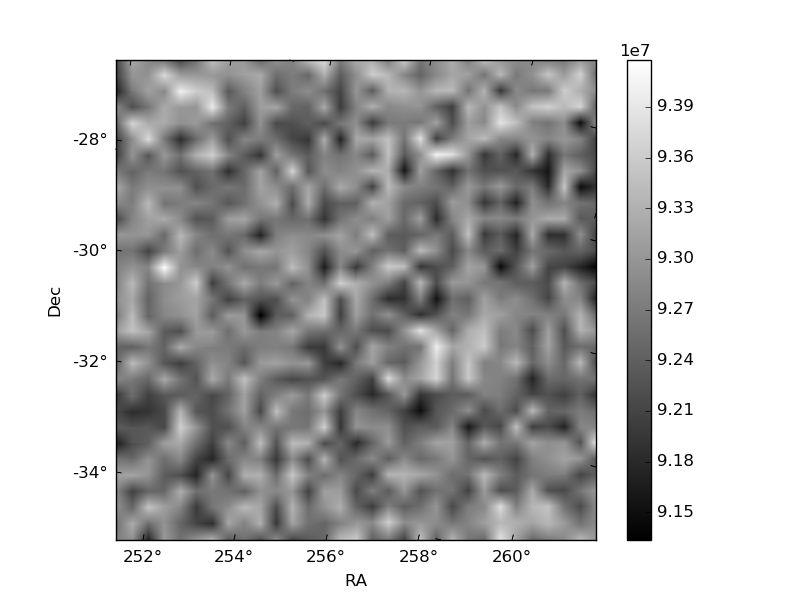
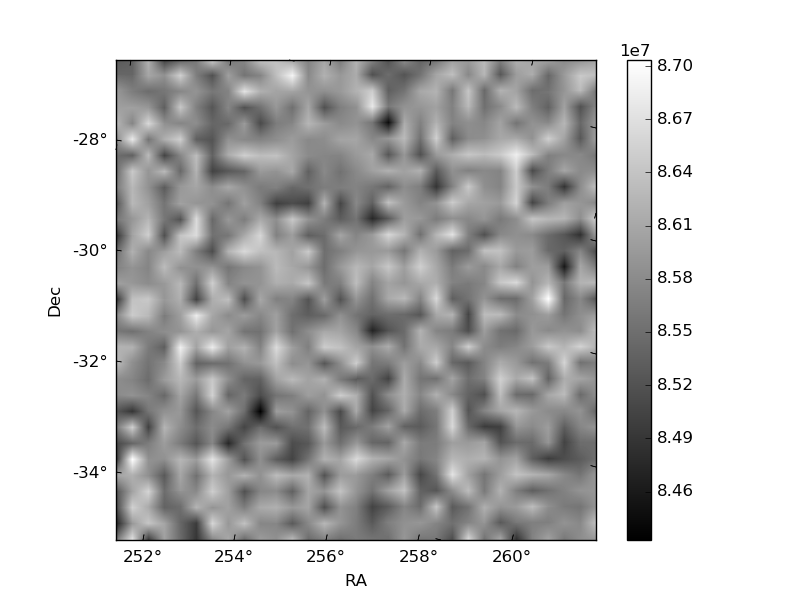
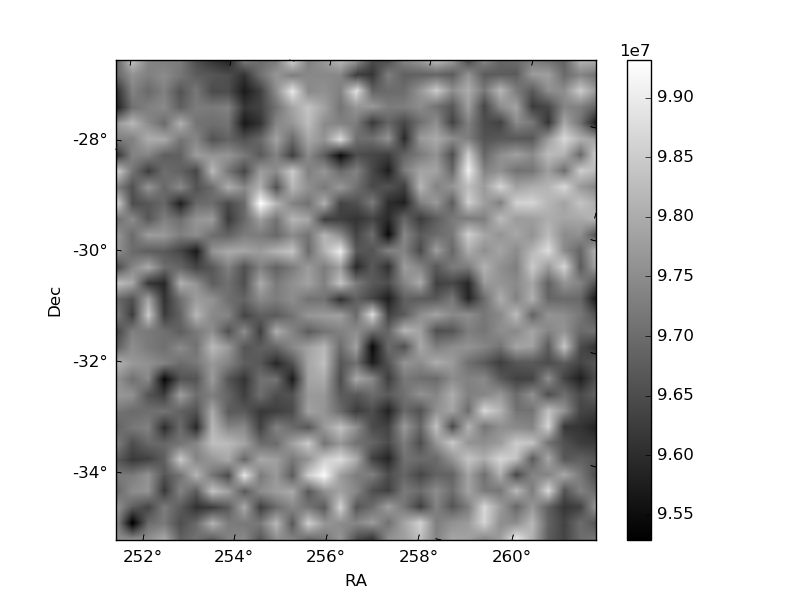
Histogram calculated using DETX and DETY for each event in the final _common_clean file
| Quadrant A | 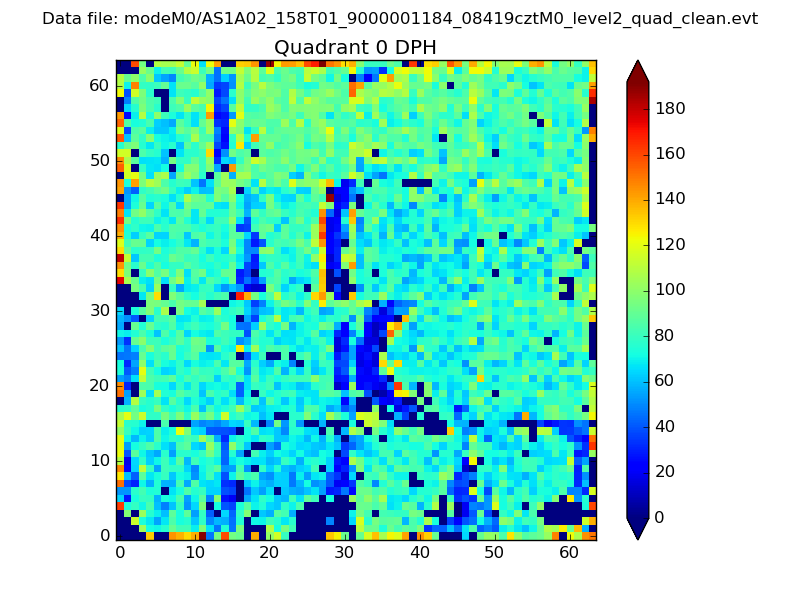 |
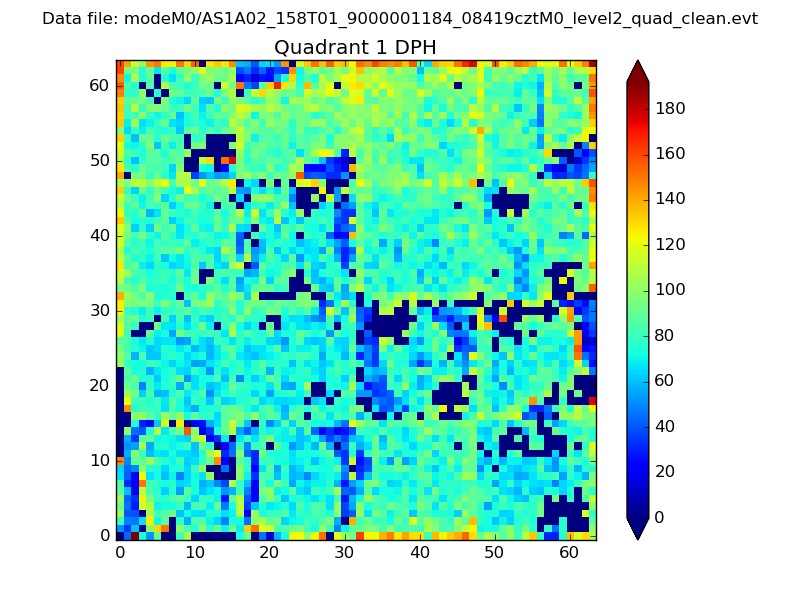 |
Quadrant B |
|---|---|---|---|
| Quadrant D | 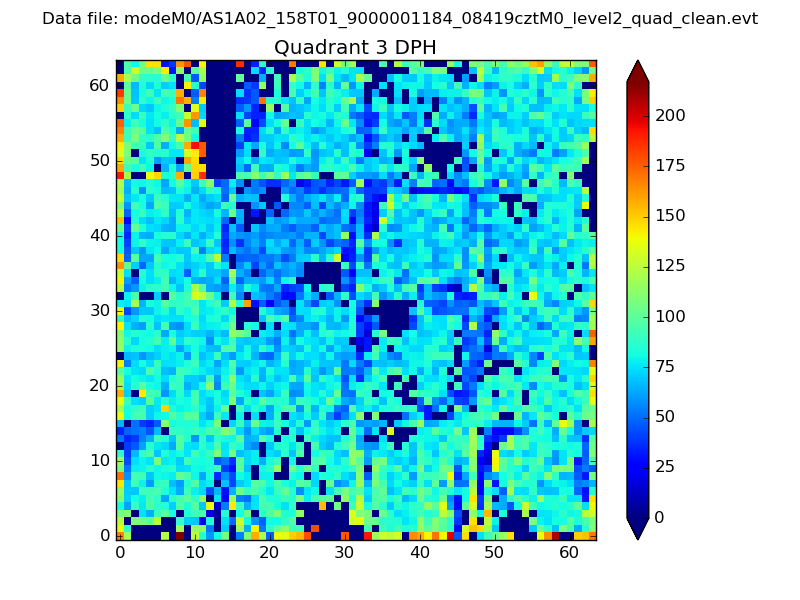 |
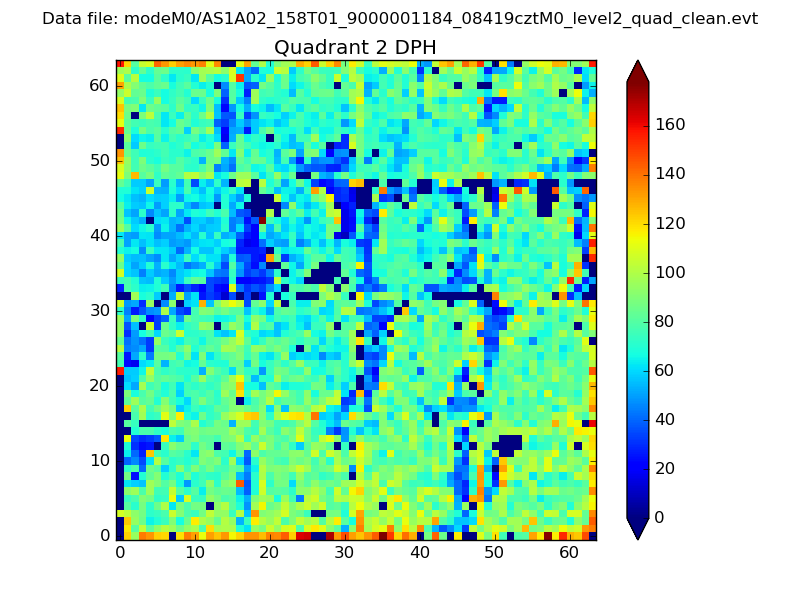 |
Quadrant C |
| Plot type | Count rate plots | Images |
|---|---|---|
| Comparison with Poisson distribution Blue bars denote a histogram of data divided into 1 sec bins. Red curve is a Poisson curve with rate = median count rate of data. |
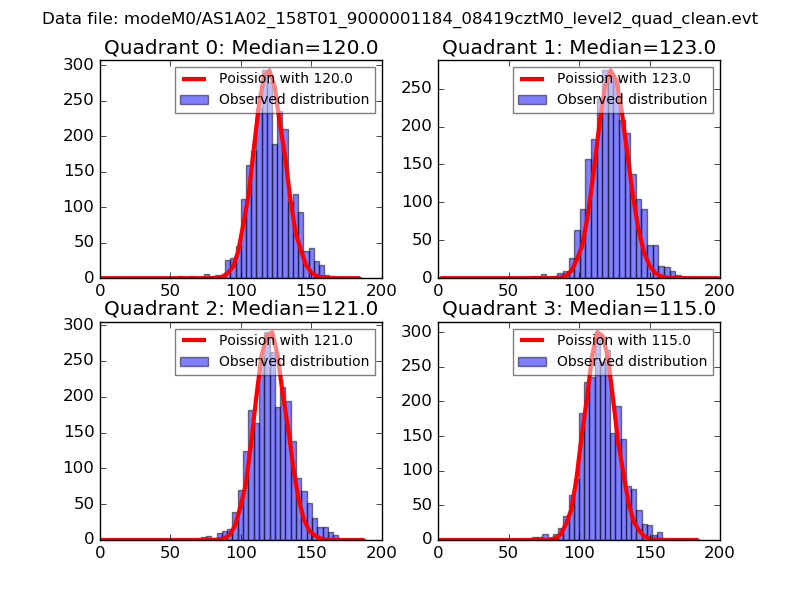 |
 |
| Quadrant-wise count rates Data is divided into 100 sec bins |
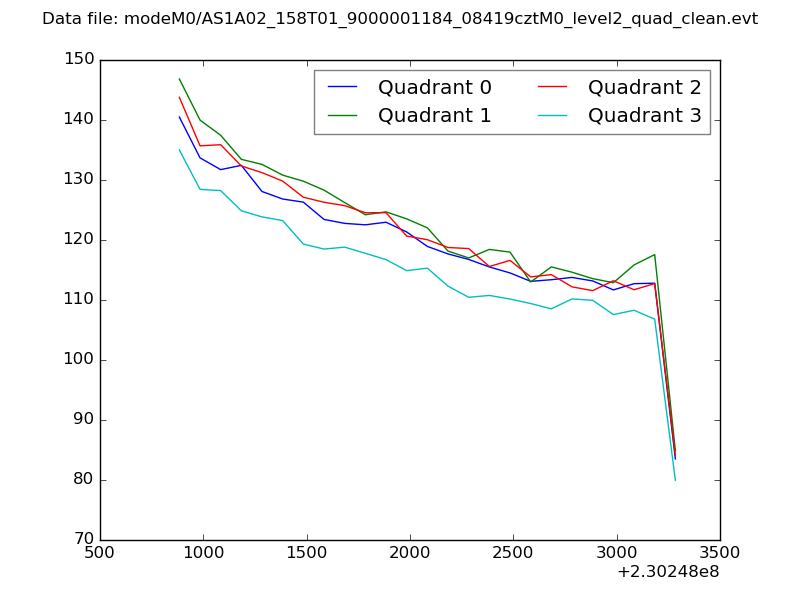 |
|
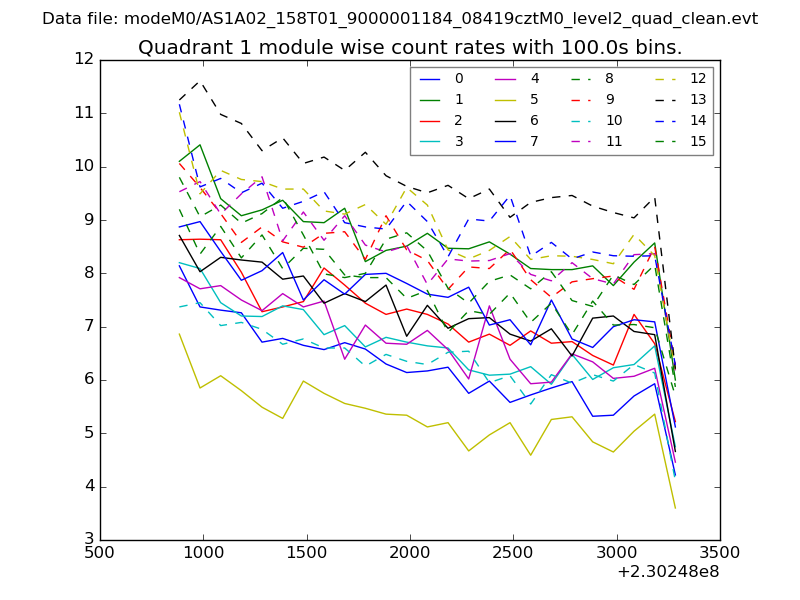
| Module-wise count rates for Quadrant A Data is divided into 100 sec bins |
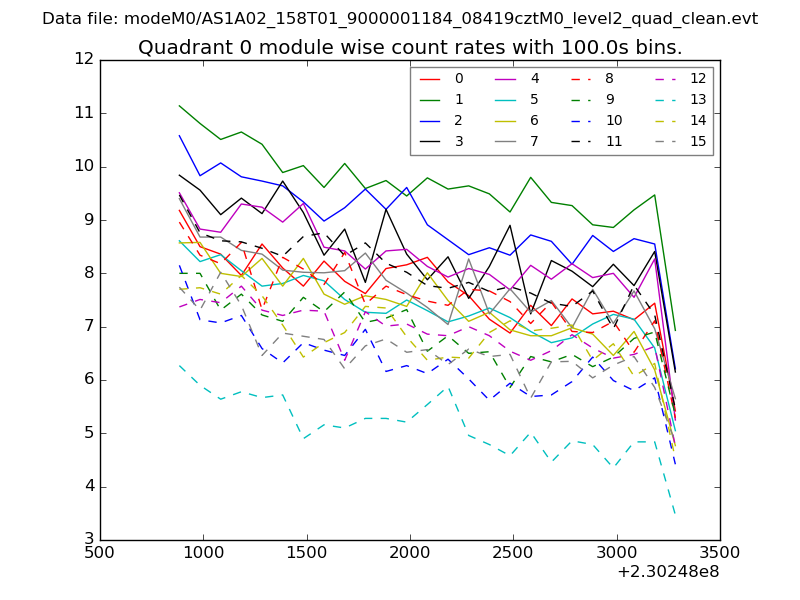 |
 |
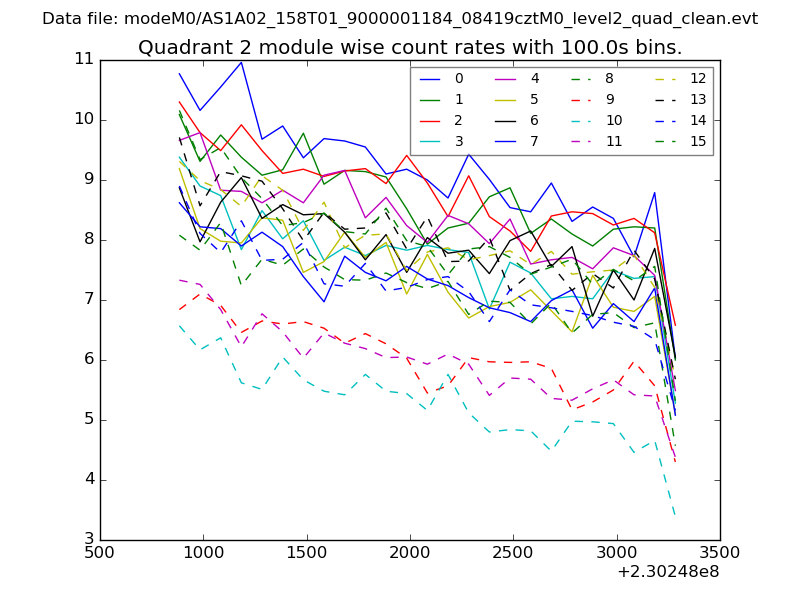
| Module-wise count rates for Quadrant B Data is divided into 100 sec bins |
 |
 |
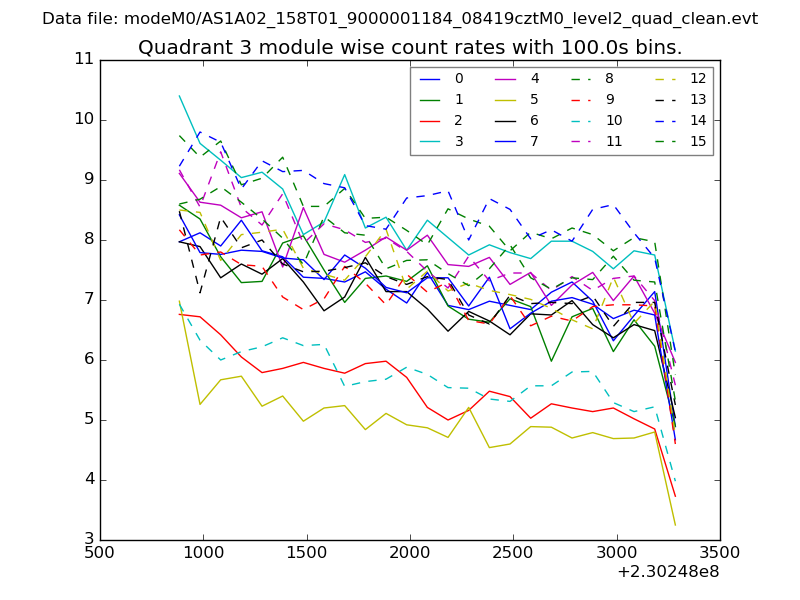
| Module-wise count rates for Quadrant C Data is divided into 100 sec bins |
 |
 |
| Module-wise count rates for Quadrant D Data is divided into 100 sec bins |
 |
 |
| Parameter | Plot |
|---|---|
| CZT HV Monitor | 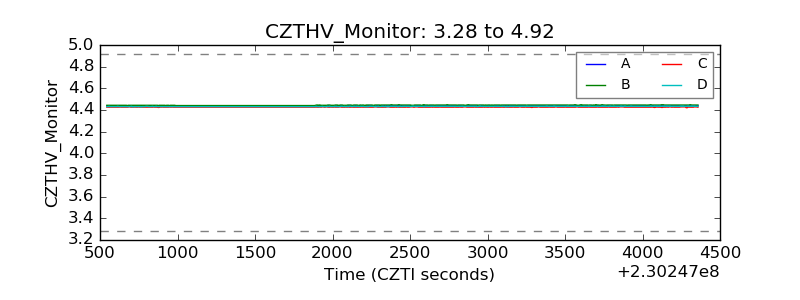 |
| D_VDD |  |
| Temperature 1 | 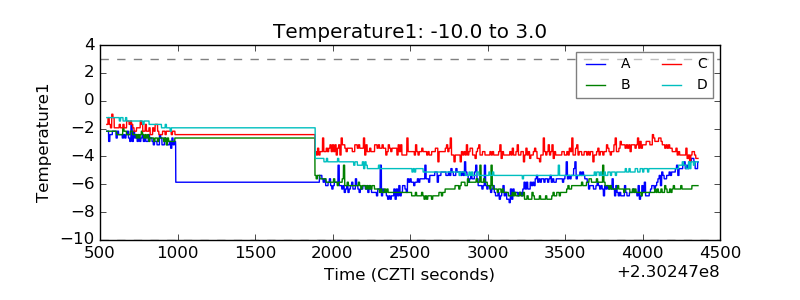 |
| Veto HV Monitor | 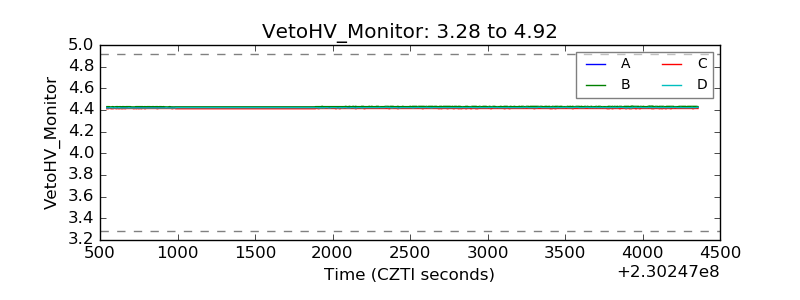 |
| Veto LLD | 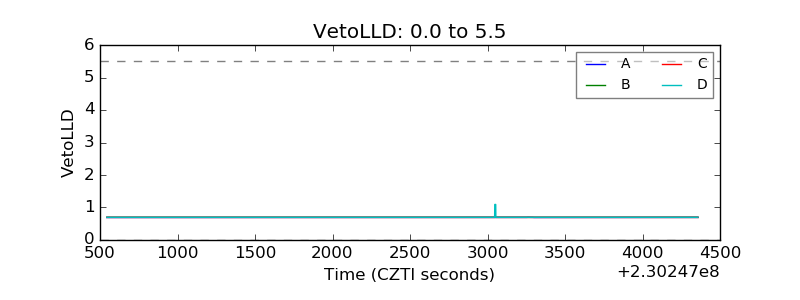 |
| Alpha Counter | 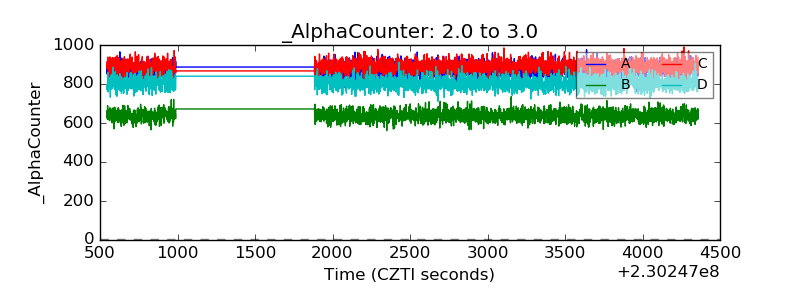 |
| _CPM_Rate |  |
| CZT Counter | 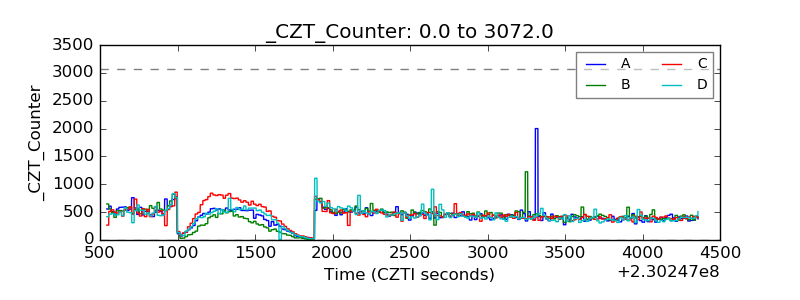 |
| +2.5 Volts monitor |  |
| +5 Volts monitor |  |
| _ROLL_ROT | 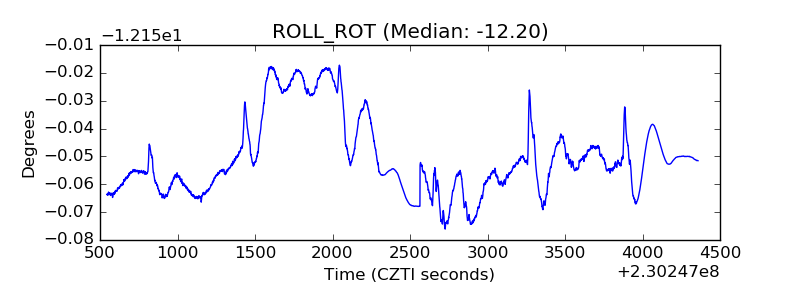 |
| _Roll_DEC | 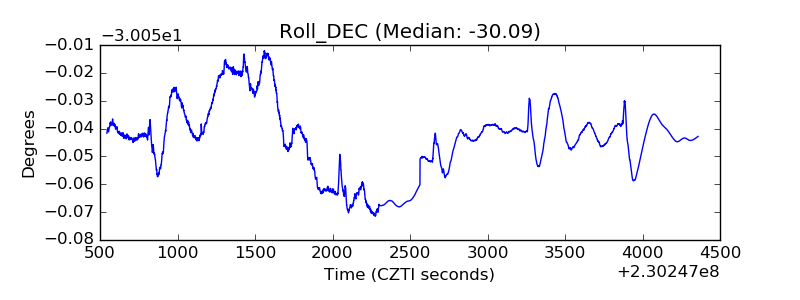 |
| _Roll_RA | 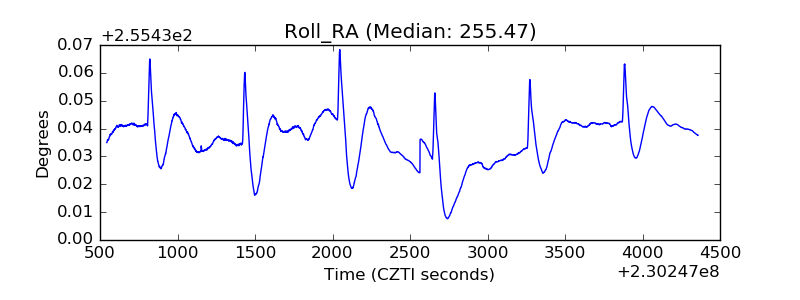 |
| Veto Counter | 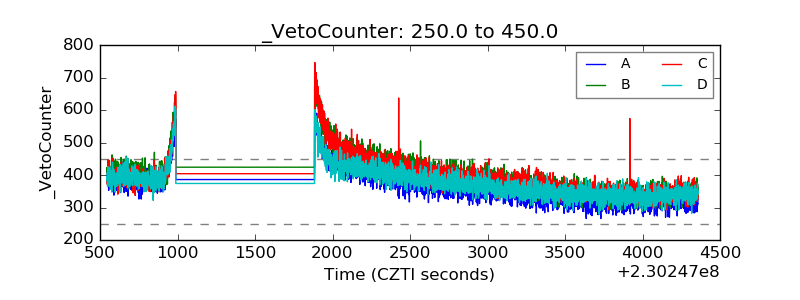 |