| Param | Original file | Final file |
|---|---|---|
| Filename | modeM0/AS1G07_053T01_9000001186cztM0_level2.fits | modeM0/AS1G07_053T01_9000001186cztM0_level2_quad_clean.evt |
| Size (bytes) | 268,153,920 | 152,153,280 |
| Size | 255.7 MB | 145.1 MB |
| Events in quadrant A | 1,641,012 | 721,837 |
| Events in quadrant B | 1,580,110 | 729,869 |
| Events in quadrant C | 1,644,746 | 694,736 |
| Events in quadrant D | 1,411,738 | 615,685 |
| Mode SS | |||
|---|---|---|---|
| Quadrant | BADHDUFLAG | Total packets | Discarded packets |
| A | 0 | 548 | 0 |
| B | 0 | 546 | 0 |
| C | 0 | 546 | 0 |
| D | 0 | 546 | 0 |
| Mode M9 | |||
|---|---|---|---|
| Quadrant | BADHDUFLAG | Total packets | Discarded packets |
| A | 0 | 60 | 0 |
| B | 0 | 60 | 0 |
| C | 0 | 60 | 0 |
| D | 0 | 60 | 0 |
| Mode M0 | |||
|---|---|---|---|
| Quadrant | BADHDUFLAG | Total packets | Discarded packets |
| A | 0 | 56197 | 0 |
| B | 0 | 59687 | 0 |
| C | 0 | 55155 | 0 |
| D | 0 | 63812 | 0 |
| Quadrant | Total seconds | Saturated seconds | Saturation percentage |
|---|---|---|---|
| A | 26808 | 286 | 1.066846% |
| B | 26811 | 489 | 1.823878% |
| C | 26807 | 133 | 0.496139% |
| D | 26809 | 566 | 2.111231% |
Noise dominated data is calculated using 1-second bins in cleaned event files. If a bin has >2000 counts, and if more than 50% of those come from <1% of pixels, then it is considered to be noise-dominated and hence unusable.
| Quadrant | # 1 sec bins | Bins with >0 counts | Bins with >2000 counts | High rate bins dominated by noise | Noise dominated (total time) | Noise dominated (detector-on time) | Marked lightcurve |
|---|---|---|---|---|---|---|---|
| A | 33013 | 26856 | 0 | 0 | 0.00% | 0.00% |  |
| B | 33013 | 26856 | 0 | 0 | 0.00% | 0.00% |  |
| C | 33013 | 26854 | 0 | 0 | 0.00% | 0.00% | 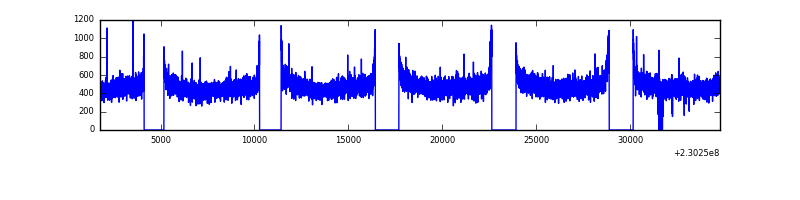 |
| D | 33013 | 26858 | 0 | 0 | 0.00% | 0.00% | 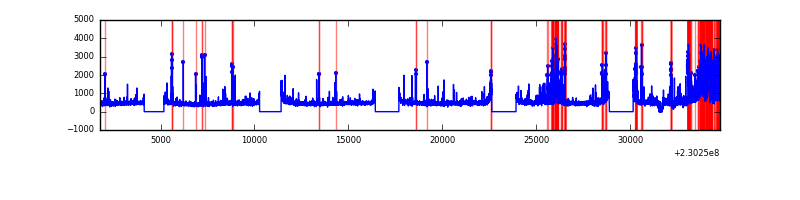 |
Top three noisy pixels from each quadrant. If the there are fewer than three noisy pixels in the level2.evt file, extra rows are filled as -1
| Pixel properties | Quadrant properties | ||||||
|---|---|---|---|---|---|---|---|
| Quadrant | DetID | PixID | Counts | Sigma | Mean | Median | Sigma |
| A | 0 | 29 | 1598 | 11.32 | 426 | 400 | 105.8 |
| A | 7 | 110 | 1370 | 9.17 | 426 | 400 | 105.8 |
| A | 0 | 30 | 1273 | 8.25 | 426 | 400 | 105.8 |
| B | 2 | 9 | 1379 | 11.77 | 417 | 399 | 83.3 |
| B | 12 | 226 | 1118 | 8.63 | 417 | 399 | 83.3 |
| B | 2 | 8 | 1052 | 7.84 | 417 | 399 | 83.3 |
| C | 1 | 80 | 1219 | 7.12 | 434 | 404 | 114.4 |
| C | 1 | 81 | 1179 | 6.77 | 434 | 404 | 114.4 |
| C | 3 | 126 | 1100 | 6.08 | 434 | 404 | 114.4 |
| D | 3 | 14 | 1062 | 6.51 | 402 | 368 | 106.6 |
| D | 6 | 231 | 1035 | 6.26 | 402 | 368 | 106.6 |
| D | 10 | 189 | 1009 | 6.01 | 402 | 368 | 106.6 |
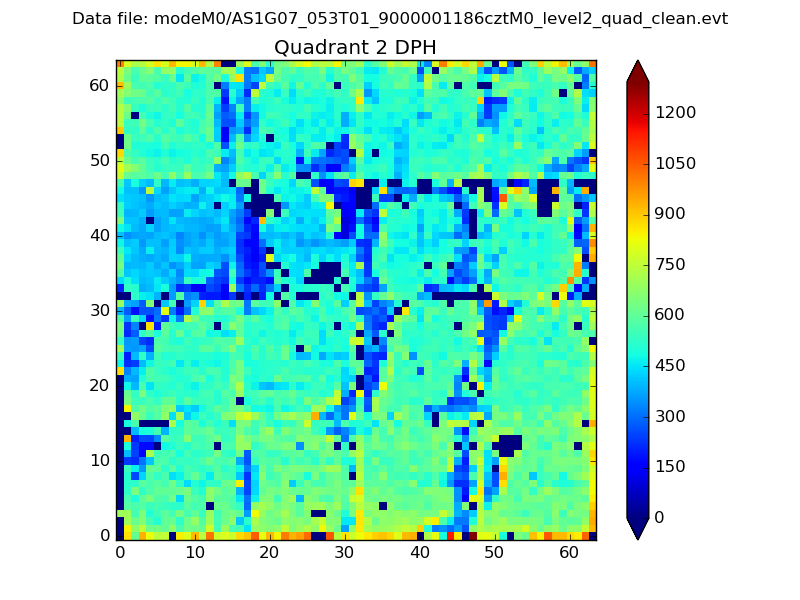
Histogram calculated using DETX and DETY for each event in the final _common_clean file
| Quadrant A | 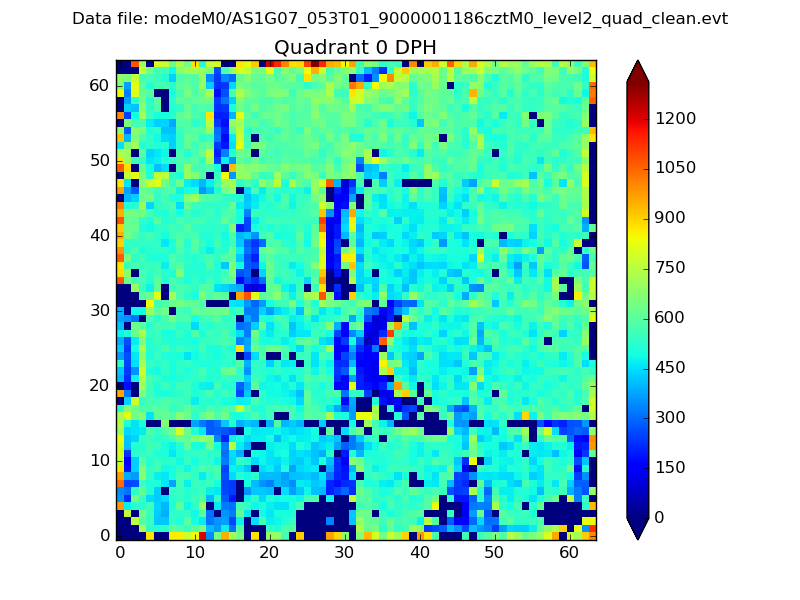 |
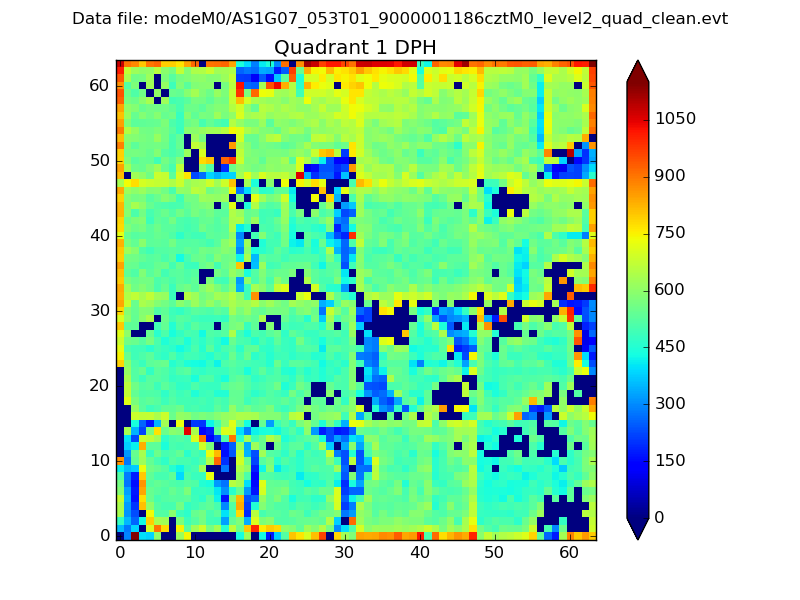 |
Quadrant B |
|---|---|---|---|
| Quadrant D |  |
 |
Quadrant C |
| Plot type | Count rate plots | Images |
|---|---|---|
| Comparison with Poisson distribution Blue bars denote a histogram of data divided into 1 sec bins. Red curve is a Poisson curve with rate = median count rate of data. |
 |
 |
| Quadrant-wise count rates Data is divided into 100 sec bins |
 |
|
| Module-wise count rates for Quadrant A Data is divided into 100 sec bins |
 |
 |
| Module-wise count rates for Quadrant B Data is divided into 100 sec bins |
 |
 |
| Module-wise count rates for Quadrant C Data is divided into 100 sec bins |
 |
 |
| Module-wise count rates for Quadrant D Data is divided into 100 sec bins |
 |
 |
| Parameter | Plot |
|---|---|
| CZT HV Monitor |  |
| D_VDD | 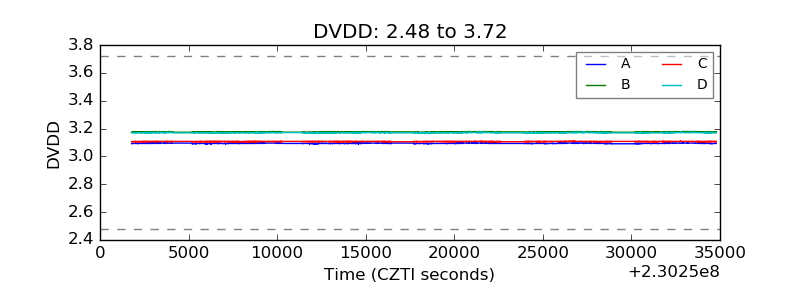 |
| Temperature 1 |  |
| Veto HV Monitor | 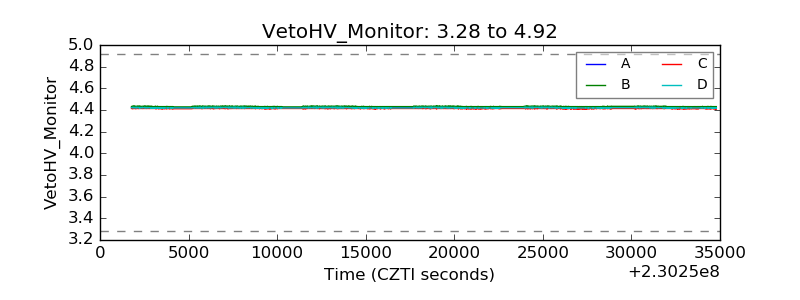 |
| Veto LLD |  |
| Alpha Counter |  |
| _CPM_Rate | 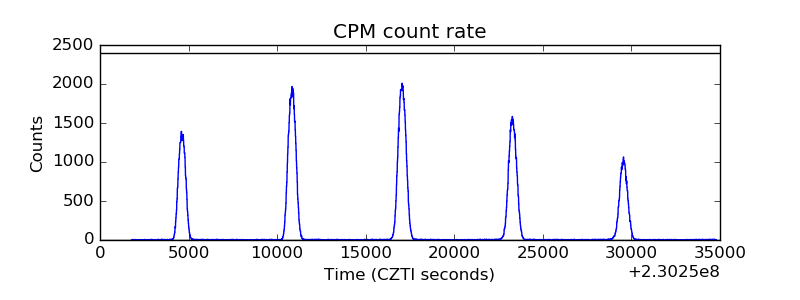 |
| CZT Counter |  |
| +2.5 Volts monitor | 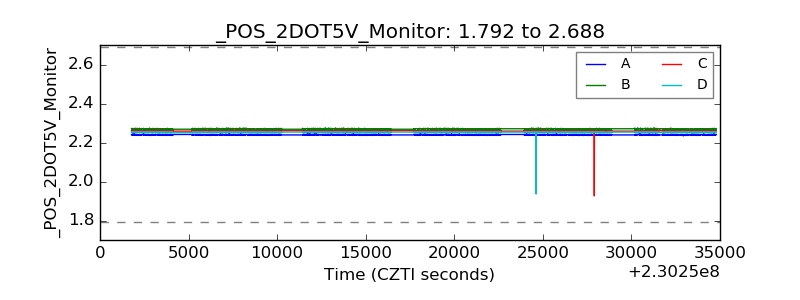 |
| +5 Volts monitor |  |
| _ROLL_ROT | 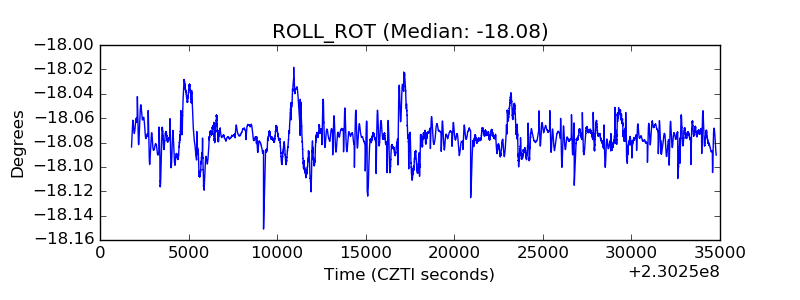 |
| _Roll_DEC |  |
| _Roll_RA |  |
| Veto Counter | 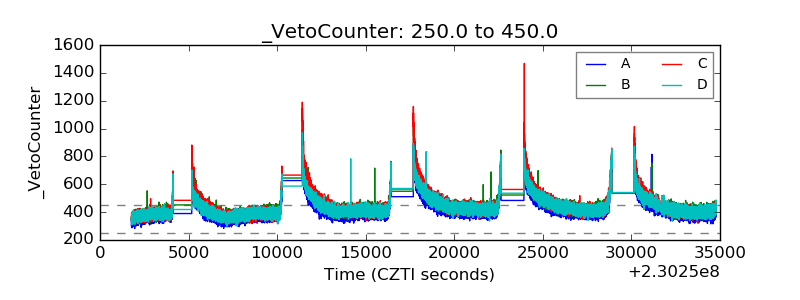 |