| Param | Original file | Final file |
|---|---|---|
| Filename | modeM0/AS1G07_053T01_9000001186_08419cztM0_level2.evt | modeM0/AS1G07_053T01_9000001186_08419cztM0_level2_quad_clean.evt |
| Size (bytes) | 257,696,640 | 43,888,320 |
| Size | 245.8 MB | 41.9 MB |
| Events in quadrant A | 1,863,566 | 264,166 |
| Events in quadrant B | 1,993,838 | 271,171 |
| Events in quadrant C | 1,843,341 | 266,272 |
| Events in quadrant D | 1,836,250 | 250,981 |
| Mode SS | |||
|---|---|---|---|
| Quadrant | BADHDUFLAG | Total packets | Discarded packets |
| A | 0 | 82 | 0 |
| B | 0 | 82 | 0 |
| C | 0 | 82 | 0 |
| D | 0 | 82 | 0 |
| Mode M9 | |||
|---|---|---|---|
| Quadrant | BADHDUFLAG | Total packets | Discarded packets |
| A | 0 | 10 | 0 |
| B | 0 | 10 | 0 |
| C | 0 | 10 | 0 |
| D | 0 | 10 | 0 |
| Mode M0 | |||
|---|---|---|---|
| Quadrant | BADHDUFLAG | Total packets | Discarded packets |
| A | 0 | 7971 | 2 |
| B | 0 | 8314 | 1 |
| C | 0 | 7926 | 1 |
| D | 0 | 8073 | 1 |
| Quadrant | Total seconds | Saturated seconds | Saturation percentage |
|---|---|---|---|
| A | 3901 | 10 | 0.256345% |
| B | 3901 | 24 | 0.615227% |
| C | 3901 | 8 | 0.205076% |
| D | 3901 | 6 | 0.153807% |
Noise dominated data is calculated using 1-second bins in cleaned event files. If a bin has >2000 counts, and if more than 50% of those come from <1% of pixels, then it is considered to be noise-dominated and hence unusable.
| Quadrant | # 1 sec bins | Bins with >0 counts | Bins with >2000 counts | High rate bins dominated by noise | Noise dominated (total time) | Noise dominated (detector-on time) | Marked lightcurve |
|---|---|---|---|---|---|---|---|
| A | 4956 | 3902 | 0 | 0 | 0.00% | 0.00% | 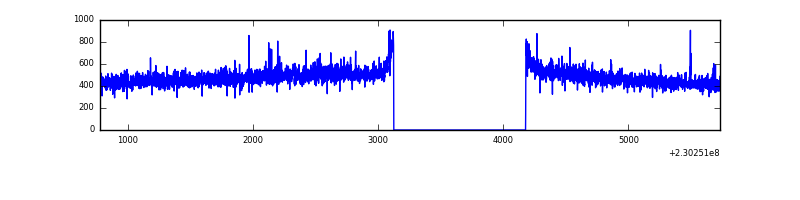 |
| B | 4956 | 3902 | 0 | 0 | 0.00% | 0.00% | 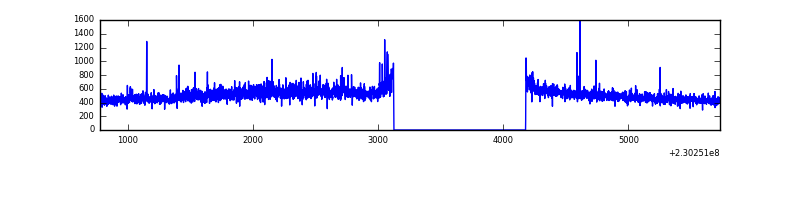 |
| C | 4956 | 3902 | 0 | 0 | 0.00% | 0.00% | 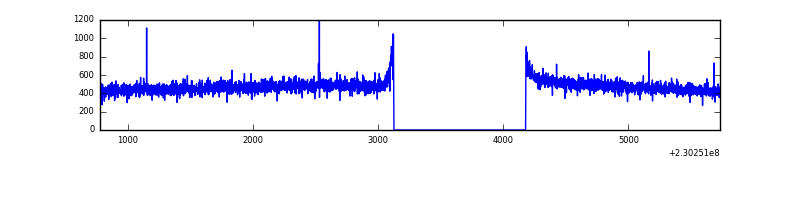 |
| D | 4956 | 3902 | 5 | 5 | 0.10% | 0.13% | 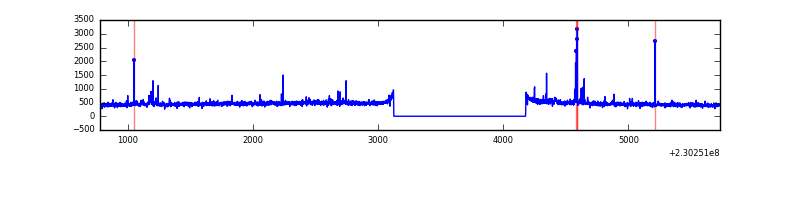 |
Top three noisy pixels from each quadrant. If the there are fewer than three noisy pixels in the level2.evt file, extra rows are filled as -1
| Pixel properties | Quadrant properties | ||||||
|---|---|---|---|---|---|---|---|
| Quadrant | DetID | PixID | Counts | Sigma | Mean | Median | Sigma |
| A | 14 | 111 | 5311 | 48.23 | 481 | 471 | 100.3 |
| A | 0 | 226 | 4565 | 40.8 | 481 | 471 | 100.3 |
| A | 12 | 194 | 4300 | 38.16 | 481 | 471 | 100.3 |
| B | 0 | 214 | 81163 | 865.56 | 485 | 473 | 93.2 |
| B | 5 | 255 | 14293 | 148.25 | 485 | 473 | 93.2 |
| B | 12 | 111 | 9758 | 99.6 | 485 | 473 | 93.2 |
| C | 13 | 61 | 3624 | 28.36 | 472 | 475 | 111.1 |
| C | 3 | 202 | 1236 | 6.85 | 472 | 475 | 111.1 |
| C | 14 | 67 | 1068 | 5.34 | 472 | 475 | 111.1 |
| D | 2 | 14 | 30534 | 259.86 | 468 | 454 | 115.8 |
| D | 2 | 234 | 11541 | 95.78 | 468 | 454 | 115.8 |
| D | 7 | 71 | 8450 | 69.08 | 468 | 454 | 115.8 |
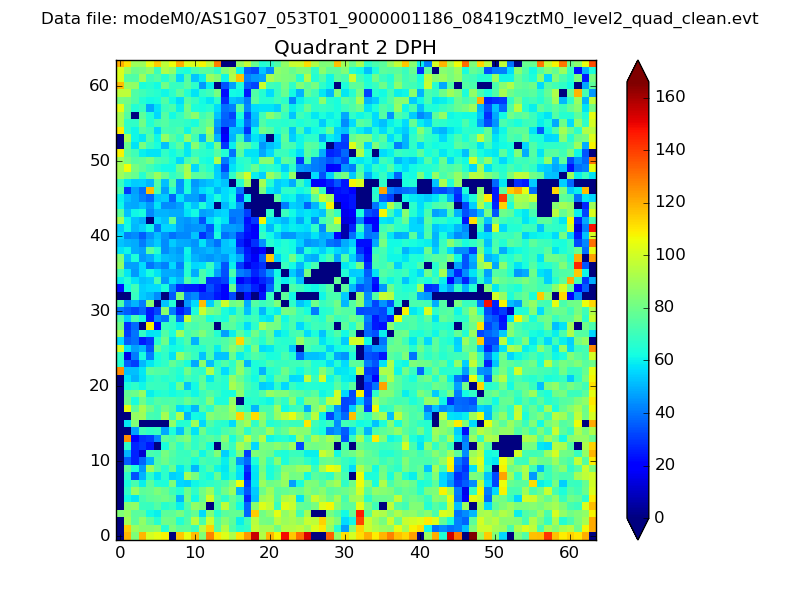
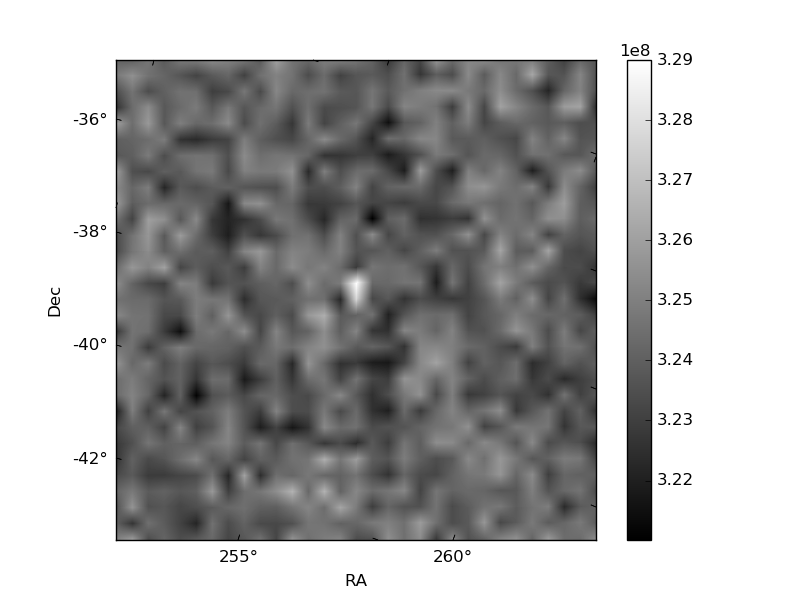
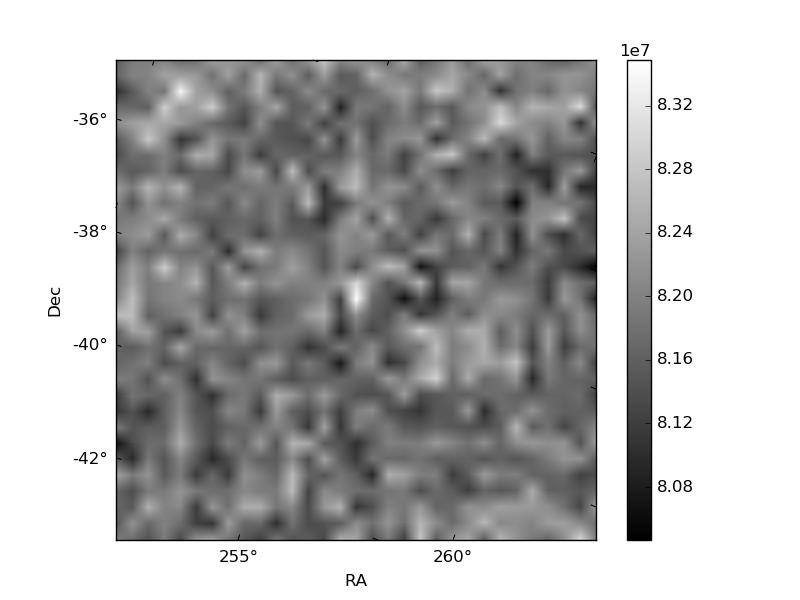
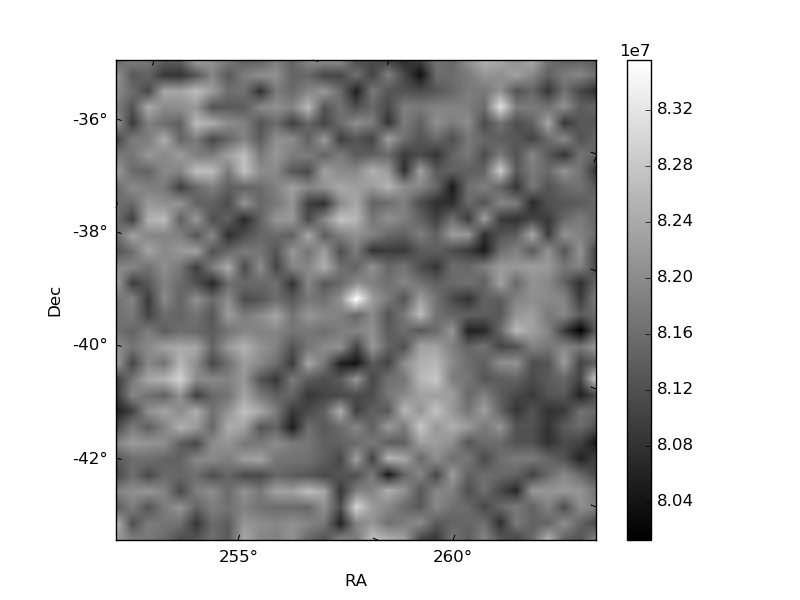
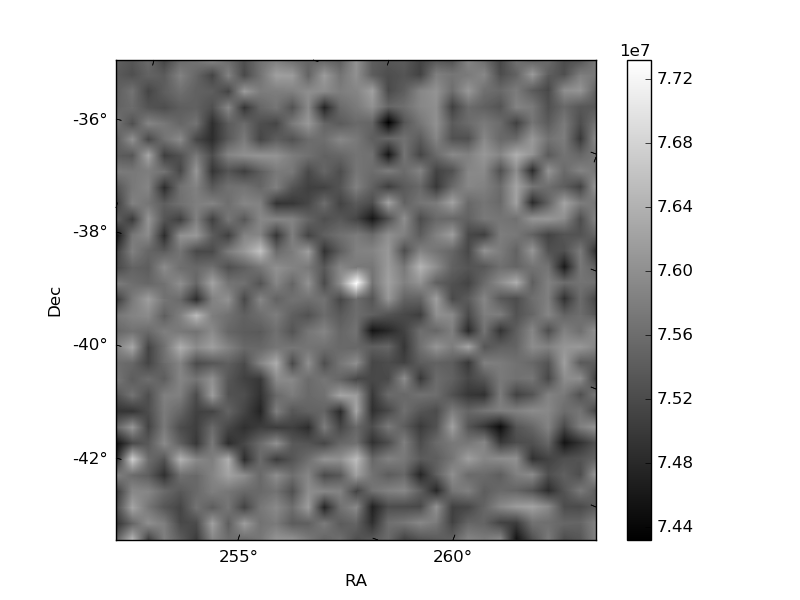
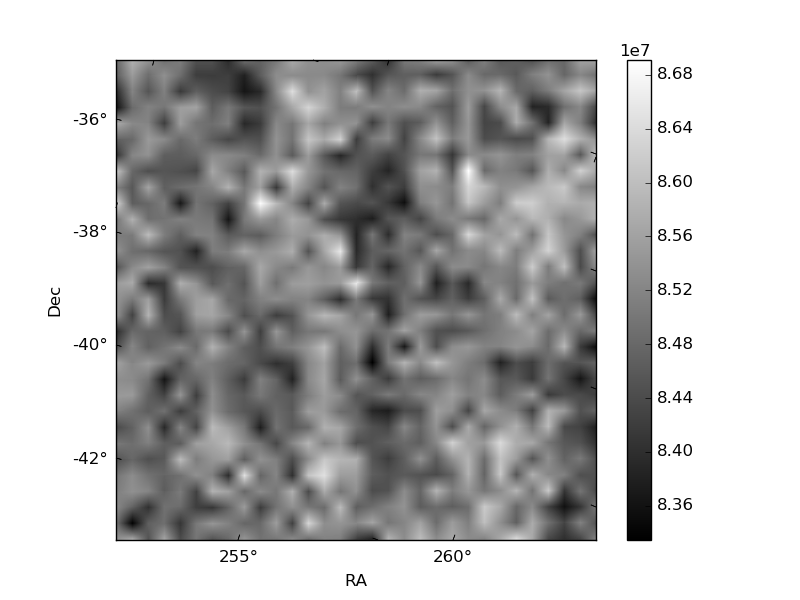
Histogram calculated using DETX and DETY for each event in the final _common_clean file
| Quadrant A | 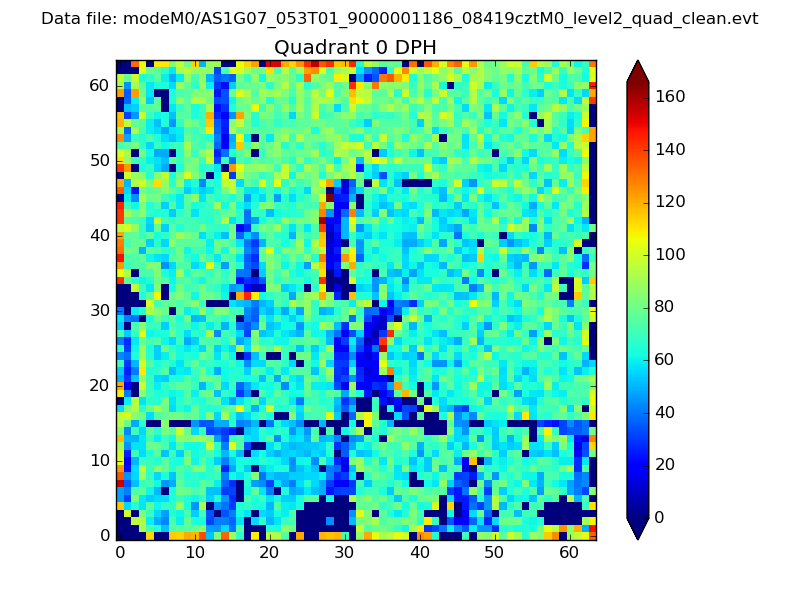 |
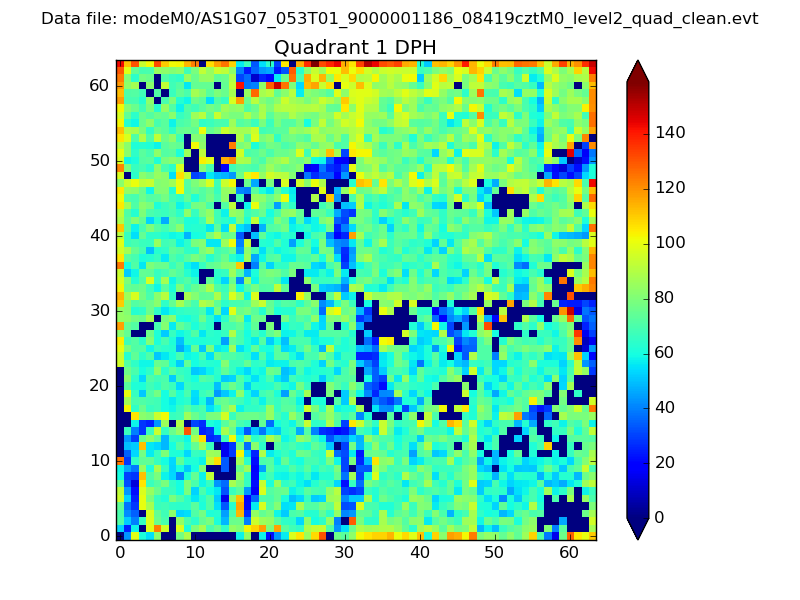 |
Quadrant B |
|---|---|---|---|
| Quadrant D | 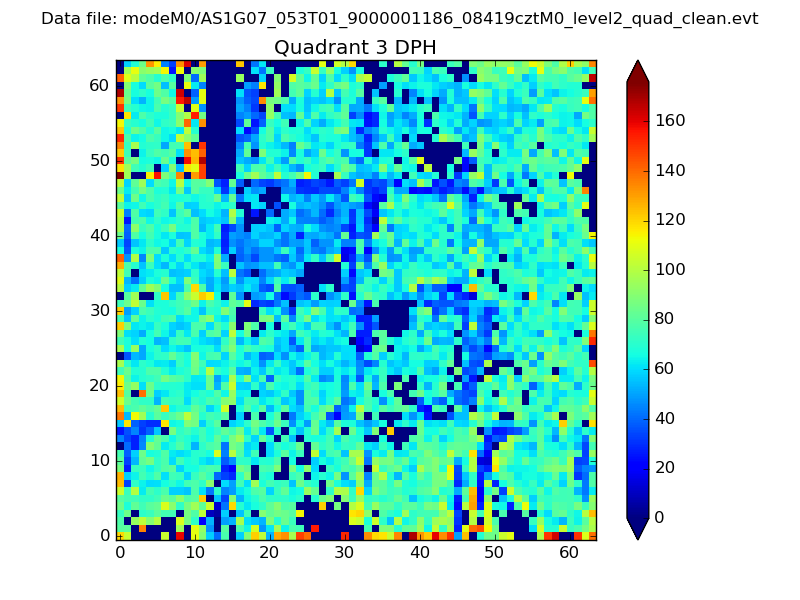 |
 |
Quadrant C |
| Plot type | Count rate plots | Images |
|---|---|---|
| Comparison with Poisson distribution Blue bars denote a histogram of data divided into 1 sec bins. Red curve is a Poisson curve with rate = median count rate of data. |
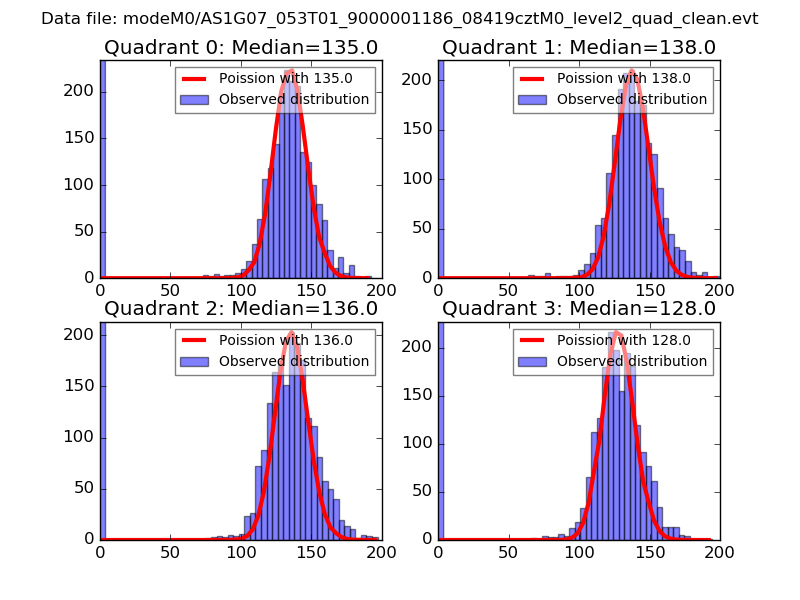 |
 |
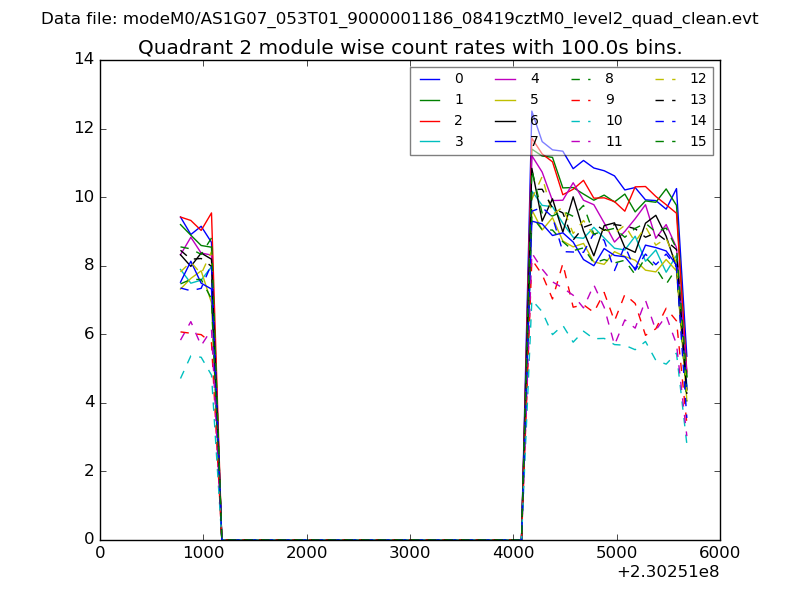
| Quadrant-wise count rates Data is divided into 100 sec bins |
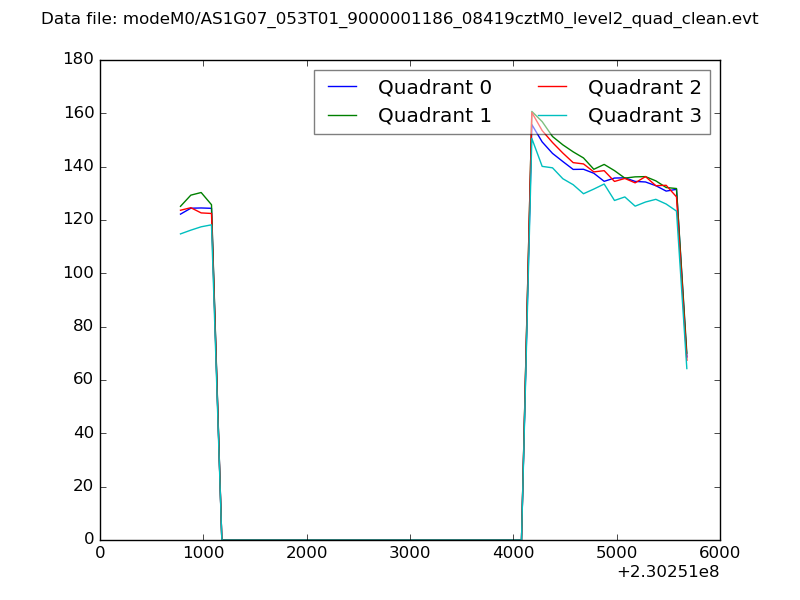 |
|
| Module-wise count rates for Quadrant A Data is divided into 100 sec bins |
 |
 |
| Module-wise count rates for Quadrant B Data is divided into 100 sec bins |
 |
 |
| Module-wise count rates for Quadrant C Data is divided into 100 sec bins |
 |
 |
| Module-wise count rates for Quadrant D Data is divided into 100 sec bins |
 |
 |
| Parameter | Plot |
|---|---|
| CZT HV Monitor | 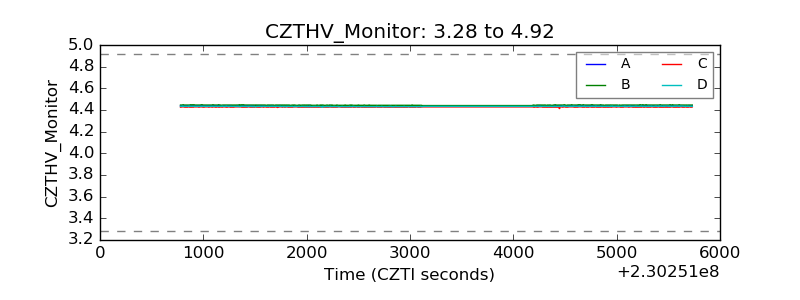 |
| D_VDD | 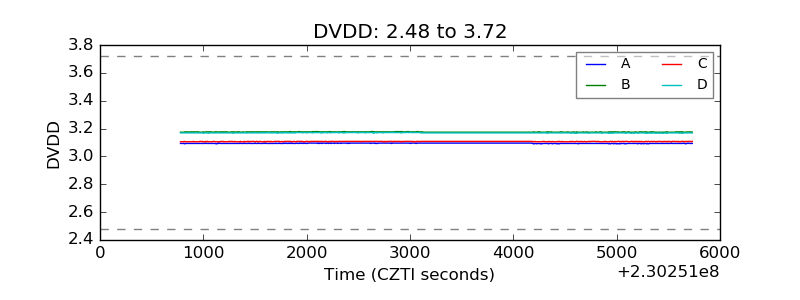 |
| Temperature 1 | 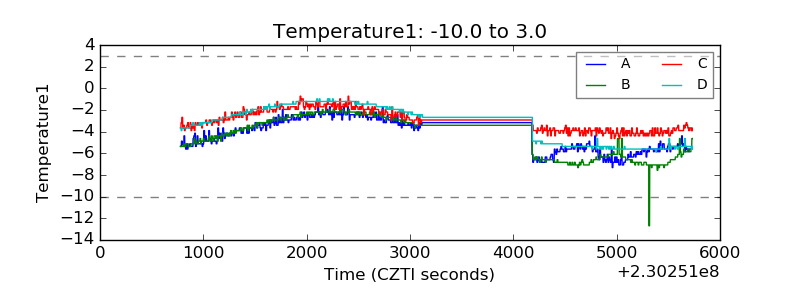 |
| Veto HV Monitor |  |
| Veto LLD | 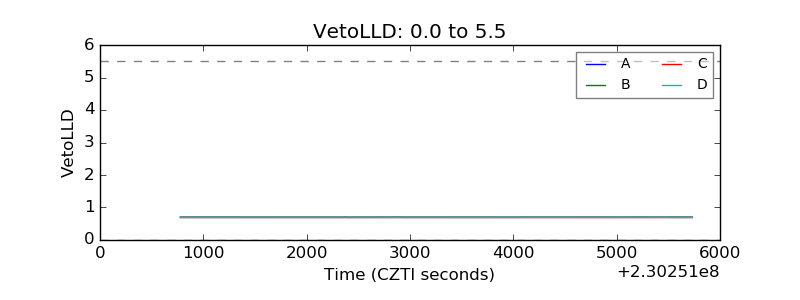 |
| Alpha Counter | 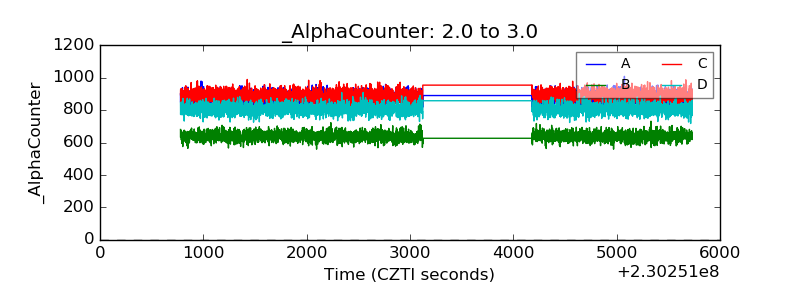 |
| _CPM_Rate | 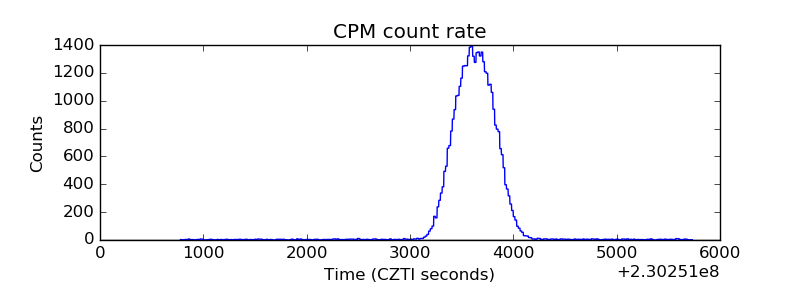 |
| CZT Counter | 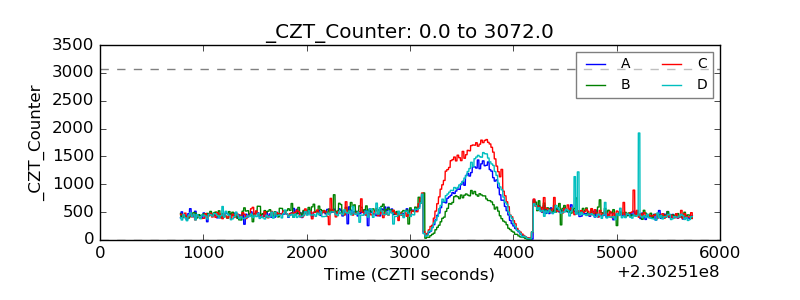 |
| +2.5 Volts monitor |  |
| +5 Volts monitor |  |
| _ROLL_ROT | 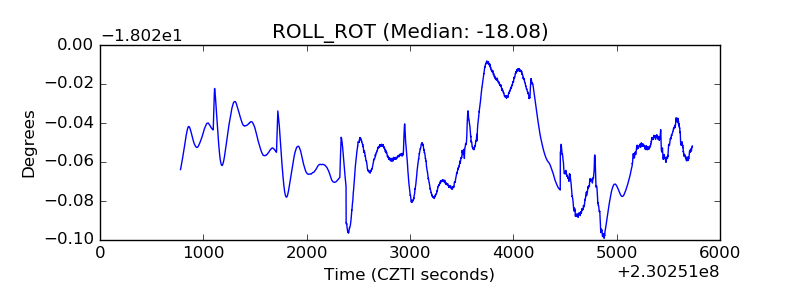 |
| _Roll_DEC |  |
| _Roll_RA | 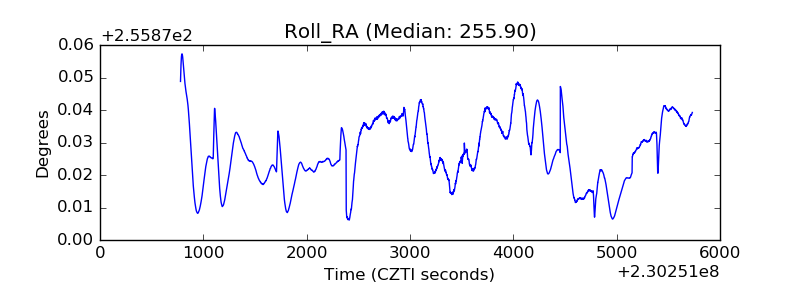 |
| Veto Counter |  |