| Param | Original file | Final file |
|---|---|---|
| Filename | modeM0/AS1G07_053T01_9000001186_08422cztM0_level2.evt | modeM0/AS1G07_053T01_9000001186_08422cztM0_level2_quad_clean.evt |
| Size (bytes) | 420,281,280 | 90,685,440 |
| Size | 400.8 MB | 86.5 MB |
| Events in quadrant A | 3,035,896 | 581,502 |
| Events in quadrant B | 3,363,926 | 595,040 |
| Events in quadrant C | 2,963,343 | 587,811 |
| Events in quadrant D | 2,951,334 | 556,876 |
| Mode SS | |||
|---|---|---|---|
| Quadrant | BADHDUFLAG | Total packets | Discarded packets |
| A | 0 | 126 | 0 |
| B | 0 | 126 | 0 |
| C | 0 | 126 | 0 |
| D | 0 | 126 | 0 |
| Mode M9 | |||
|---|---|---|---|
| Quadrant | BADHDUFLAG | Total packets | Discarded packets |
| A | 0 | 12 | 0 |
| B | 0 | 12 | 0 |
| C | 0 | 12 | 0 |
| D | 0 | 12 | 0 |
| Mode M0 | |||
|---|---|---|---|
| Quadrant | BADHDUFLAG | Total packets | Discarded packets |
| A | 0 | 12737 | 2 |
| B | 0 | 13751 | 1 |
| C | 0 | 12545 | 1 |
| D | 0 | 12691 | 1 |
| Quadrant | Total seconds | Saturated seconds | Saturation percentage |
|---|---|---|---|
| A | 6079 | 32 | 0.526402% |
| B | 6079 | 72 | 1.184405% |
| C | 6079 | 12 | 0.197401% |
| D | 6079 | 17 | 0.279651% |
Noise dominated data is calculated using 1-second bins in cleaned event files. If a bin has >2000 counts, and if more than 50% of those come from <1% of pixels, then it is considered to be noise-dominated and hence unusable.
| Quadrant | # 1 sec bins | Bins with >0 counts | Bins with >2000 counts | High rate bins dominated by noise | Noise dominated (total time) | Noise dominated (detector-on time) | Marked lightcurve |
|---|---|---|---|---|---|---|---|
| A | 7334 | 6080 | 3 | 3 | 0.04% | 0.05% | 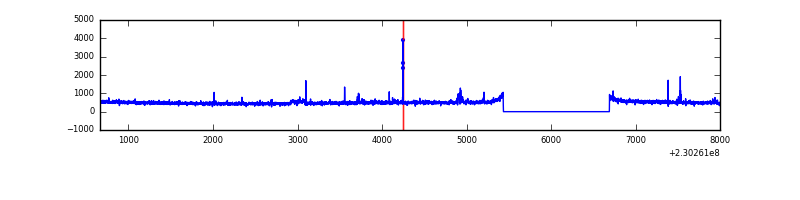 |
| B | 7334 | 6080 | 36 | 36 | 0.49% | 0.59% | 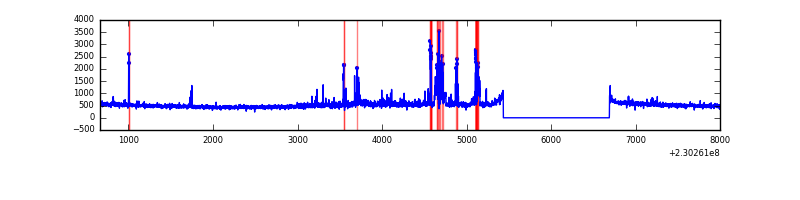 |
| C | 7334 | 6080 | 0 | 0 | 0.00% | 0.00% | 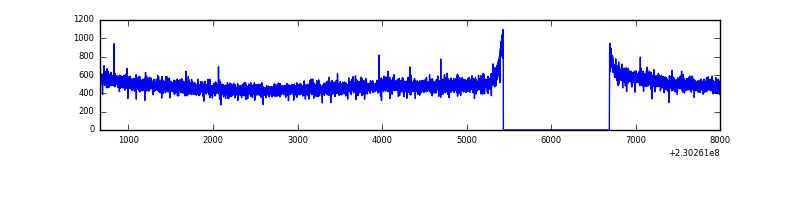 |
| D | 7334 | 6080 | 5 | 5 | 0.07% | 0.08% | 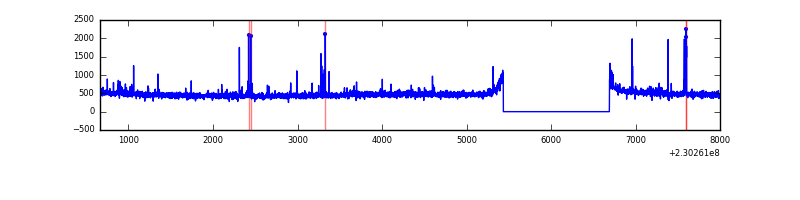 |
Top three noisy pixels from each quadrant. If the there are fewer than three noisy pixels in the level2.evt file, extra rows are filled as -1
| Pixel properties | Quadrant properties | ||||||
|---|---|---|---|---|---|---|---|
| Quadrant | DetID | PixID | Counts | Sigma | Mean | Median | Sigma |
| A | 14 | 111 | 65795 | 423.5 | 764 | 751 | 153.6 |
| A | 13 | 251 | 17784 | 110.9 | 764 | 751 | 153.6 |
| A | 0 | 226 | 7140 | 41.6 | 764 | 751 | 153.6 |
| B | 10 | 16 | 224304 | 1552.38 | 766 | 748 | 144.0 |
| B | 0 | 214 | 102903 | 709.37 | 766 | 748 | 144.0 |
| B | 11 | 51 | 23527 | 158.18 | 766 | 748 | 144.0 |
| C | 13 | 61 | 5668 | 27.91 | 759 | 764 | 175.7 |
| C | 8 | 222 | 2160 | 7.94 | 759 | 764 | 175.7 |
| C | 3 | 202 | 1897 | 6.45 | 759 | 764 | 175.7 |
| D | 2 | 14 | 46114 | 230.11 | 750 | 733 | 197.2 |
| D | 1 | 52 | 41591 | 207.17 | 750 | 733 | 197.2 |
| D | 2 | 234 | 16798 | 81.46 | 750 | 733 | 197.2 |
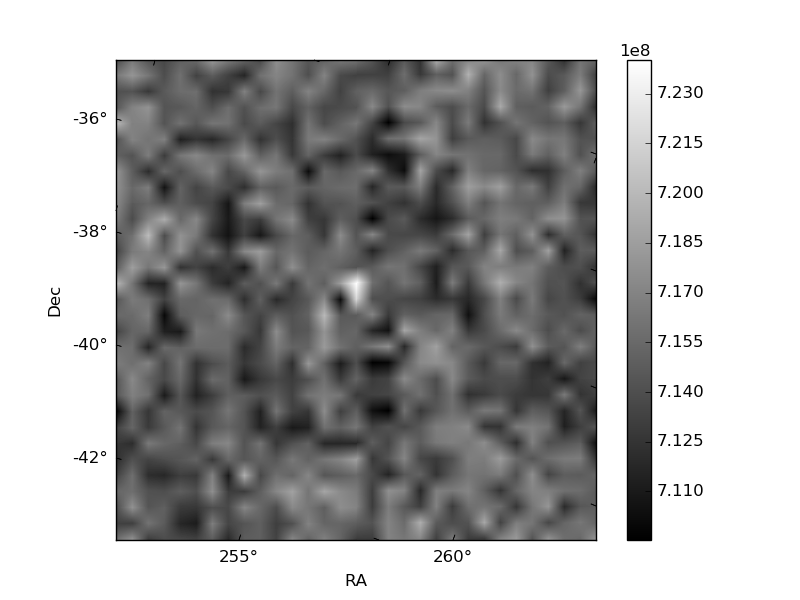
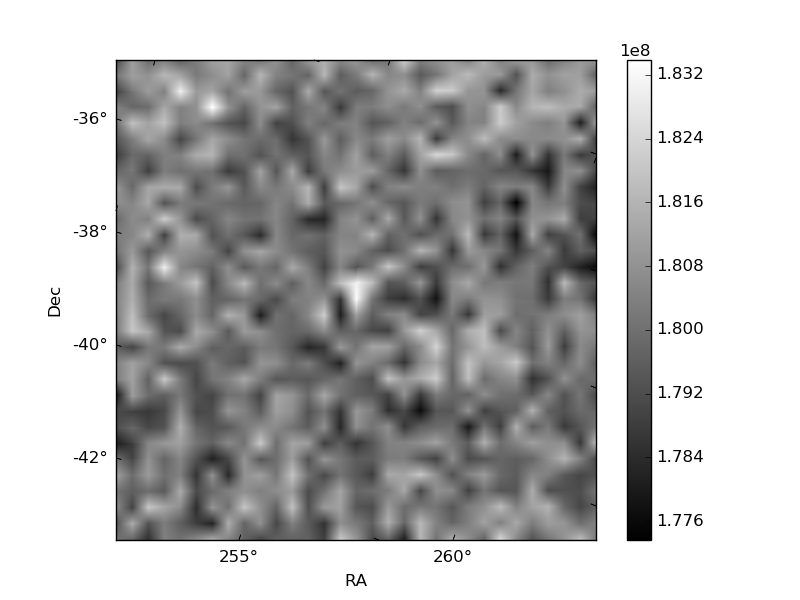
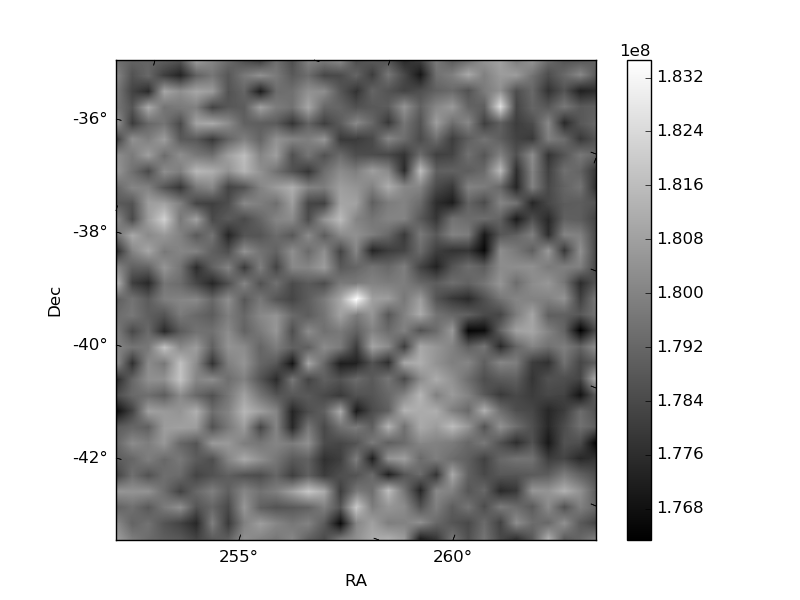
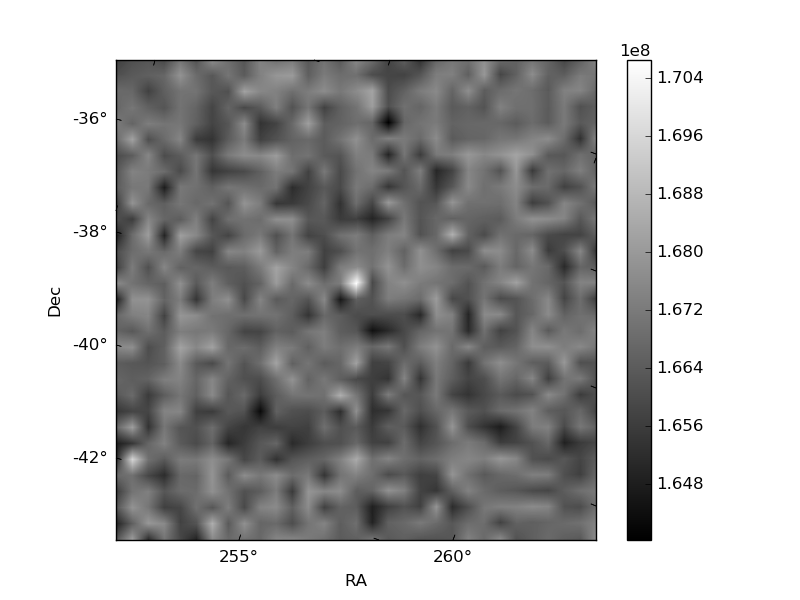
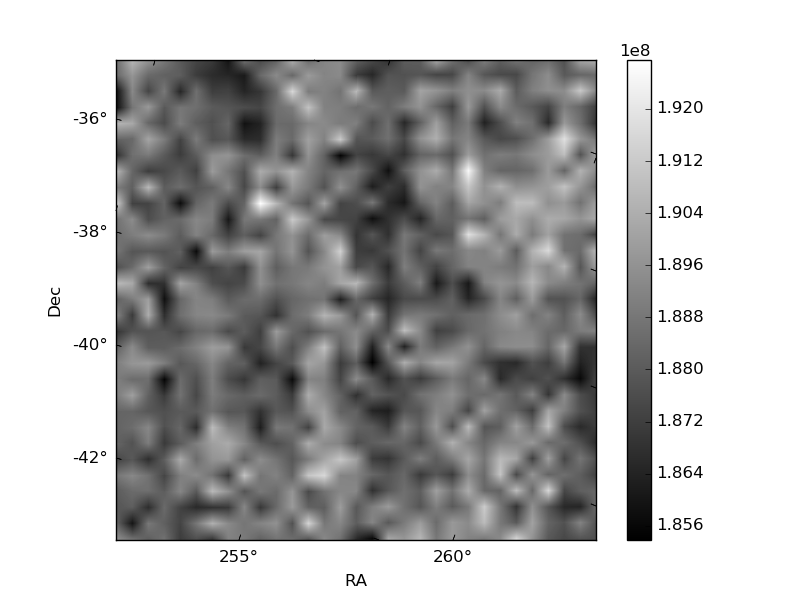
Histogram calculated using DETX and DETY for each event in the final _common_clean file
| Quadrant A | 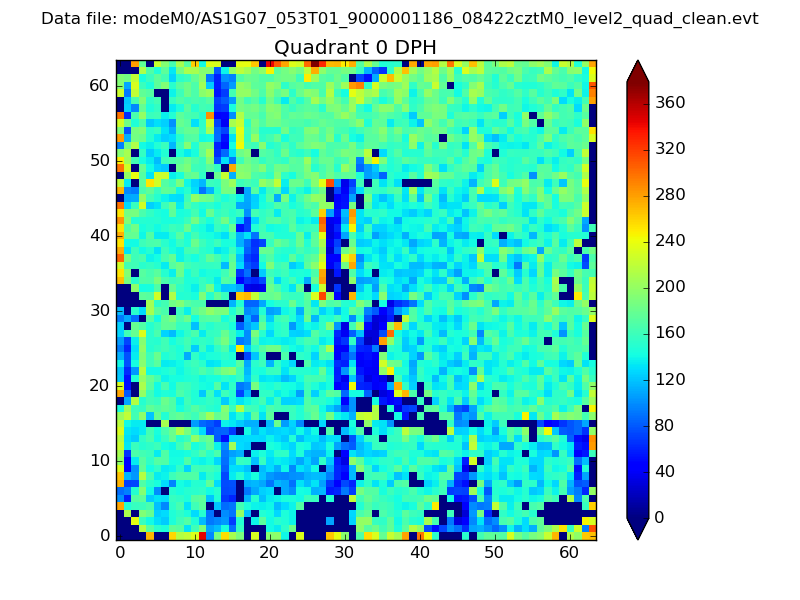 |
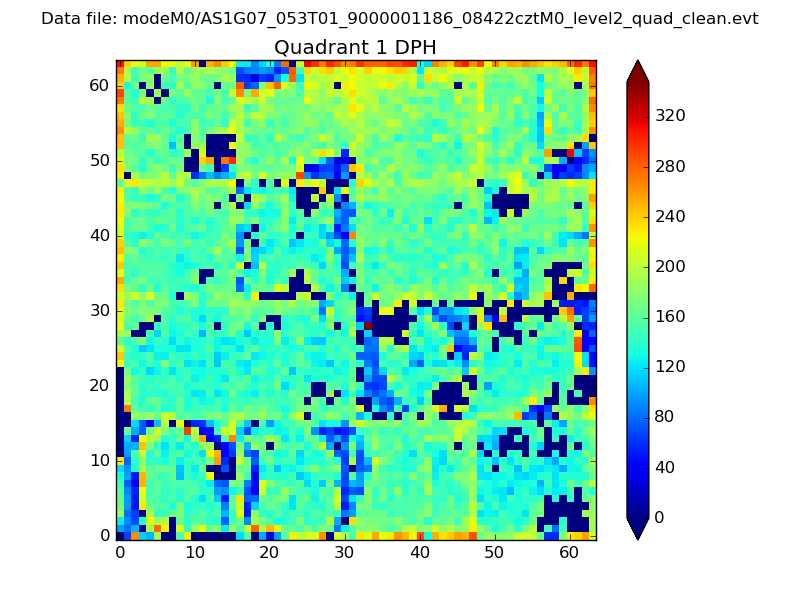 |
Quadrant B |
|---|---|---|---|
| Quadrant D | 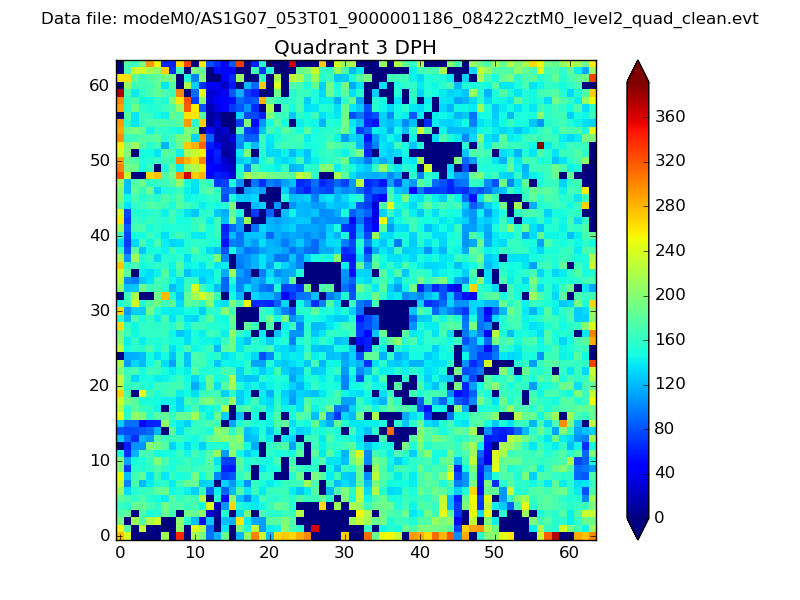 |
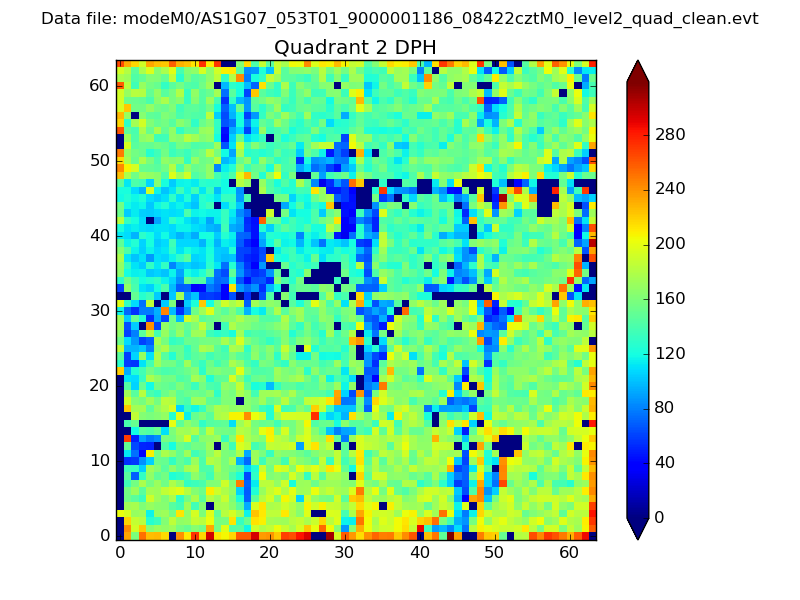 |
Quadrant C |
| Plot type | Count rate plots | Images |
|---|---|---|
| Comparison with Poisson distribution Blue bars denote a histogram of data divided into 1 sec bins. Red curve is a Poisson curve with rate = median count rate of data. |
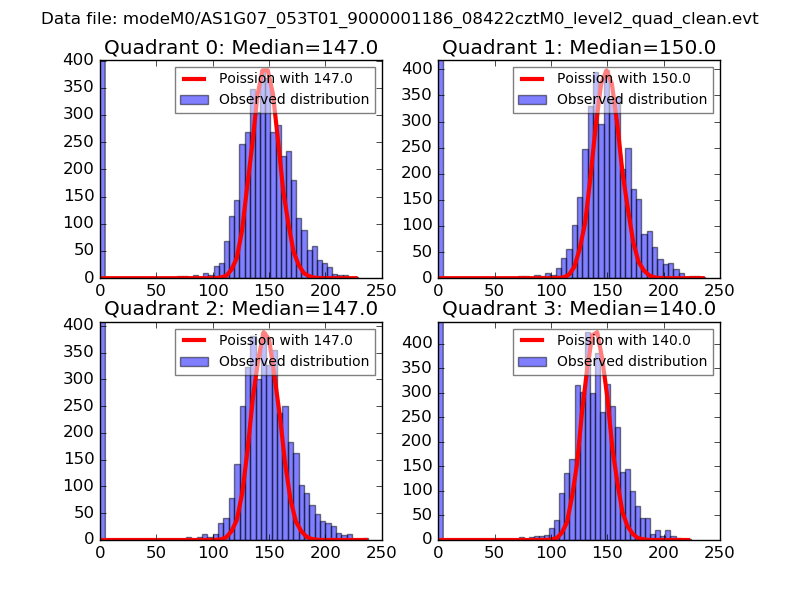 |
 |
| Quadrant-wise count rates Data is divided into 100 sec bins |
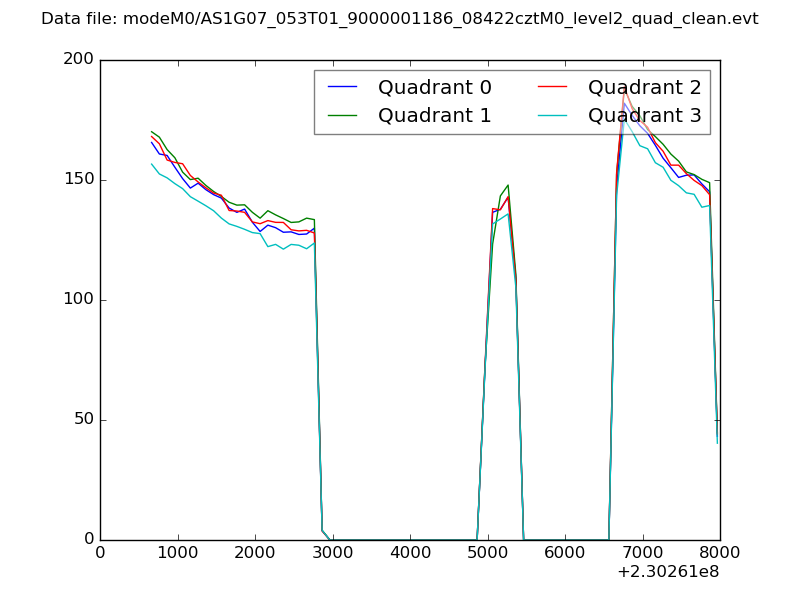 |
|
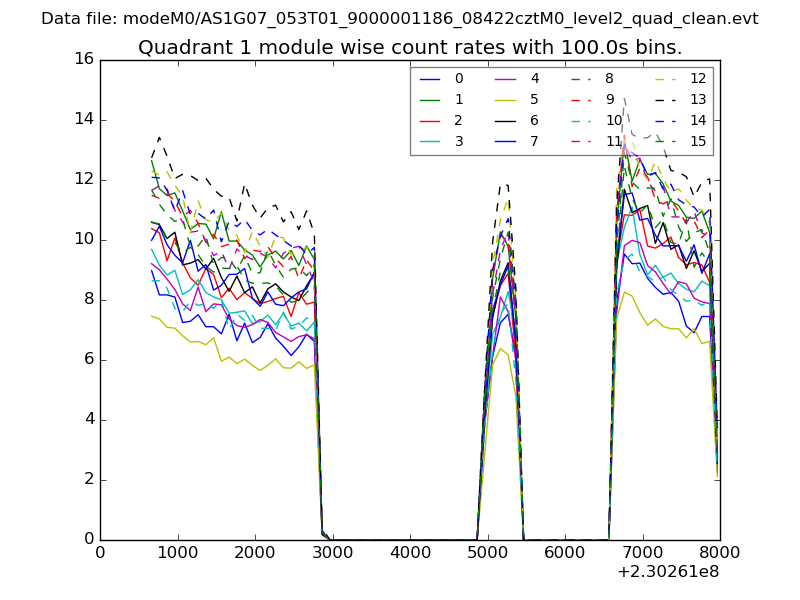
| Module-wise count rates for Quadrant A Data is divided into 100 sec bins |
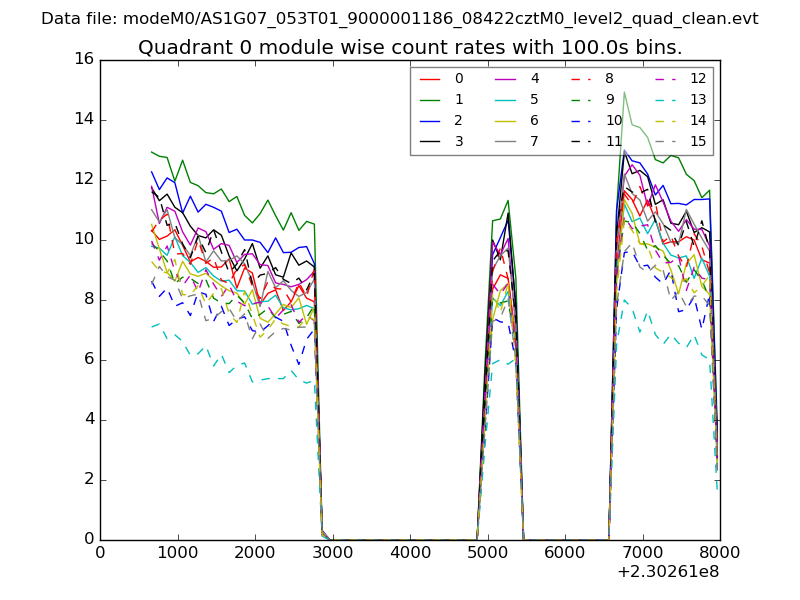 |
 |
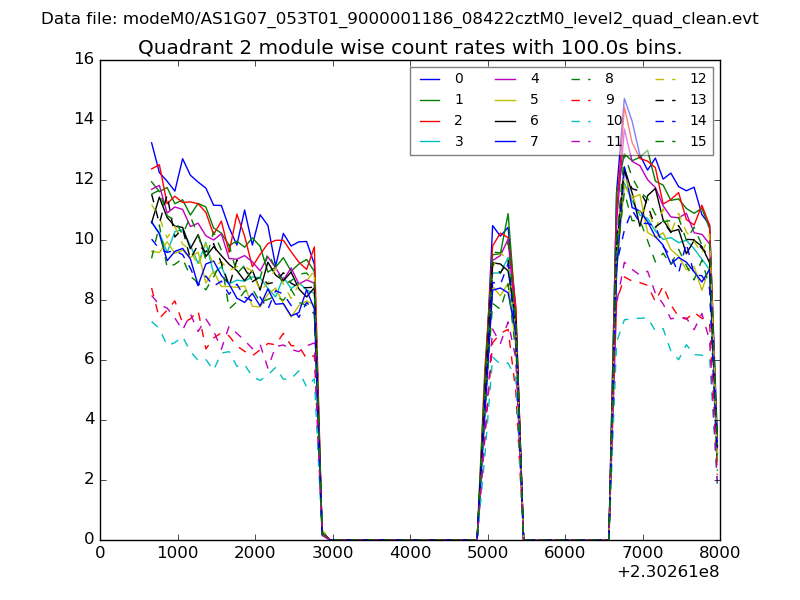
| Module-wise count rates for Quadrant B Data is divided into 100 sec bins |
 |
 |
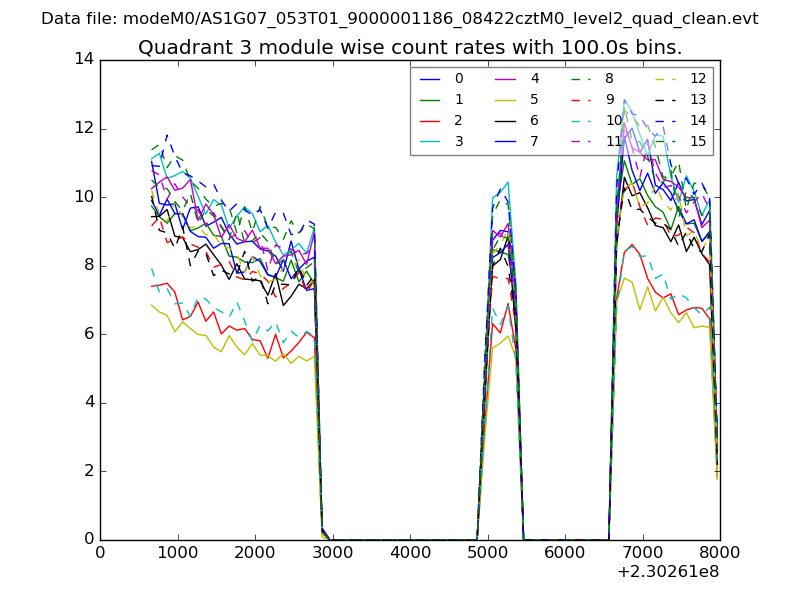
| Module-wise count rates for Quadrant C Data is divided into 100 sec bins |
 |
 |
| Module-wise count rates for Quadrant D Data is divided into 100 sec bins |
 |
 |
| Parameter | Plot |
|---|---|
| CZT HV Monitor | 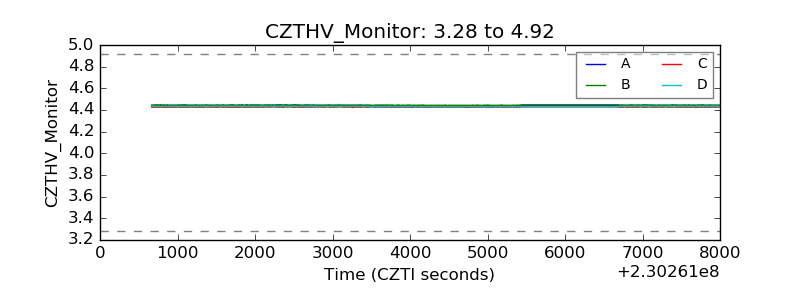 |
| D_VDD | 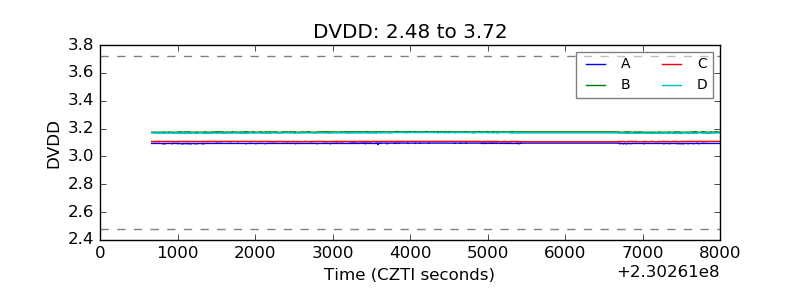 |
| Temperature 1 | 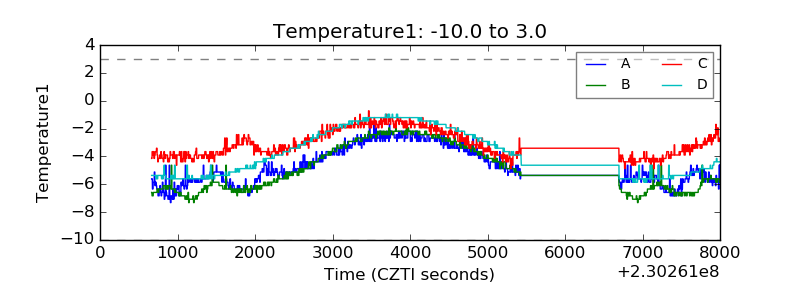 |
| Veto HV Monitor | 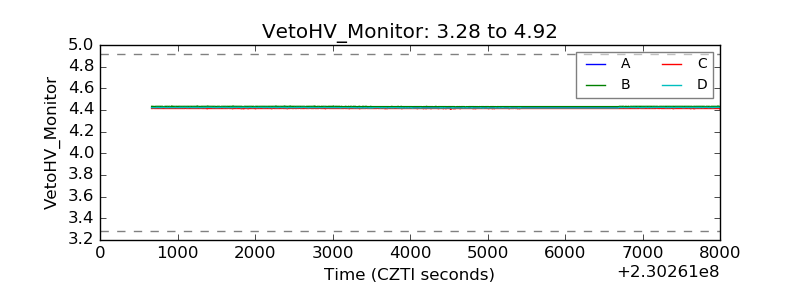 |
| Veto LLD | 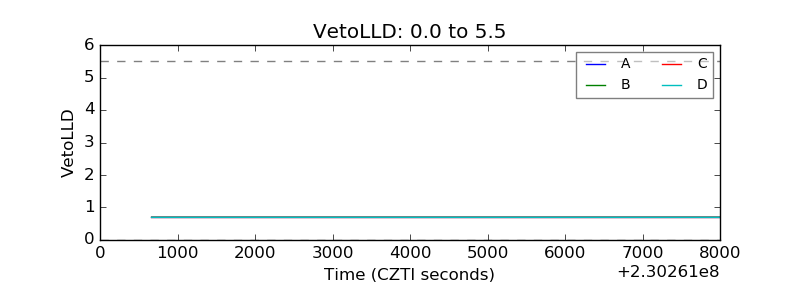 |
| Alpha Counter | 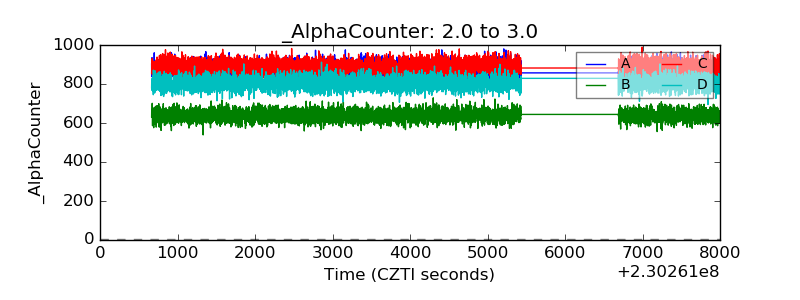 |
| _CPM_Rate | 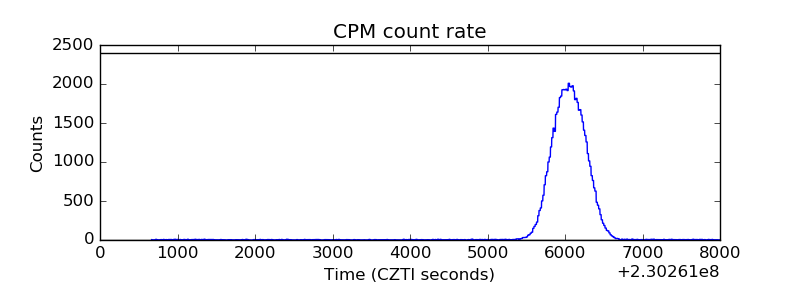 |
| CZT Counter | 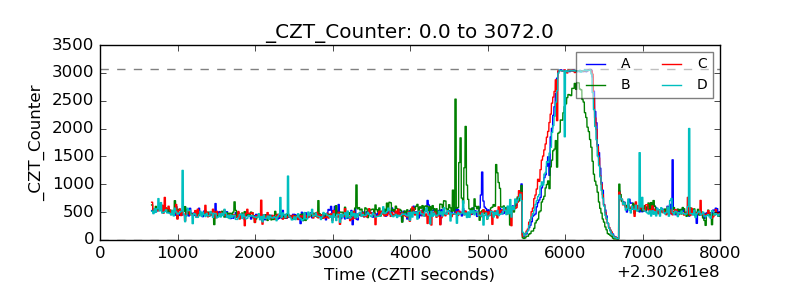 |
| +2.5 Volts monitor |  |
| +5 Volts monitor | 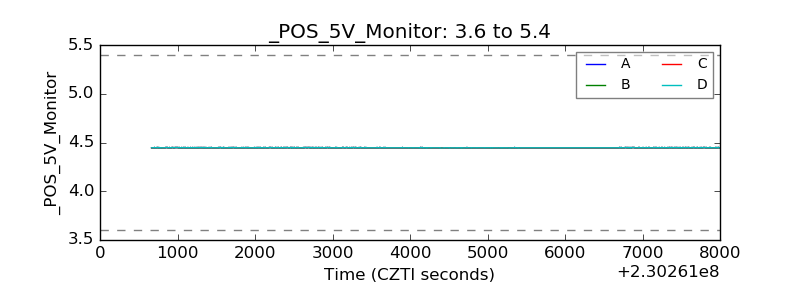 |
| _ROLL_ROT | 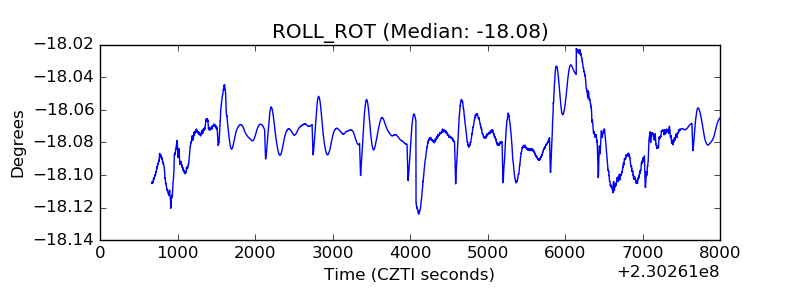 |
| _Roll_DEC | 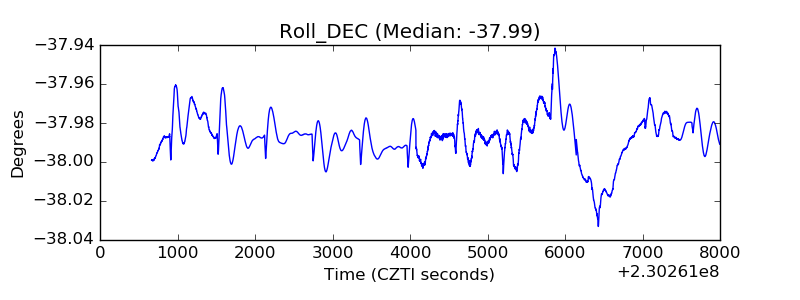 |
| _Roll_RA | 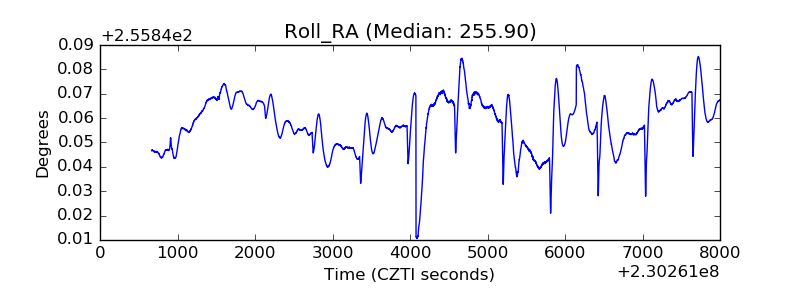 |
| Veto Counter | 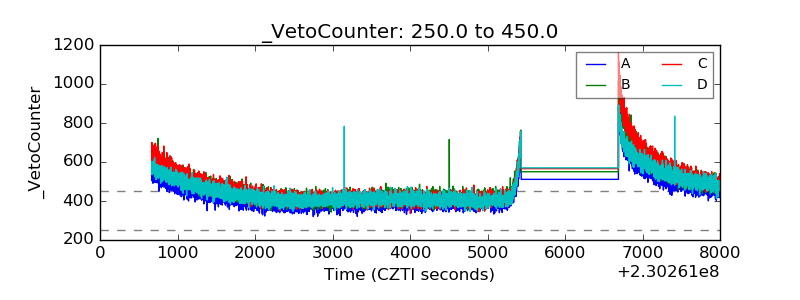 |