| Param | Original file | Final file |
|---|---|---|
| Filename | modeM0/AS1G07_053T01_9000001186_08425cztM0_level2.evt | modeM0/AS1G07_053T01_9000001186_08425cztM0_level2_quad_clean.evt |
| Size (bytes) | 334,128,960 | 50,716,800 |
| Size | 318.7 MB | 48.4 MB |
| Events in quadrant A | 2,070,070 | 315,253 |
| Events in quadrant B | 2,184,543 | 320,164 |
| Events in quadrant C | 1,966,631 | 313,838 |
| Events in quadrant D | 3,610,555 | 289,007 |
| Mode SS | |||
|---|---|---|---|
| Quadrant | BADHDUFLAG | Total packets | Discarded packets |
| A | 0 | 88 | 2 |
| B | 0 | 88 | 4 |
| C | 0 | 88 | 4 |
| D | 0 | 88 | 4 |
| Mode M0 | |||
|---|---|---|---|
| Quadrant | BADHDUFLAG | Total packets | Discarded packets |
| A | 0 | 9130 | 415 |
| B | 0 | 9319 | 388 |
| C | 0 | 8845 | 376 |
| D | 0 | 13896 | 396 |
| Quadrant | Total seconds | Saturated seconds | Saturation percentage |
|---|---|---|---|
| A | 4212 | 39 | 0.925926% |
| B | 4218 | 5 | 0.118540% |
| C | 4215 | 0 | 0.000000% |
| D | 4216 | 241 | 5.716319% |
Noise dominated data is calculated using 1-second bins in cleaned event files. If a bin has >2000 counts, and if more than 50% of those come from <1% of pixels, then it is considered to be noise-dominated and hence unusable.
| Quadrant | # 1 sec bins | Bins with >0 counts | Bins with >2000 counts | High rate bins dominated by noise | Noise dominated (total time) | Noise dominated (detector-on time) | Marked lightcurve |
|---|---|---|---|---|---|---|---|
| A | 4407 | 4277 | 7 | 7 | 0.16% | 0.16% | 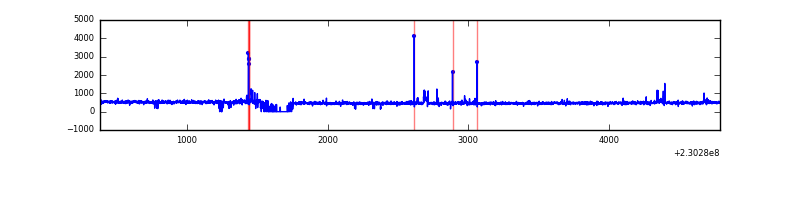 |
| B | 4407 | 4278 | 5 | 5 | 0.11% | 0.12% | 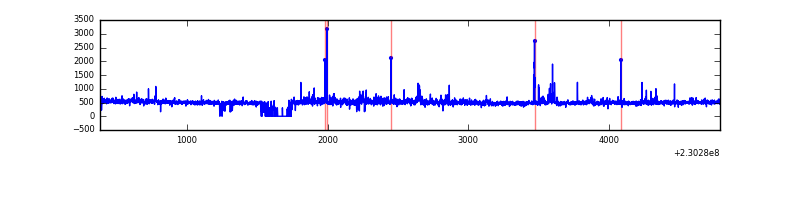 |
| C | 4407 | 4274 | 0 | 0 | 0.00% | 0.00% | 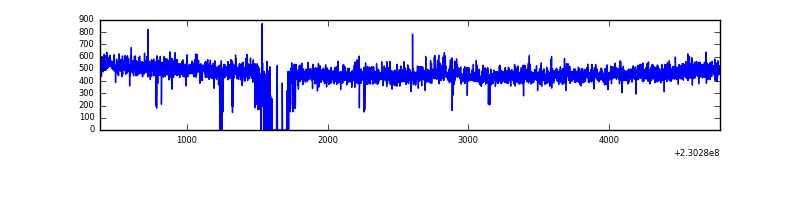 |
| D | 4407 | 4280 | 246 | 246 | 5.58% | 5.75% | 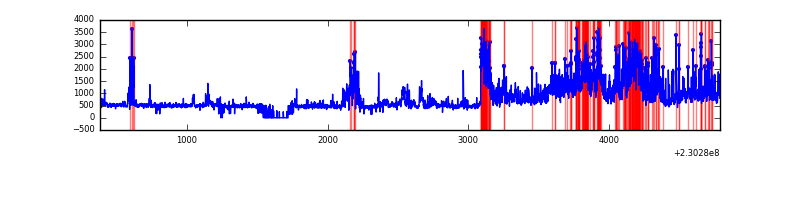 |
Top three noisy pixels from each quadrant. If the there are fewer than three noisy pixels in the level2.evt file, extra rows are filled as -1
| Pixel properties | Quadrant properties | ||||||
|---|---|---|---|---|---|---|---|
| Quadrant | DetID | PixID | Counts | Sigma | Mean | Median | Sigma |
| A | 14 | 111 | 45232 | 428.35 | 512 | 502 | 104.4 |
| A | 5 | 16 | 24992 | 234.52 | 512 | 502 | 104.4 |
| A | 15 | 236 | 23731 | 222.45 | 512 | 502 | 104.4 |
| B | 0 | 214 | 93900 | 961.02 | 513 | 502 | 97.2 |
| B | 4 | 81 | 23790 | 239.62 | 513 | 502 | 97.2 |
| B | 4 | 173 | 15169 | 150.92 | 513 | 502 | 97.2 |
| C | 14 | 67 | 12895 | 106.43 | 499 | 501 | 116.4 |
| C | 9 | 160 | 4018 | 30.2 | 499 | 501 | 116.4 |
| C | 13 | 61 | 3633 | 26.89 | 499 | 501 | 116.4 |
| D | 12 | 221 | 1129348 | 8598.85 | 490 | 478 | 131.3 |
| D | 1 | 52 | 278865 | 2120.54 | 490 | 478 | 131.3 |
| D | 12 | 227 | 188472 | 1431.99 | 490 | 478 | 131.3 |
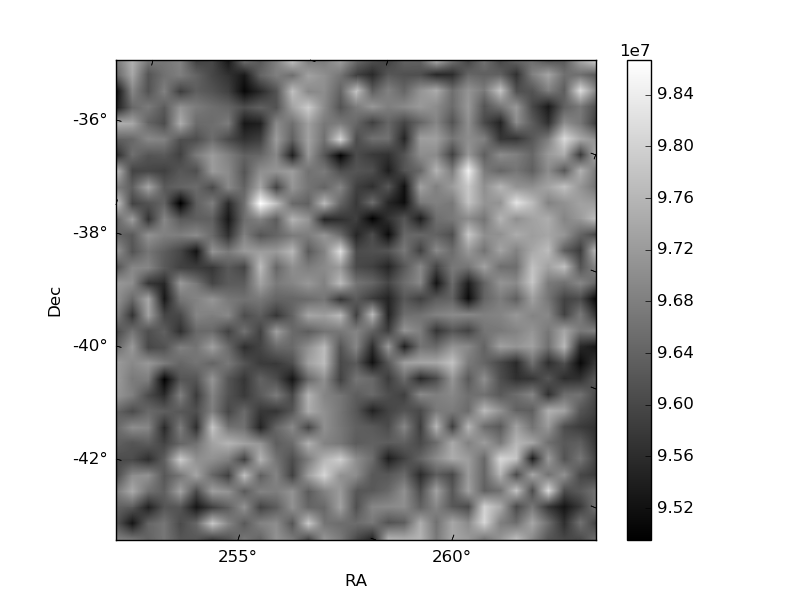
Histogram calculated using DETX and DETY for each event in the final _common_clean file
| Quadrant A | 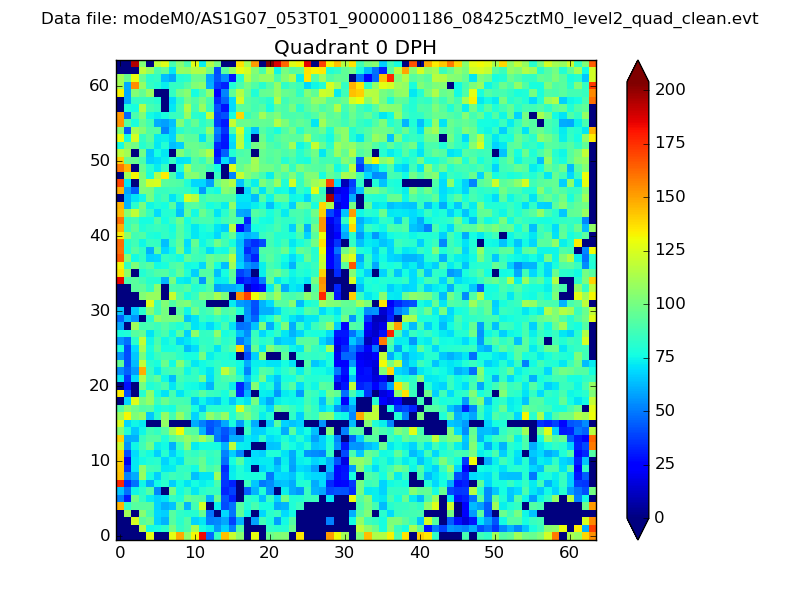 |
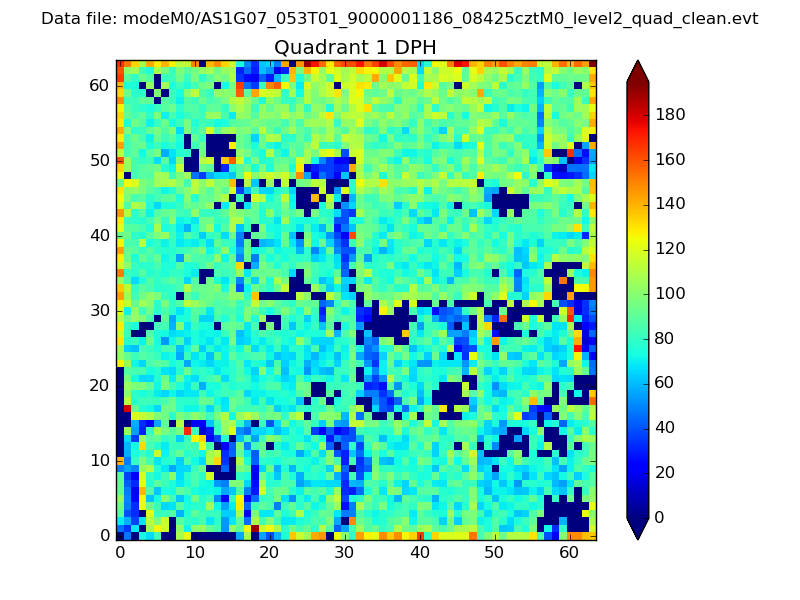 |
Quadrant B |
|---|---|---|---|
| Quadrant D | 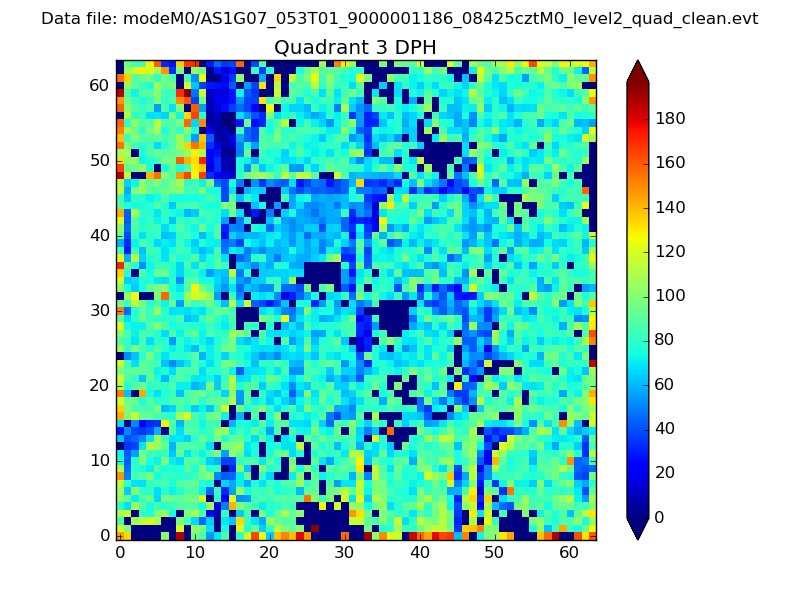 |
 |
Quadrant C |
| Plot type | Count rate plots | Images |
|---|---|---|
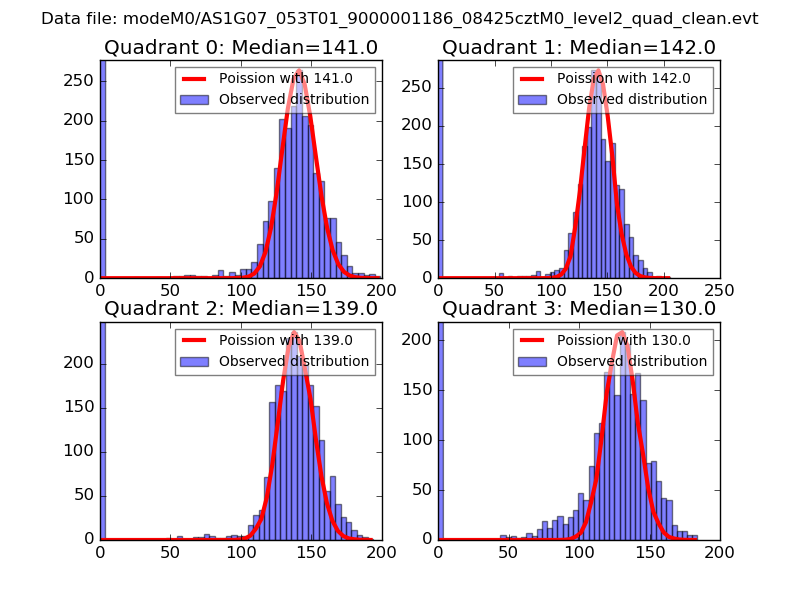
| Comparison with Poisson distribution Blue bars denote a histogram of data divided into 1 sec bins. Red curve is a Poisson curve with rate = median count rate of data. |
 |
 |
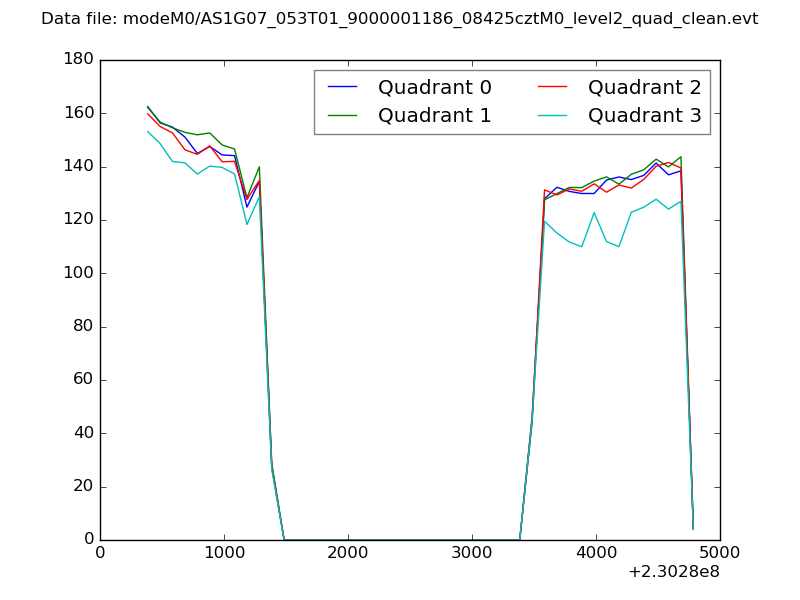
| Quadrant-wise count rates Data is divided into 100 sec bins |
 |
|
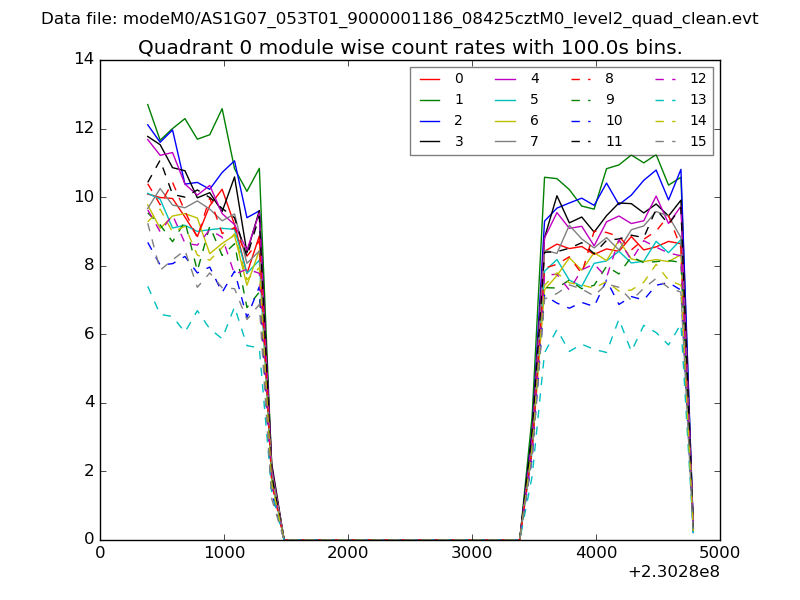
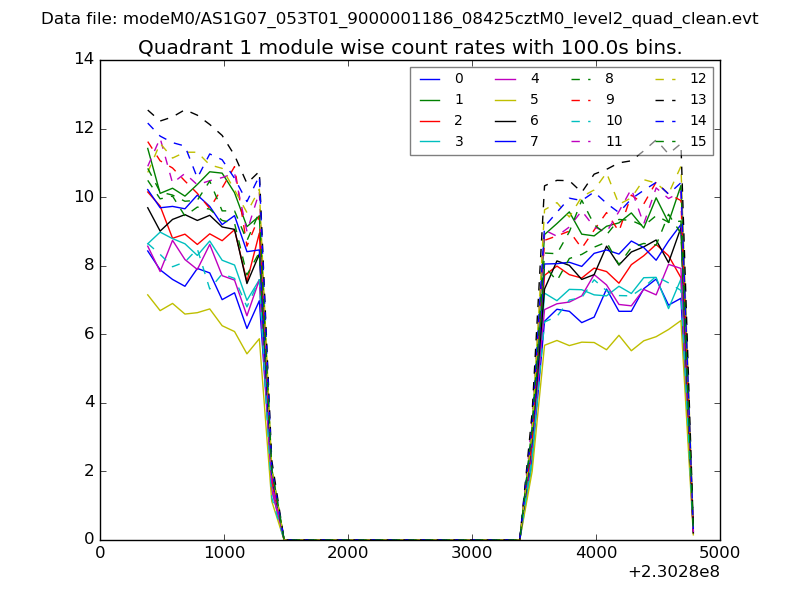
| Module-wise count rates for Quadrant A Data is divided into 100 sec bins |
 |
 |
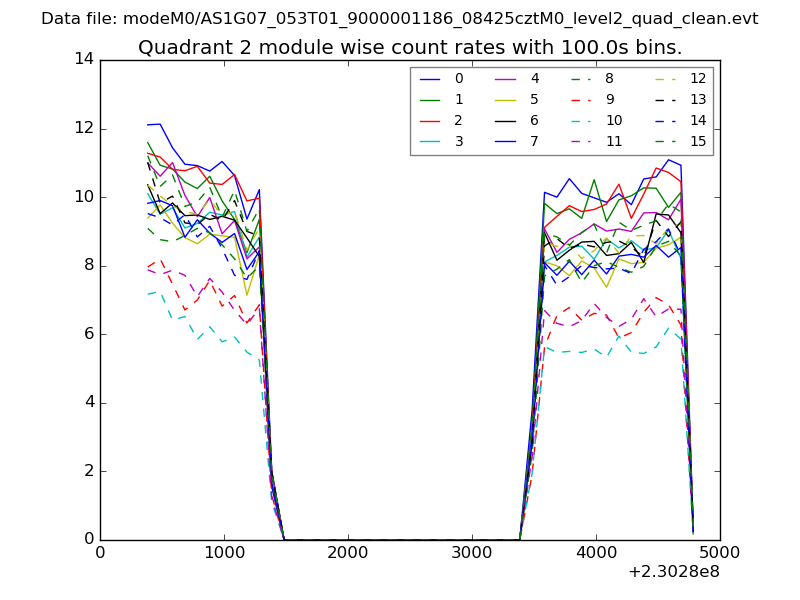
| Module-wise count rates for Quadrant B Data is divided into 100 sec bins |
 |
 |
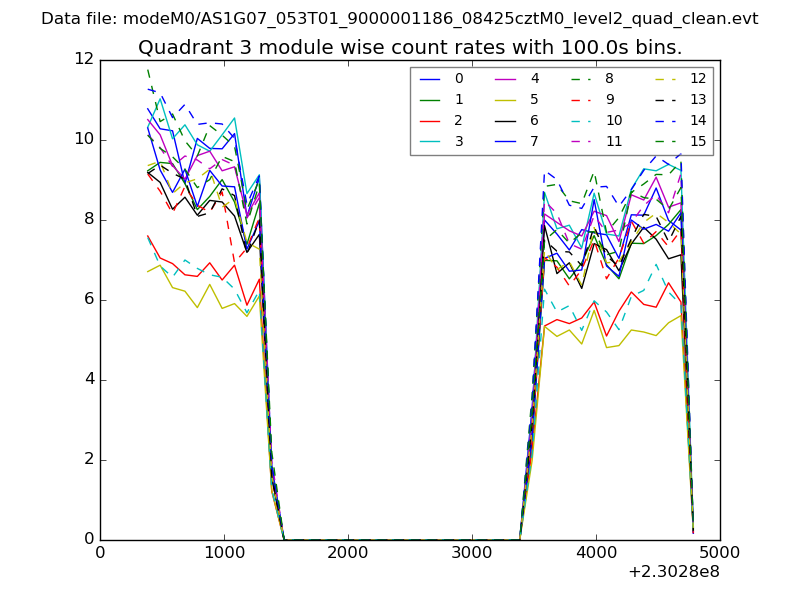
| Module-wise count rates for Quadrant C Data is divided into 100 sec bins |
 |
 |
| Module-wise count rates for Quadrant D Data is divided into 100 sec bins |
 |
 |
| Parameter | Plot |
|---|---|
| CZT HV Monitor | 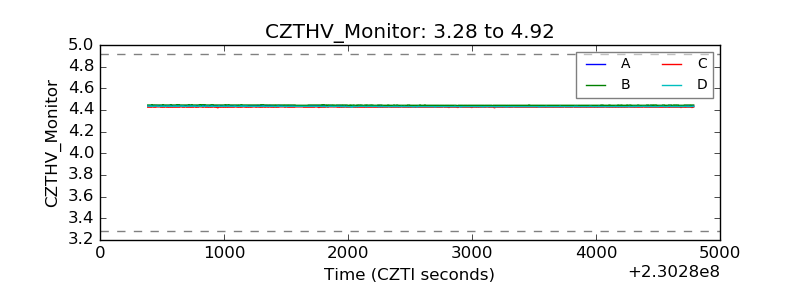 |
| D_VDD | 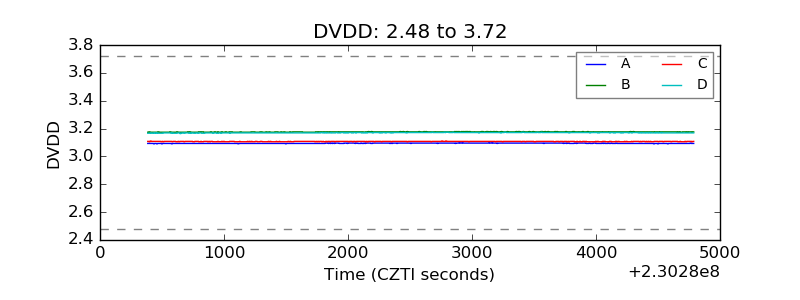 |
| Temperature 1 | 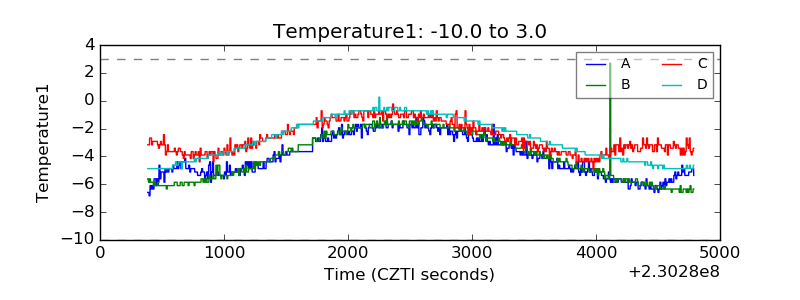 |
| Veto HV Monitor | 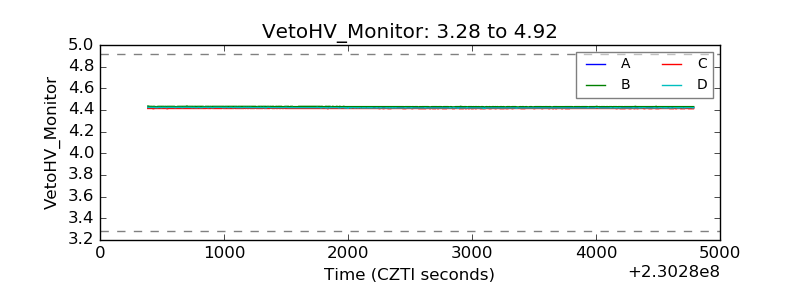 |
| Veto LLD | 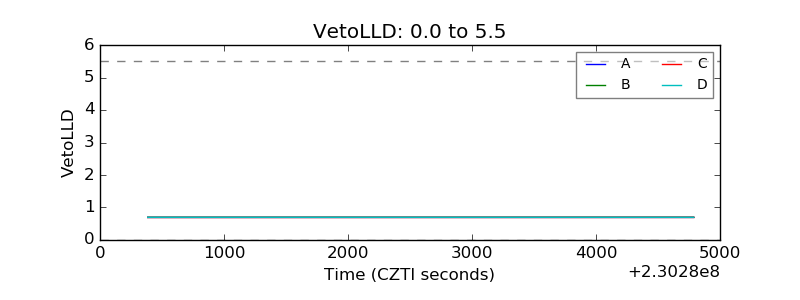 |
| Alpha Counter | 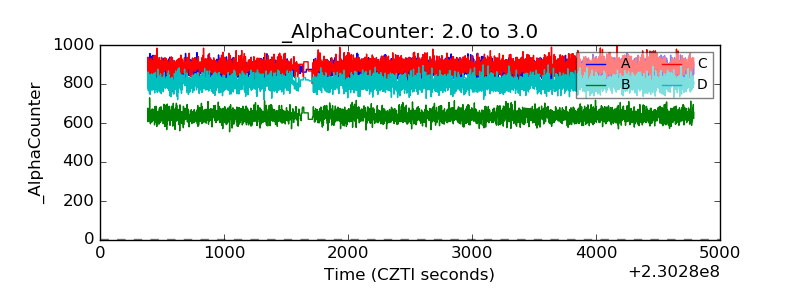 |
| _CPM_Rate | 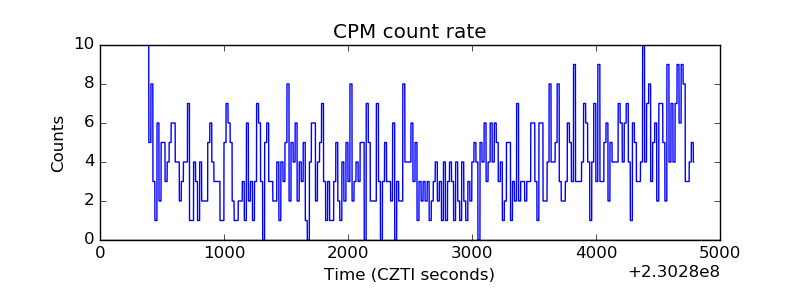 |
| CZT Counter |  |
| +2.5 Volts monitor |  |
| +5 Volts monitor | 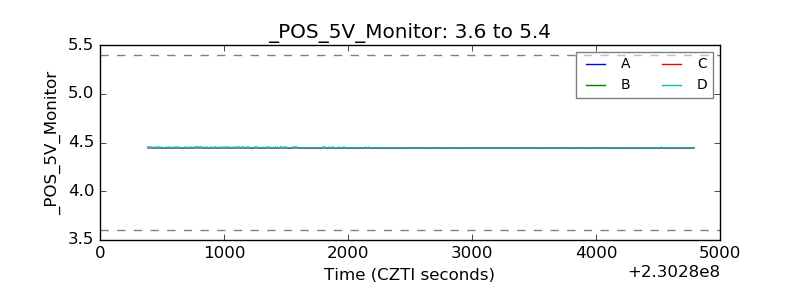 |
| _ROLL_ROT | 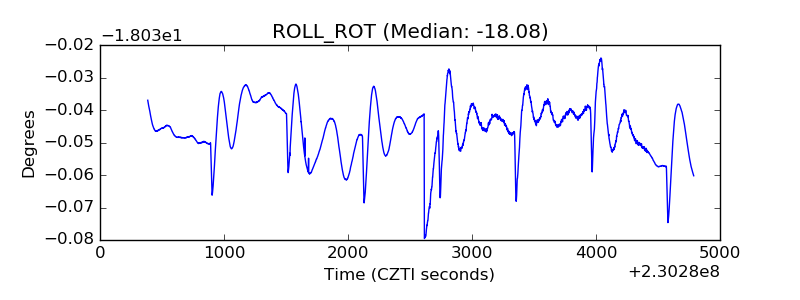 |
| _Roll_DEC | 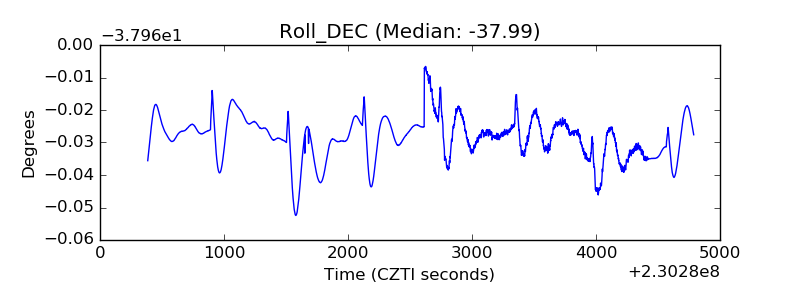 |
| _Roll_RA | 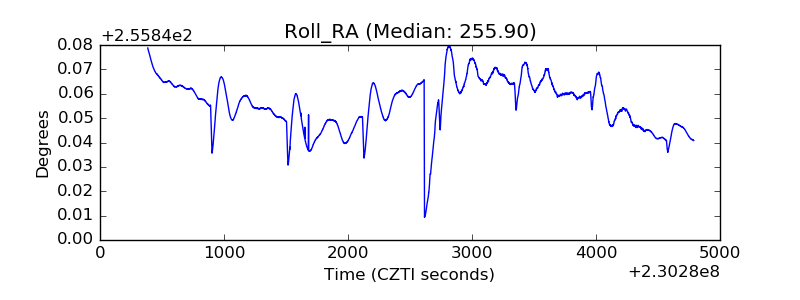 |
| Veto Counter | 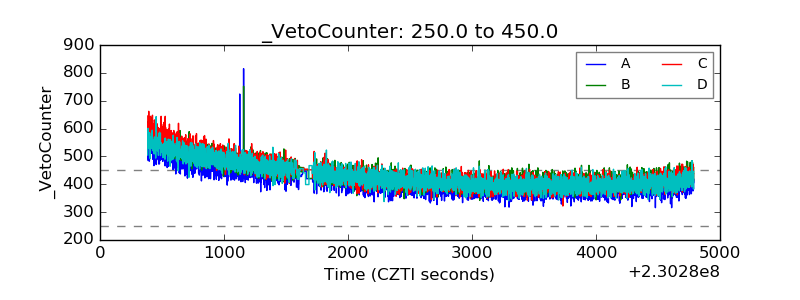 |