| Param | Original file | Final file |
|---|---|---|
| Filename | modeM0/AS1A03_084T01_9000001188cztM0_level2.fits | modeM0/AS1A03_084T01_9000001188cztM0_level2_quad_clean.evt |
| Size (bytes) | 240,727,680 | 236,361,600 |
| Size | 229.6 MB | 225.4 MB |
| Events in quadrant A | 1,470,156 | 1,431,356 |
| Events in quadrant B | 1,422,276 | 1,432,383 |
| Events in quadrant C | 1,450,296 | 1,356,781 |
| Events in quadrant D | 1,136,944 | 1,128,820 |
| Mode M9 | |||
|---|---|---|---|
| Quadrant | BADHDUFLAG | Total packets | Discarded packets |
| A | 0 | 26 | 0 |
| B | 0 | 26 | 0 |
| C | 0 | 26 | 0 |
| D | 0 | 26 | 0 |
| Mode SS | |||
|---|---|---|---|
| Quadrant | BADHDUFLAG | Total packets | Discarded packets |
| A | 0 | 534 | 0 |
| B | 0 | 534 | 0 |
| C | 0 | 534 | 0 |
| D | 0 | 534 | 0 |
| Mode M0 | |||
|---|---|---|---|
| Quadrant | BADHDUFLAG | Total packets | Discarded packets |
| A | 0 | 55718 | 0 |
| B | 0 | 56950 | 0 |
| C | 0 | 59363 | 0 |
| D | 0 | 84264 | 0 |
| Quadrant | Total seconds | Saturated seconds | Saturation percentage |
|---|---|---|---|
| A | 26294 | 778 | 2.958850% |
| B | 26294 | 841 | 3.198448% |
| C | 26290 | 985 | 3.746672% |
| D | 26295 | 3994 | 15.189199% |
Noise dominated data is calculated using 1-second bins in cleaned event files. If a bin has >2000 counts, and if more than 50% of those come from <1% of pixels, then it is considered to be noise-dominated and hence unusable.
| Quadrant | # 1 sec bins | Bins with >0 counts | Bins with >2000 counts | High rate bins dominated by noise | Noise dominated (total time) | Noise dominated (detector-on time) | Marked lightcurve |
|---|---|---|---|---|---|---|---|
| A | 28952 | 26293 | 0 | 0 | 0.00% | 0.00% |  |
| B | 28952 | 26295 | 0 | 0 | 0.00% | 0.00% |  |
| C | 28952 | 26294 | 0 | 0 | 0.00% | 0.00% |  |
| D | 28952 | 25732 | 0 | 0 | 0.00% | 0.00% |  |
Top three noisy pixels from each quadrant. If the there are fewer than three noisy pixels in the level2.evt file, extra rows are filled as -1
| Pixel properties | Quadrant properties | ||||||
|---|---|---|---|---|---|---|---|
| Quadrant | DetID | PixID | Counts | Sigma | Mean | Median | Sigma |
| A | 14 | 188 | 1475 | 11.57 | 381 | 356 | 96.7 |
| A | 0 | 29 | 1460 | 11.41 | 381 | 356 | 96.7 |
| A | 14 | 204 | 1241 | 9.15 | 381 | 356 | 96.7 |
| B | 2 | 9 | 1214 | 10.91 | 375 | 354 | 78.8 |
| B | 3 | 17 | 1003 | 8.24 | 375 | 354 | 78.8 |
| B | 5 | 232 | 992 | 8.1 | 375 | 354 | 78.8 |
| C | 12 | 241 | 1054 | 6.79 | 383 | 353 | 103.3 |
| C | 1 | 80 | 1034 | 6.6 | 383 | 353 | 103.3 |
| C | 1 | 81 | 1008 | 6.34 | 383 | 353 | 103.3 |
| D | 3 | 14 | 849 | 6.32 | 323 | 292 | 88.2 |
| D | 6 | 231 | 838 | 6.19 | 323 | 292 | 88.2 |
| D | 7 | 5 | 828 | 6.08 | 323 | 292 | 88.2 |
Histogram calculated using DETX and DETY for each event in the final _common_clean file
| Quadrant A | 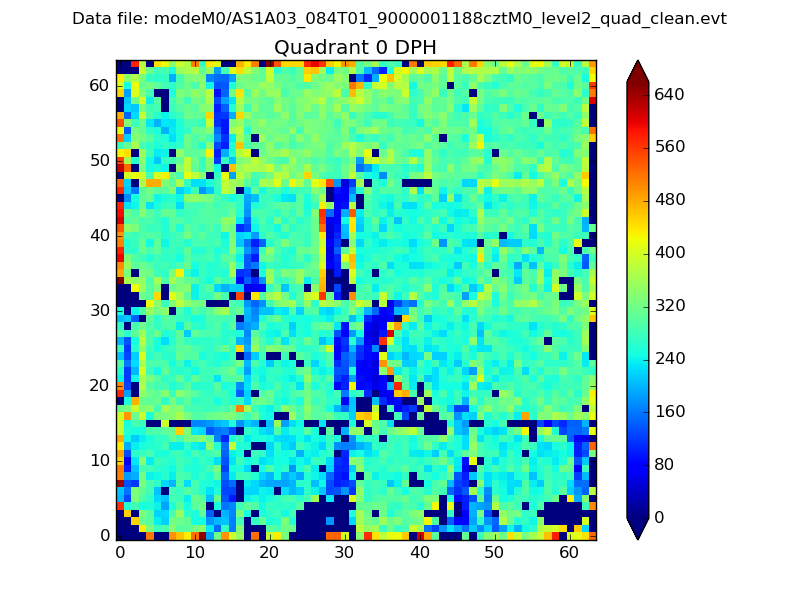 |
 |
Quadrant B |
|---|---|---|---|
| Quadrant D | 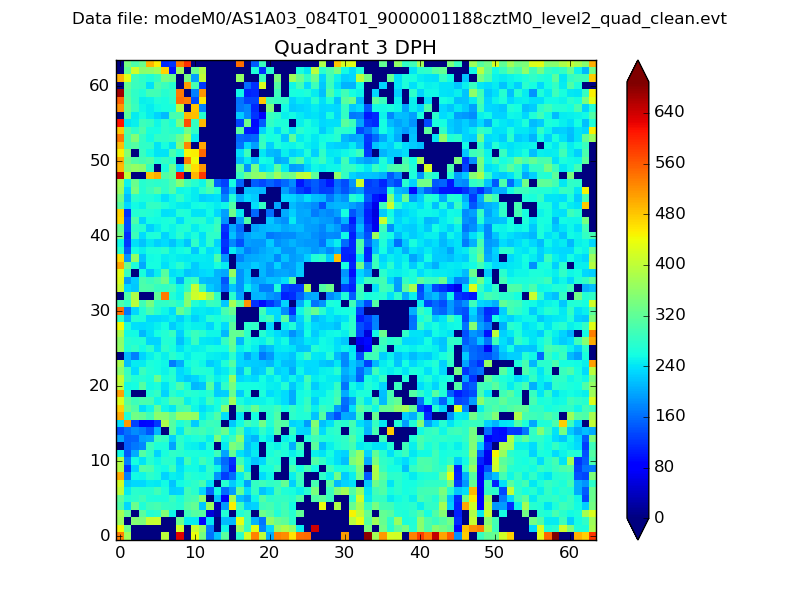 |
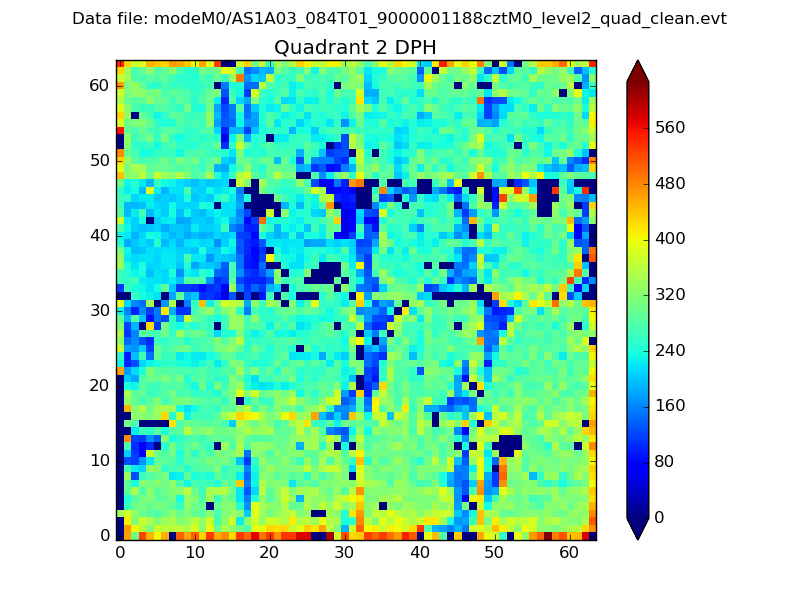 |
Quadrant C |
| Plot type | Count rate plots | Images |
|---|---|---|
| Comparison with Poisson distribution Blue bars denote a histogram of data divided into 1 sec bins. Red curve is a Poisson curve with rate = median count rate of data. |
 |
 |
| Quadrant-wise count rates Data is divided into 100 sec bins |
 |
|
| Module-wise count rates for Quadrant A Data is divided into 100 sec bins |
 |
 |
| Module-wise count rates for Quadrant B Data is divided into 100 sec bins |
 |
 |
| Module-wise count rates for Quadrant C Data is divided into 100 sec bins |
 |
 |
| Module-wise count rates for Quadrant D Data is divided into 100 sec bins |
 |
 |
| Parameter | Plot |
|---|---|
| CZT HV Monitor |  |
| D_VDD |  |
| Temperature 1 |  |
| Veto HV Monitor |  |
| Veto LLD |  |
| Alpha Counter |  |
| _CPM_Rate |  |
| CZT Counter |  |
| +2.5 Volts monitor |  |
| +5 Volts monitor |  |
| _ROLL_ROT |  |
| _Roll_DEC | 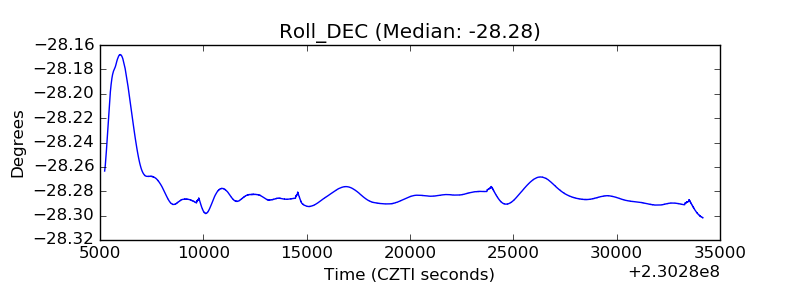 |
| _Roll_RA |  |
| Veto Counter |  |