| Param | Original file | Final file |
|---|---|---|
| Filename | modeM0/AS1A03_084T01_9000001188_08425cztM0_level2.evt | modeM0/AS1A03_084T01_9000001188_08425cztM0_level2_quad_clean.evt |
| Size (bytes) | 109,483,200 | 19,310,400 |
| Size | 104.4 MB | 18.4 MB |
| Events in quadrant A | 700,292 | 121,783 |
| Events in quadrant B | 712,712 | 125,025 |
| Events in quadrant C | 691,373 | 121,914 |
| Events in quadrant D | 1,116,362 | 114,127 |
| Mode M9 | |||
|---|---|---|---|
| Quadrant | BADHDUFLAG | Total packets | Discarded packets |
| A | 0 | 12 | 0 |
| B | 0 | 12 | 0 |
| C | 0 | 12 | 0 |
| D | 0 | 12 | 0 |
| Mode SS | |||
|---|---|---|---|
| Quadrant | BADHDUFLAG | Total packets | Discarded packets |
| A | 0 | 28 | 0 |
| B | 0 | 28 | 0 |
| C | 0 | 28 | 0 |
| D | 0 | 28 | 0 |
| Mode M0 | |||
|---|---|---|---|
| Quadrant | BADHDUFLAG | Total packets | Discarded packets |
| A | 0 | 2867 | 2 |
| B | 0 | 2894 | 3 |
| C | 0 | 2868 | 5 |
| D | 0 | 4215 | 9 |
| Quadrant | Total seconds | Saturated seconds | Saturation percentage |
|---|---|---|---|
| A | 1361 | 49 | 3.600294% |
| B | 1360 | 45 | 3.308824% |
| C | 1359 | 43 | 3.164091% |
| D | 1359 | 102 | 7.505519% |
Noise dominated data is calculated using 1-second bins in cleaned event files. If a bin has >2000 counts, and if more than 50% of those come from <1% of pixels, then it is considered to be noise-dominated and hence unusable.
| Quadrant | # 1 sec bins | Bins with >0 counts | Bins with >2000 counts | High rate bins dominated by noise | Noise dominated (total time) | Noise dominated (detector-on time) | Marked lightcurve |
|---|---|---|---|---|---|---|---|
| A | 2526 | 1361 | 0 | 0 | 0.00% | 0.00% |  |
| B | 2526 | 1361 | 1 | 1 | 0.04% | 0.07% |  |
| C | 2526 | 1361 | 0 | 0 | 0.00% | 0.00% |  |
| D | 2526 | 1361 | 48 | 48 | 1.90% | 3.53% | 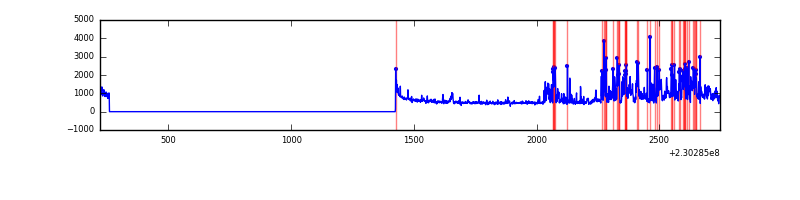 |
Top three noisy pixels from each quadrant. If the there are fewer than three noisy pixels in the level2.evt file, extra rows are filled as -1
| Pixel properties | Quadrant properties | ||||||
|---|---|---|---|---|---|---|---|
| Quadrant | DetID | PixID | Counts | Sigma | Mean | Median | Sigma |
| A | 13 | 14 | 5413 | 134.21 | 180 | 175 | 39.0 |
| A | 14 | 111 | 1950 | 45.48 | 180 | 175 | 39.0 |
| A | 0 | 226 | 1648 | 37.74 | 180 | 175 | 39.0 |
| B | 0 | 214 | 8148 | 218.26 | 178 | 174 | 36.5 |
| B | 11 | 51 | 4096 | 107.35 | 178 | 174 | 36.5 |
| B | 12 | 111 | 3676 | 95.85 | 178 | 174 | 36.5 |
| C | 14 | 67 | 4240 | 95.67 | 175 | 176 | 42.5 |
| C | 13 | 61 | 1244 | 25.14 | 175 | 176 | 42.5 |
| C | 7 | 159 | 633 | 10.76 | 175 | 176 | 42.5 |
| D | 12 | 233 | 243832 | 5483.49 | 175 | 169 | 44.4 |
| D | 12 | 221 | 161696 | 3635.07 | 175 | 169 | 44.4 |
| D | 1 | 52 | 35436 | 793.66 | 175 | 169 | 44.4 |
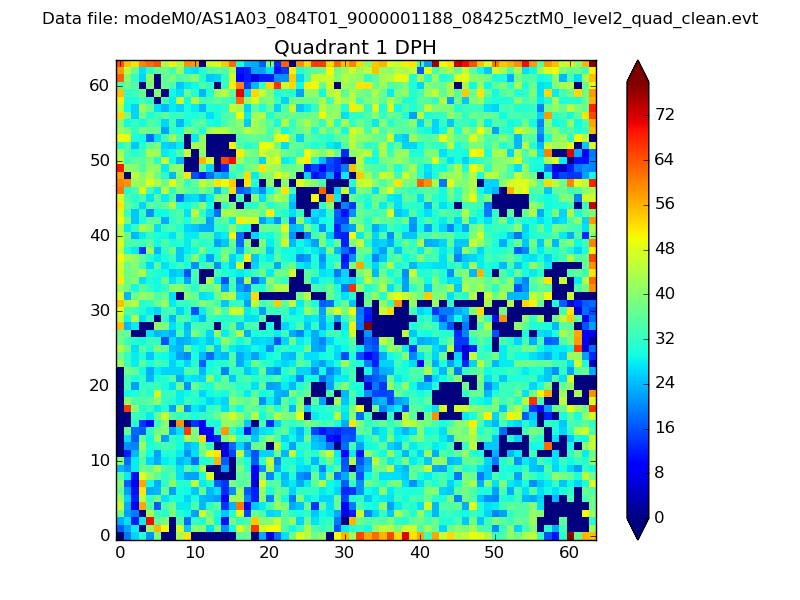
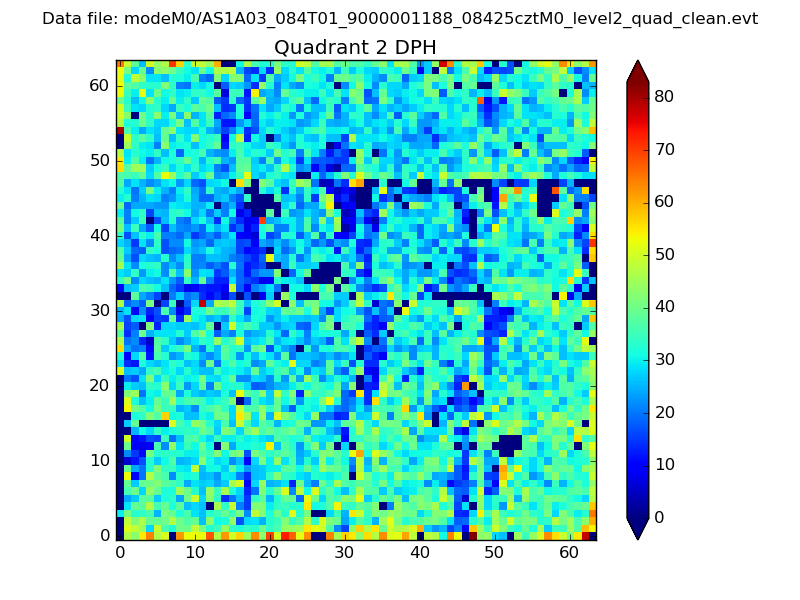
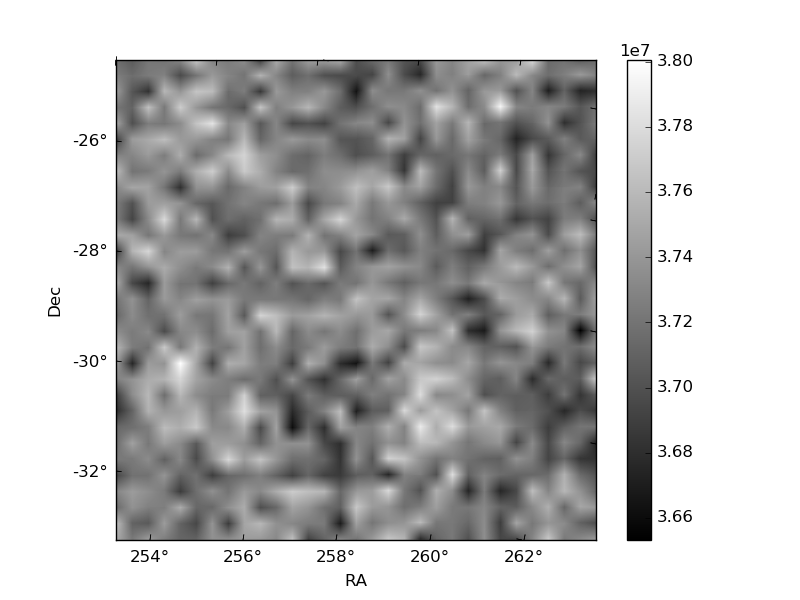
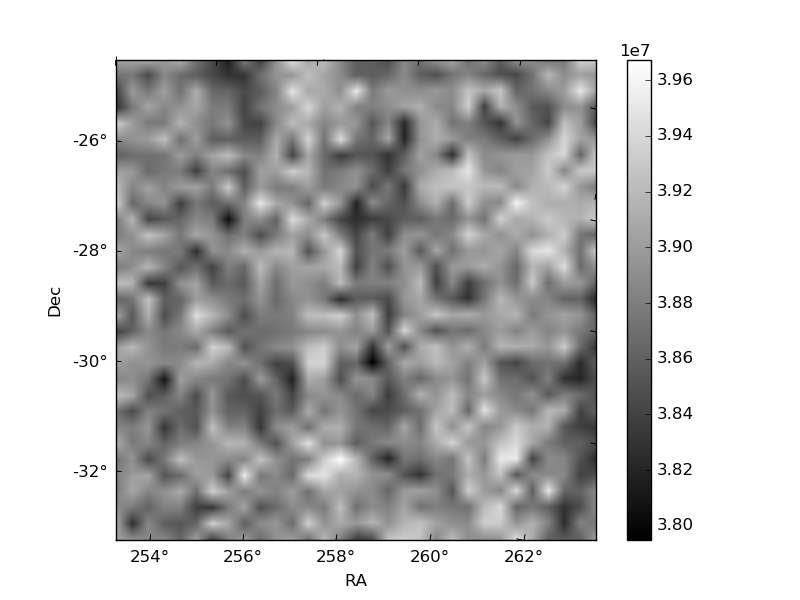
Histogram calculated using DETX and DETY for each event in the final _common_clean file
| Quadrant A | 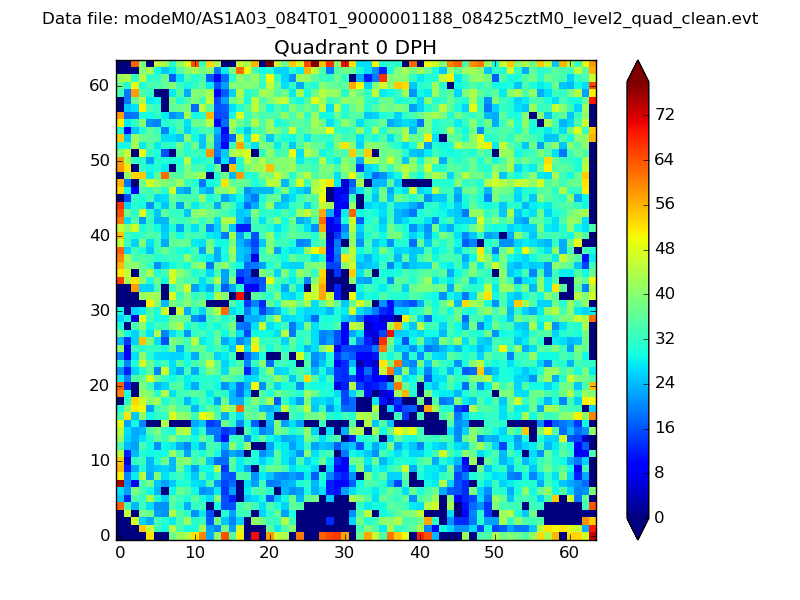 |
 |
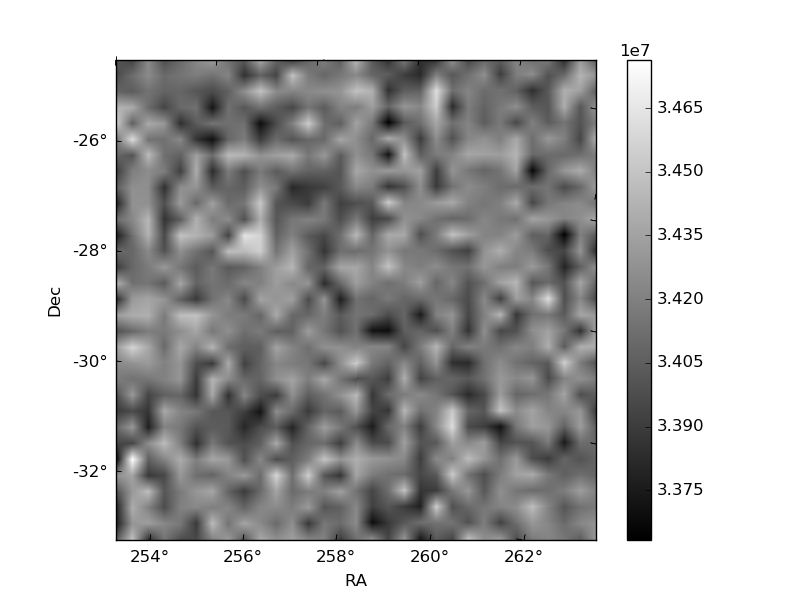
Quadrant B |
|---|---|---|---|
| Quadrant D | 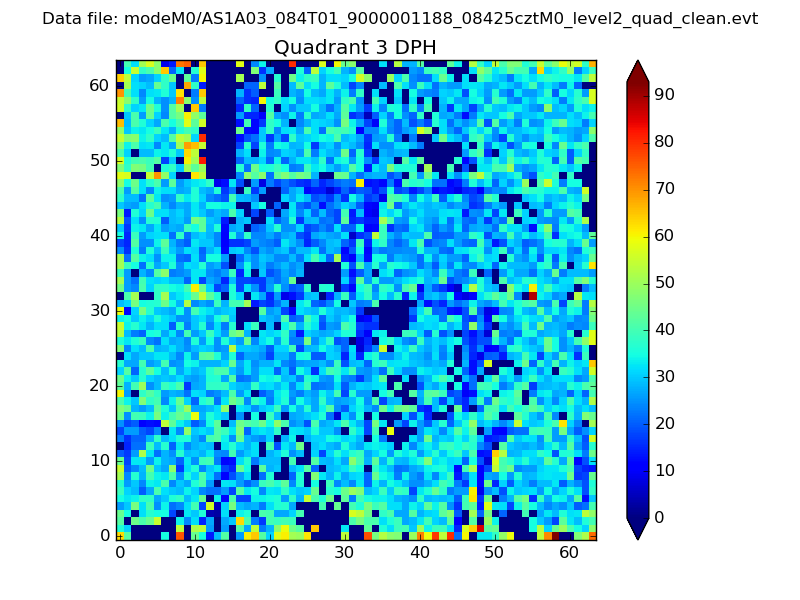 |
 |
Quadrant C |
| Plot type | Count rate plots | Images |
|---|---|---|
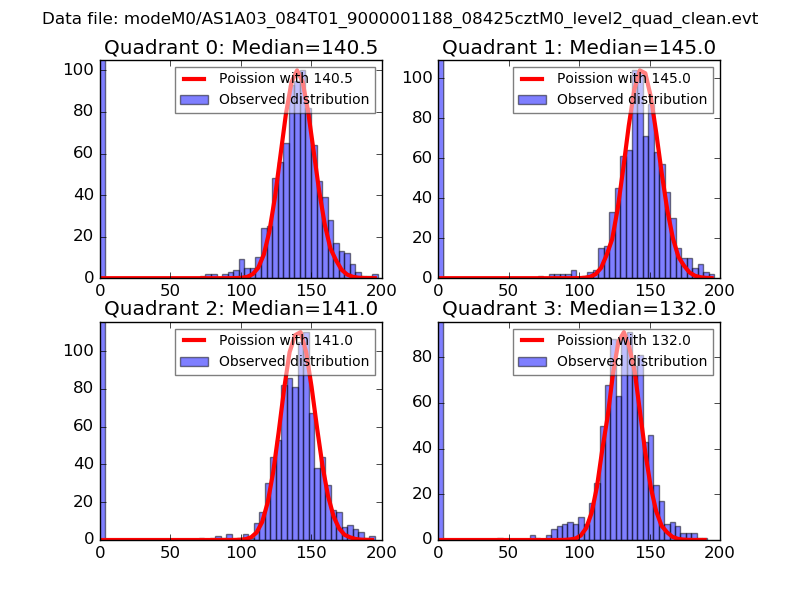
| Comparison with Poisson distribution Blue bars denote a histogram of data divided into 1 sec bins. Red curve is a Poisson curve with rate = median count rate of data. |
 |
 |
| Quadrant-wise count rates Data is divided into 100 sec bins |
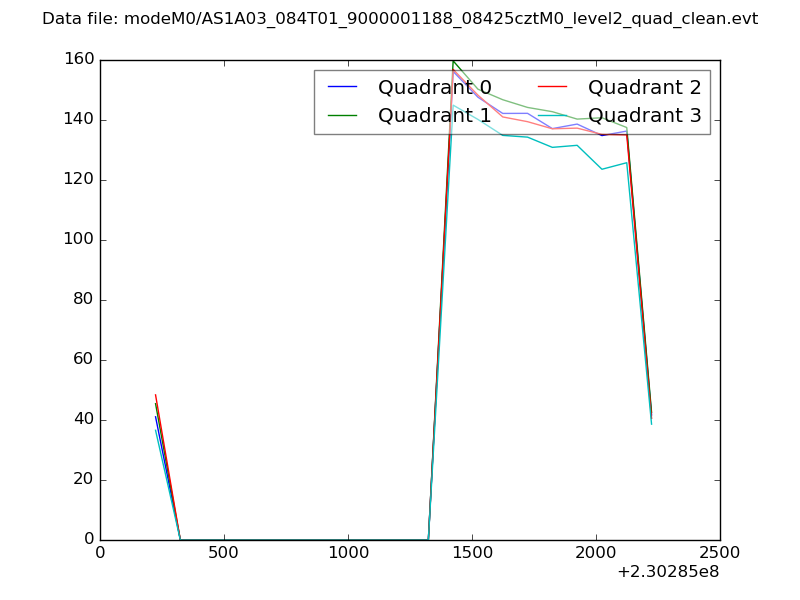 |
|
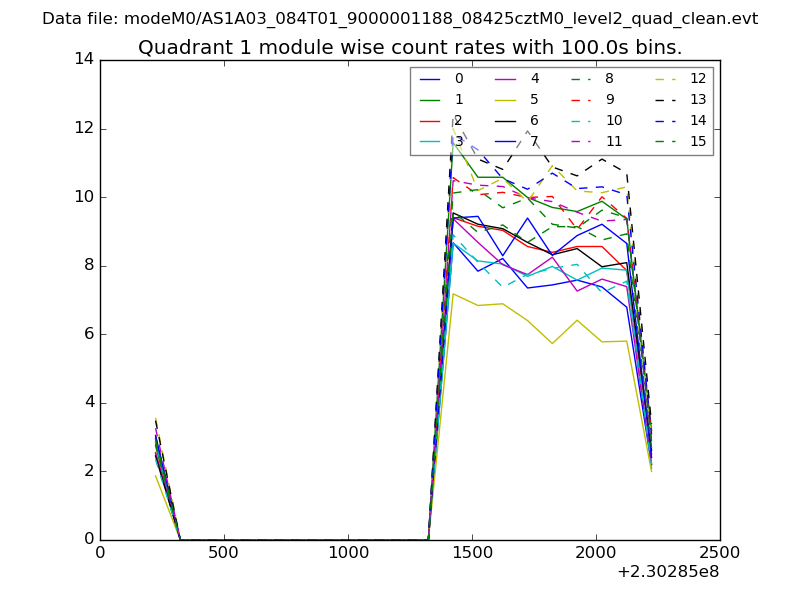
| Module-wise count rates for Quadrant A Data is divided into 100 sec bins |
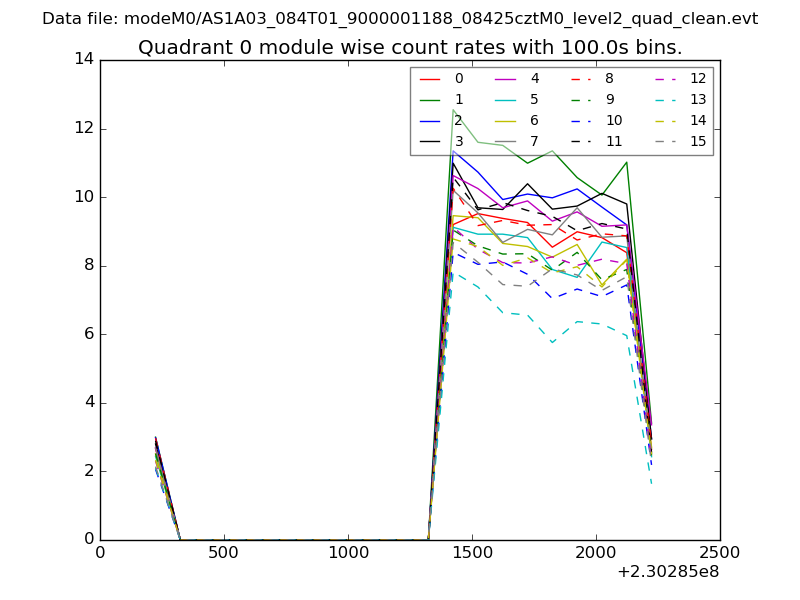 |
 |
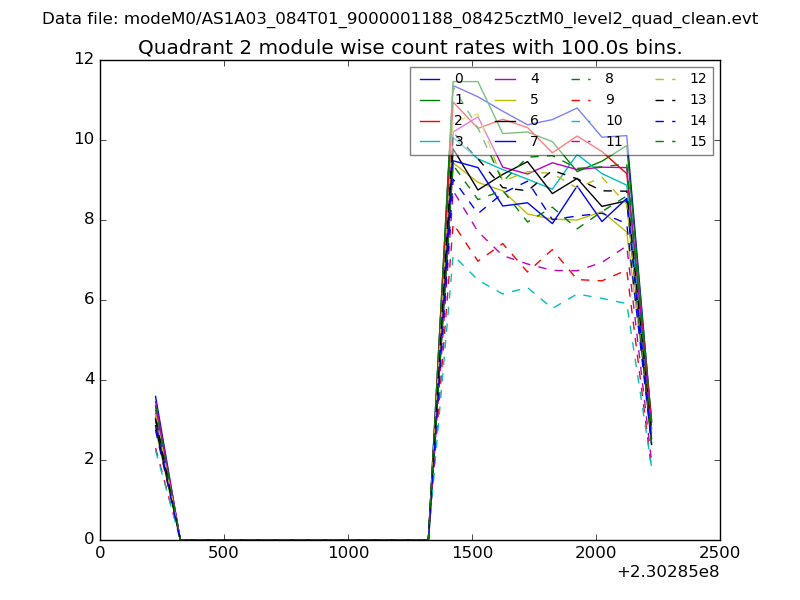
| Module-wise count rates for Quadrant B Data is divided into 100 sec bins |
 |
 |
| Module-wise count rates for Quadrant C Data is divided into 100 sec bins |
 |
 |
| Module-wise count rates for Quadrant D Data is divided into 100 sec bins |
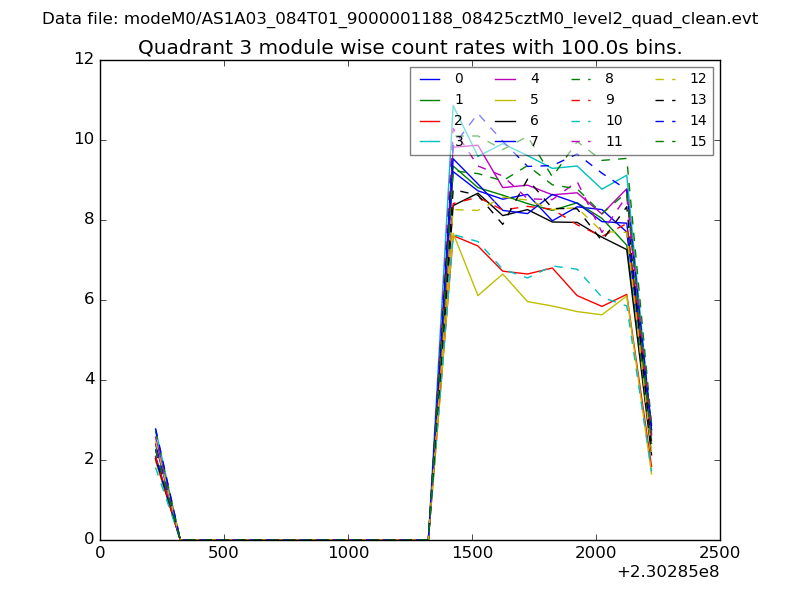 |
 |
| Parameter | Plot |
|---|---|
| CZT HV Monitor | 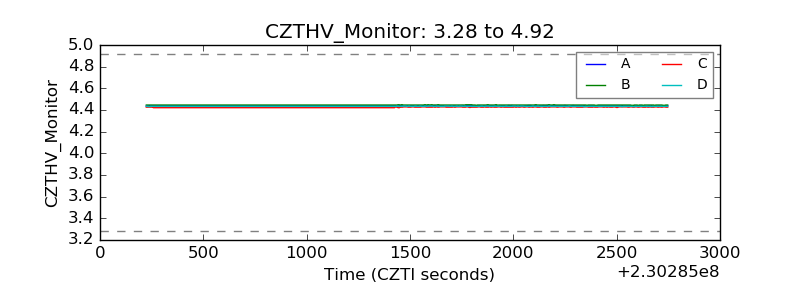 |
| D_VDD | 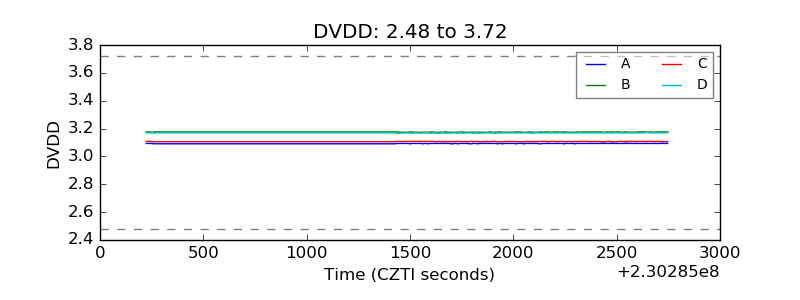 |
| Temperature 1 | 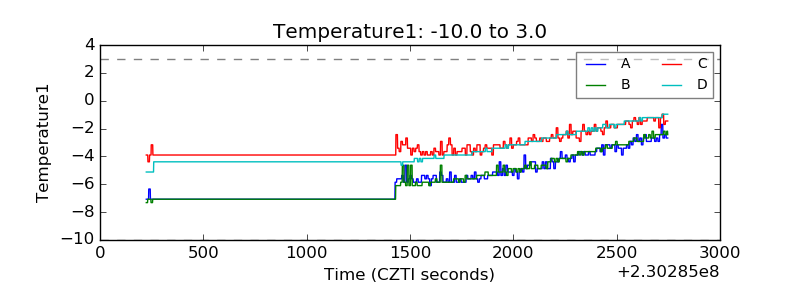 |
| Veto HV Monitor | 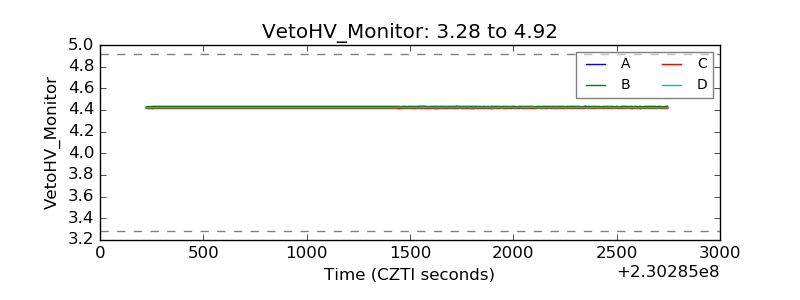 |
| Veto LLD | 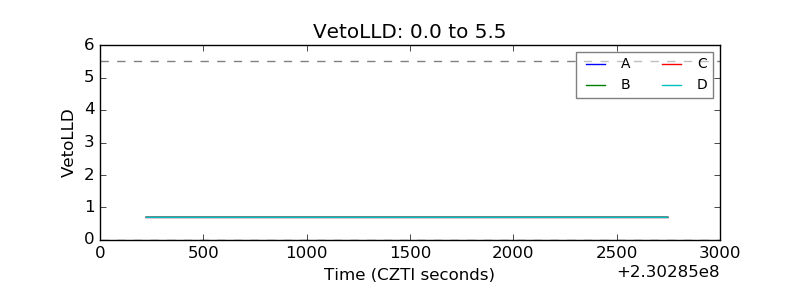 |
| Alpha Counter | 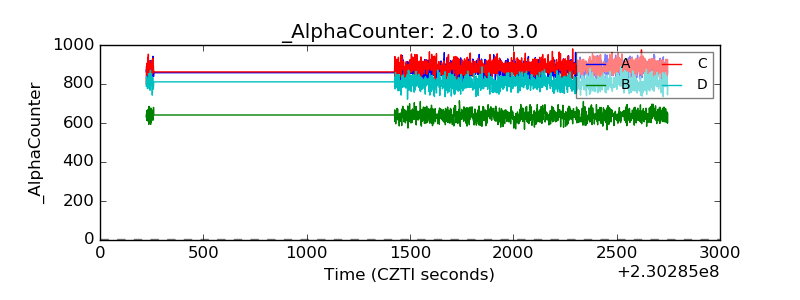 |
| _CPM_Rate | 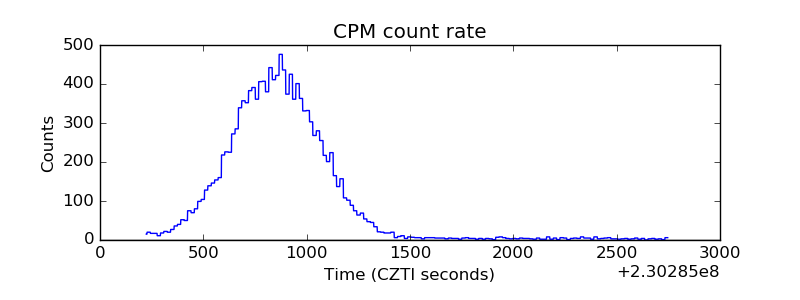 |
| CZT Counter | 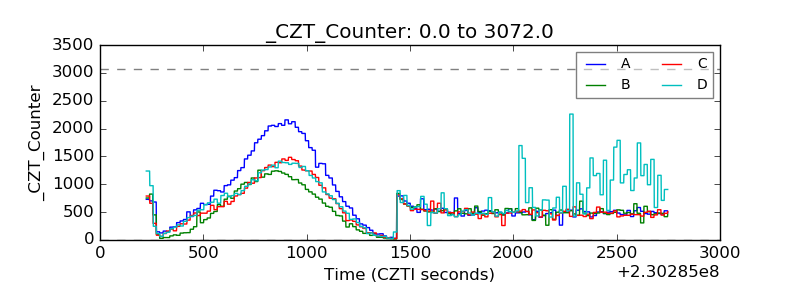 |
| +2.5 Volts monitor |  |
| +5 Volts monitor |  |
| _ROLL_ROT | 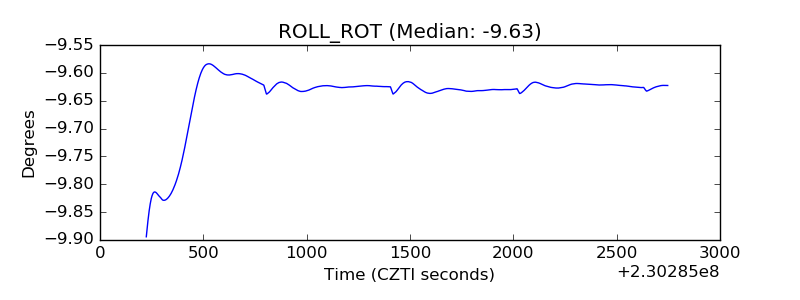 |
| _Roll_DEC | 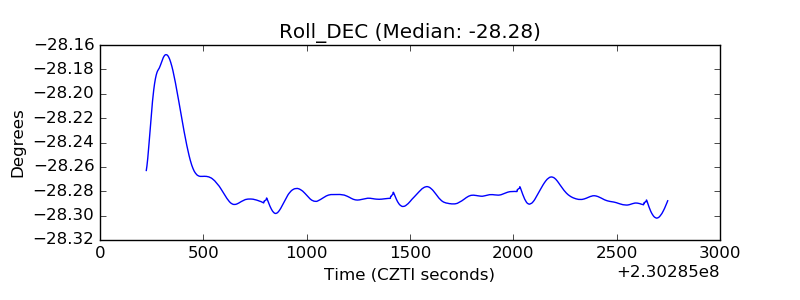 |
| _Roll_RA | 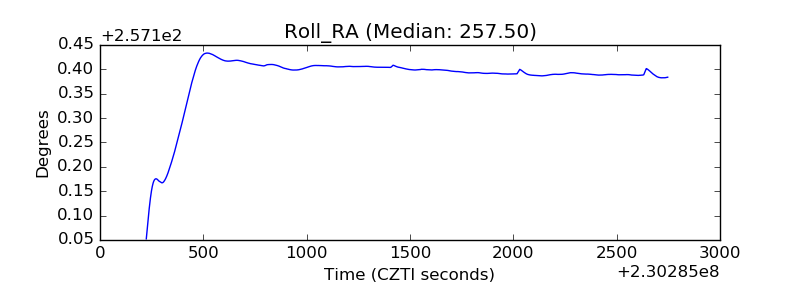 |
| Veto Counter | 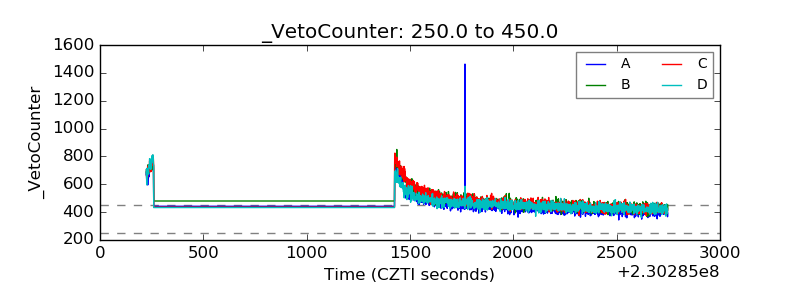 |