| Param | Original file | Final file |
|---|---|---|
| Filename | modeM0/AS1A03_084T01_9000001188_08426cztM0_level2.evt | modeM0/AS1A03_084T01_9000001188_08426cztM0_level2_quad_clean.evt |
| Size (bytes) | 691,375,680 | 75,911,040 |
| Size | 659.3 MB | 72.4 MB |
| Events in quadrant A | 3,491,301 | 480,673 |
| Events in quadrant B | 3,599,629 | 487,876 |
| Events in quadrant C | 3,900,551 | 471,958 |
| Events in quadrant D | 9,469,500 | 366,434 |
| Mode M9 | |||
|---|---|---|---|
| Quadrant | BADHDUFLAG | Total packets | Discarded packets |
| A | 0 | 9 | 0 |
| B | 0 | 9 | 0 |
| C | 0 | 9 | 0 |
| D | 0 | 9 | 0 |
| Mode SS | |||
|---|---|---|---|
| Quadrant | BADHDUFLAG | Total packets | Discarded packets |
| A | 0 | 142 | 0 |
| B | 0 | 142 | 0 |
| C | 0 | 142 | 0 |
| D | 0 | 142 | 0 |
| Mode M0 | |||
|---|---|---|---|
| Quadrant | BADHDUFLAG | Total packets | Discarded packets |
| A | 0 | 14765 | 3 |
| B | 0 | 14966 | 2 |
| C | 0 | 16300 | 2 |
| D | 0 | 32749 | 2 |
| Quadrant | Total seconds | Saturated seconds | Saturation percentage |
|---|---|---|---|
| A | 7055 | 130 | 1.842665% |
| B | 7055 | 145 | 2.055280% |
| C | 7055 | 266 | 3.770376% |
| D | 7055 | 2158 | 30.588235% |
Noise dominated data is calculated using 1-second bins in cleaned event files. If a bin has >2000 counts, and if more than 50% of those come from <1% of pixels, then it is considered to be noise-dominated and hence unusable.
| Quadrant | # 1 sec bins | Bins with >0 counts | Bins with >2000 counts | High rate bins dominated by noise | Noise dominated (total time) | Noise dominated (detector-on time) | Marked lightcurve |
|---|---|---|---|---|---|---|---|
| A | 7915 | 7055 | 2 | 2 | 0.03% | 0.03% | 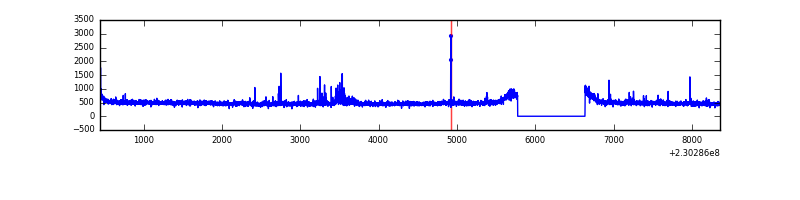 |
| B | 7915 | 7055 | 2 | 2 | 0.03% | 0.03% | 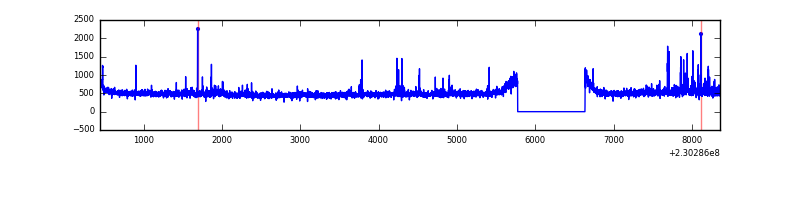 |
| C | 7915 | 7055 | 48 | 48 | 0.61% | 0.68% |  |
| D | 7914 | 7054 | 2038 | 2038 | 25.75% | 28.89% | 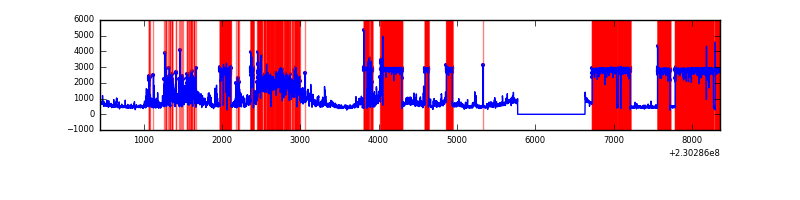 |
Top three noisy pixels from each quadrant. If the there are fewer than three noisy pixels in the level2.evt file, extra rows are filled as -1
| Pixel properties | Quadrant properties | ||||||
|---|---|---|---|---|---|---|---|
| Quadrant | DetID | PixID | Counts | Sigma | Mean | Median | Sigma |
| A | 14 | 111 | 62222 | 344.87 | 874 | 854 | 177.9 |
| A | 13 | 14 | 28559 | 155.69 | 874 | 854 | 177.9 |
| A | 13 | 248 | 15030 | 79.66 | 874 | 854 | 177.9 |
| B | 0 | 214 | 101348 | 597.28 | 875 | 854 | 168.3 |
| B | 5 | 255 | 28404 | 163.74 | 875 | 854 | 168.3 |
| B | 10 | 16 | 26253 | 150.96 | 875 | 854 | 168.3 |
| C | 9 | 68 | 619284 | 3165.91 | 840 | 843 | 195.3 |
| C | 14 | 67 | 6435 | 28.63 | 840 | 843 | 195.3 |
| C | 13 | 61 | 6233 | 27.59 | 840 | 843 | 195.3 |
| D | 1 | 52 | 5015961 | 30399.53 | 673 | 651 | 165.0 |
| D | 12 | 221 | 1607240 | 9738.09 | 673 | 651 | 165.0 |
| D | 12 | 233 | 252555 | 1526.88 | 673 | 651 | 165.0 |
Histogram calculated using DETX and DETY for each event in the final _common_clean file
| Quadrant A |  |
 |
Quadrant B |
|---|---|---|---|
| Quadrant D |  |
 |
Quadrant C |
| Plot type | Count rate plots | Images |
|---|---|---|
| Comparison with Poisson distribution Blue bars denote a histogram of data divided into 1 sec bins. Red curve is a Poisson curve with rate = median count rate of data. |
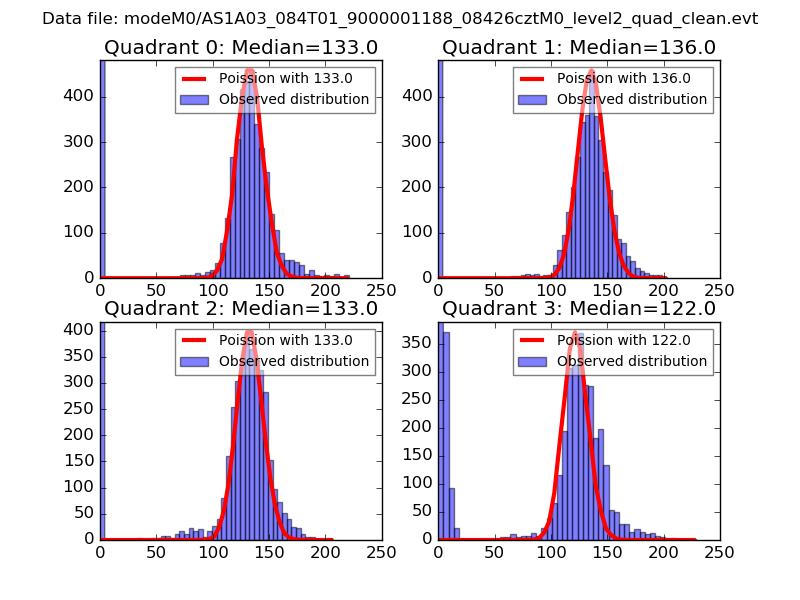 |
 |
| Quadrant-wise count rates Data is divided into 100 sec bins |
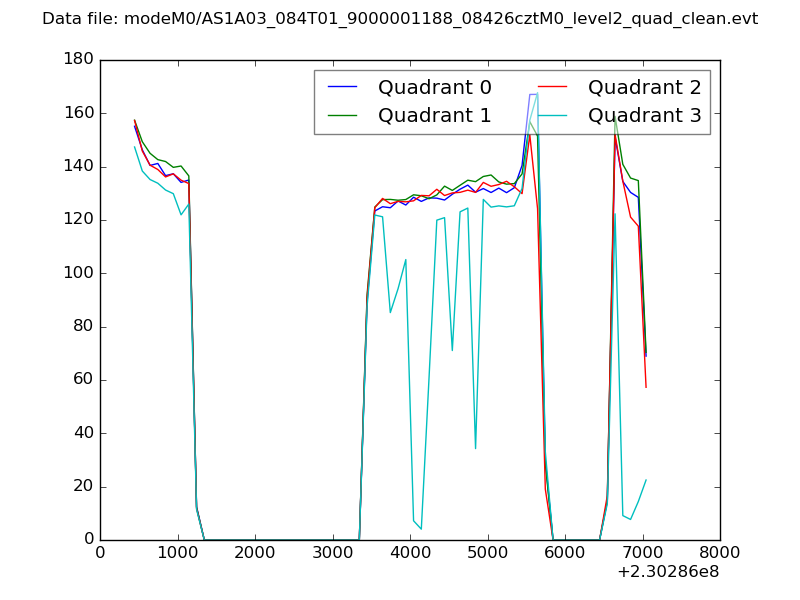 |
|
| Module-wise count rates for Quadrant A Data is divided into 100 sec bins |
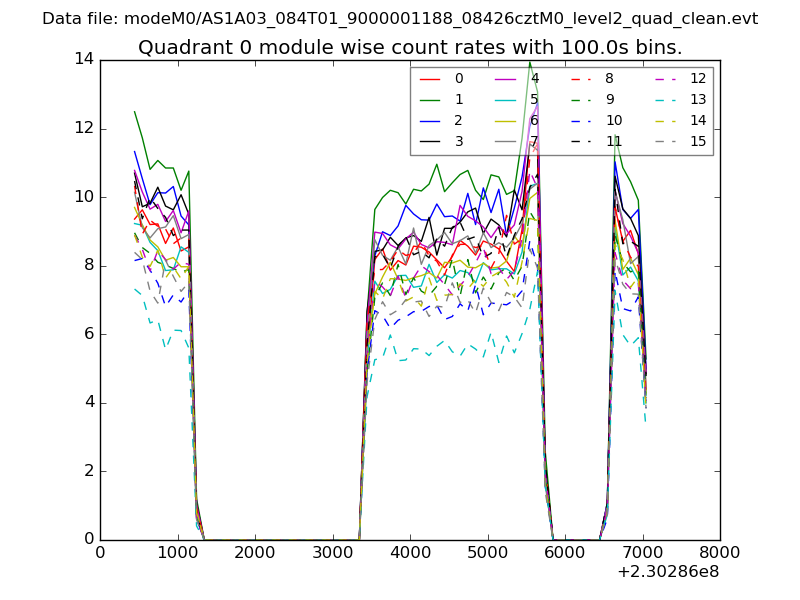 |
 |
| Module-wise count rates for Quadrant B Data is divided into 100 sec bins |
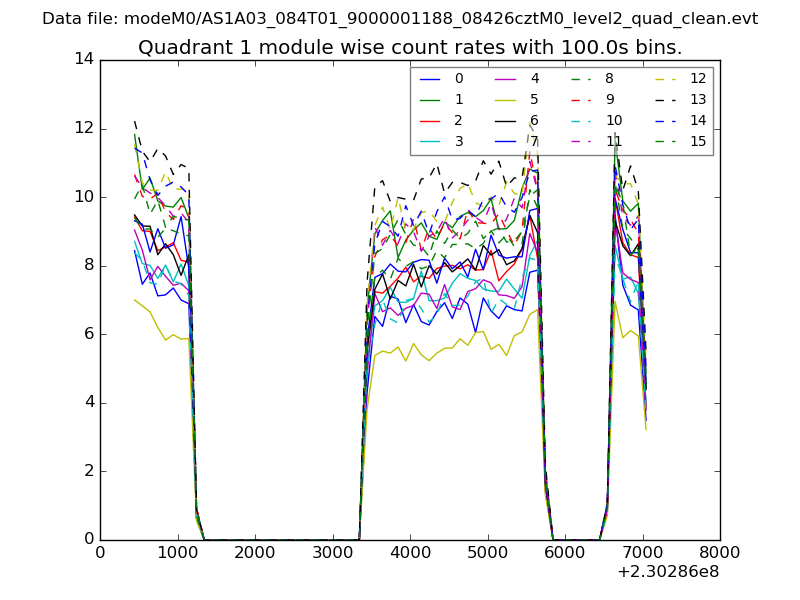 |
 |
| Module-wise count rates for Quadrant C Data is divided into 100 sec bins |
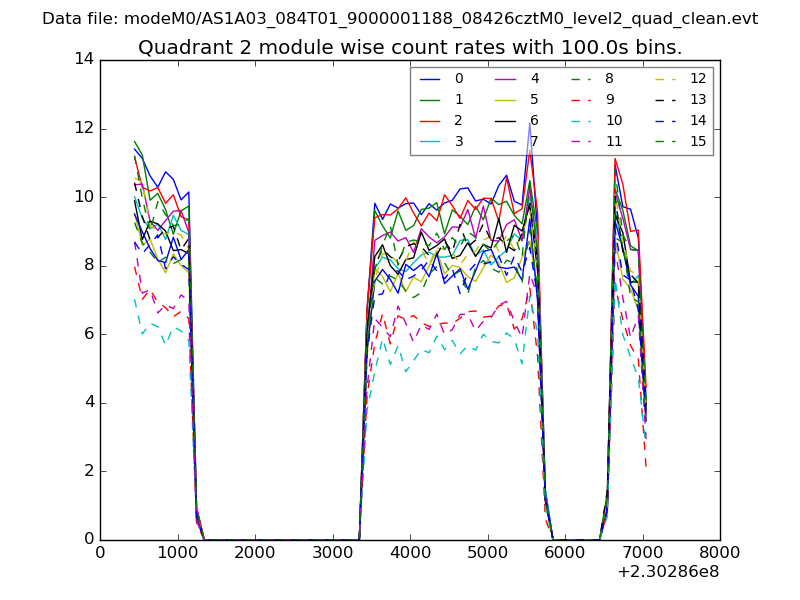 |
 |
| Module-wise count rates for Quadrant D Data is divided into 100 sec bins |
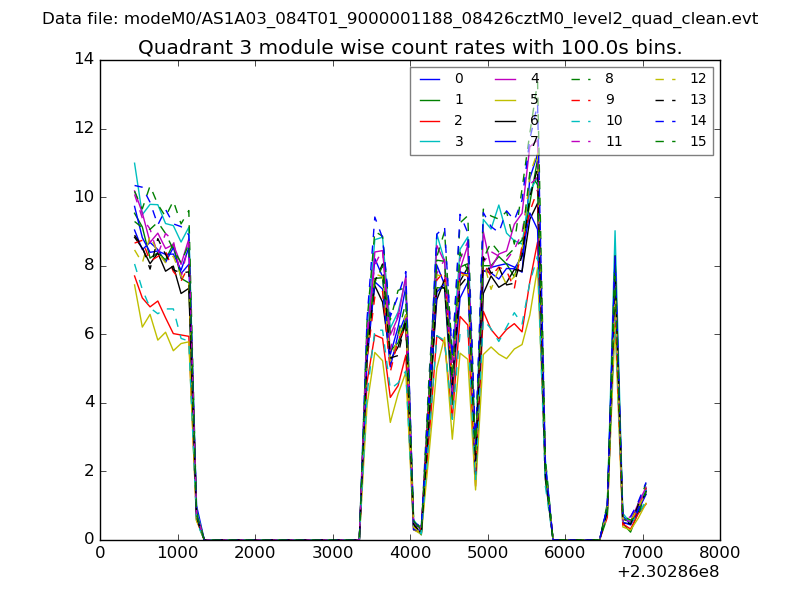 |
 |
| Parameter | Plot |
|---|---|
| CZT HV Monitor | 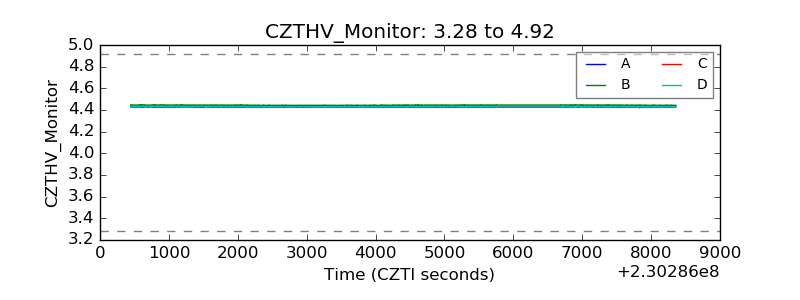 |
| D_VDD |  |
| Temperature 1 |  |
| Veto HV Monitor |  |
| Veto LLD |  |
| Alpha Counter | 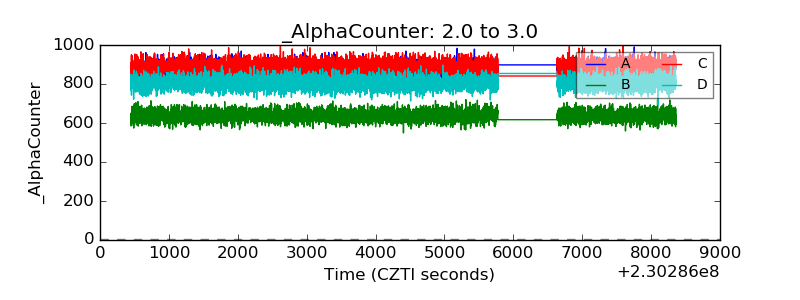 |
| _CPM_Rate | 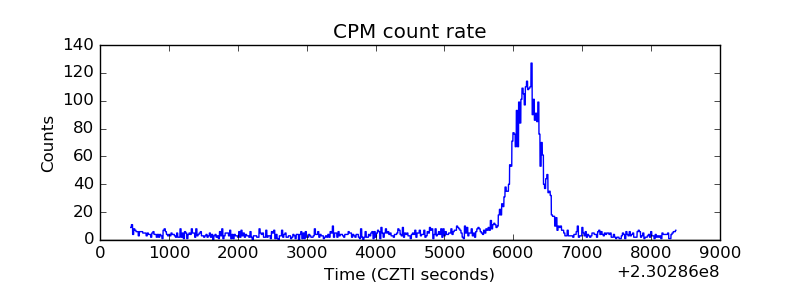 |
| CZT Counter |  |
| +2.5 Volts monitor |  |
| +5 Volts monitor |  |
| _ROLL_ROT | 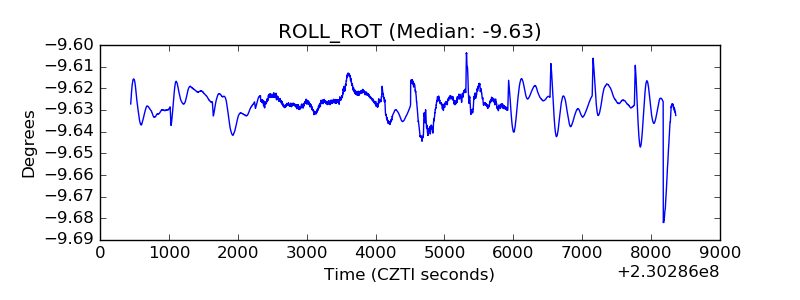 |
| _Roll_DEC |  |
| _Roll_RA |  |
| Veto Counter | 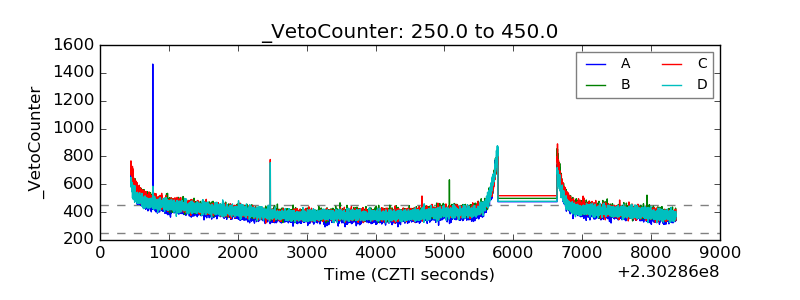 |