| Param | Original file | Final file |
|---|---|---|
| Filename | modeM0/AS1A03_084T01_9000001188_08427cztM0_level2.evt | modeM0/AS1A03_084T01_9000001188_08427cztM0_level2_quad_clean.evt |
| Size (bytes) | 751,982,400 | 73,293,120 |
| Size | 717.1 MB | 69.9 MB |
| Events in quadrant A | 3,667,643 | 459,567 |
| Events in quadrant B | 4,040,778 | 464,527 |
| Events in quadrant C | 5,002,556 | 451,215 |
| Events in quadrant D | 9,559,466 | 325,715 |
| Mode M9 | |||
|---|---|---|---|
| Quadrant | BADHDUFLAG | Total packets | Discarded packets |
| A | 0 | 4 | 0 |
| B | 0 | 4 | 0 |
| C | 0 | 4 | 0 |
| D | 0 | 4 | 0 |
| Mode SS | |||
|---|---|---|---|
| Quadrant | BADHDUFLAG | Total packets | Discarded packets |
| A | 0 | 150 | 0 |
| B | 0 | 150 | 0 |
| C | 0 | 150 | 0 |
| D | 0 | 150 | 0 |
| Mode M0 | |||
|---|---|---|---|
| Quadrant | BADHDUFLAG | Total packets | Discarded packets |
| A | 0 | 15814 | 2 |
| B | 0 | 16654 | 1 |
| C | 0 | 19892 | 1 |
| D | 0 | 33335 | 1 |
| Quadrant | Total seconds | Saturated seconds | Saturation percentage |
|---|---|---|---|
| A | 7435 | 197 | 2.649630% |
| B | 7435 | 249 | 3.349025% |
| C | 7435 | 579 | 7.787492% |
| D | 7435 | 2679 | 36.032280% |
Noise dominated data is calculated using 1-second bins in cleaned event files. If a bin has >2000 counts, and if more than 50% of those come from <1% of pixels, then it is considered to be noise-dominated and hence unusable.
| Quadrant | # 1 sec bins | Bins with >0 counts | Bins with >2000 counts | High rate bins dominated by noise | Noise dominated (total time) | Noise dominated (detector-on time) | Marked lightcurve |
|---|---|---|---|---|---|---|---|
| A | 7835 | 7435 | 9 | 9 | 0.11% | 0.12% | 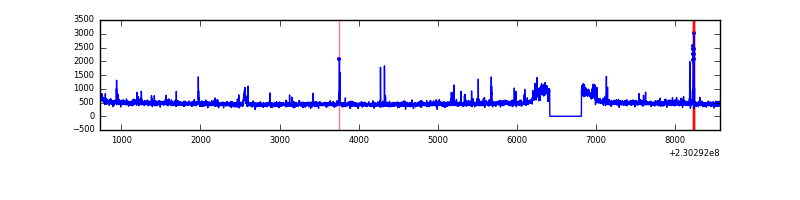 |
| B | 7835 | 7435 | 44 | 44 | 0.56% | 0.59% | 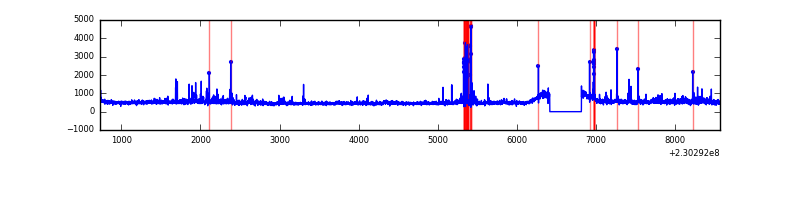 |
| C | 7835 | 7435 | 188 | 188 | 2.40% | 2.53% | 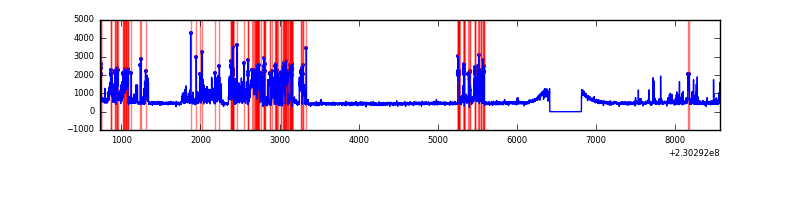 |
| D | 7835 | 7436 | 2521 | 2521 | 32.18% | 33.90% | 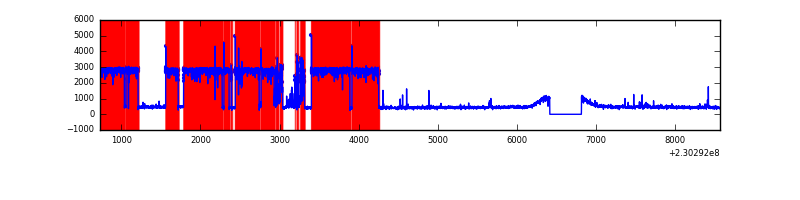 |
Top three noisy pixels from each quadrant. If the there are fewer than three noisy pixels in the level2.evt file, extra rows are filled as -1
| Pixel properties | Quadrant properties | ||||||
|---|---|---|---|---|---|---|---|
| Quadrant | DetID | PixID | Counts | Sigma | Mean | Median | Sigma |
| A | 15 | 174 | 28874 | 149.46 | 914 | 892 | 187.2 |
| A | 14 | 111 | 26910 | 138.97 | 914 | 892 | 187.2 |
| A | 4 | 2 | 25864 | 133.38 | 914 | 892 | 187.2 |
| B | 0 | 214 | 198534 | 1116.13 | 911 | 888 | 177.1 |
| B | 10 | 16 | 176548 | 991.97 | 911 | 888 | 177.1 |
| B | 11 | 51 | 45023 | 249.23 | 911 | 888 | 177.1 |
| C | 9 | 68 | 1598959 | 7837.36 | 871 | 874 | 203.9 |
| C | 13 | 61 | 6442 | 27.3 | 871 | 874 | 203.9 |
| C | 8 | 222 | 3907 | 14.87 | 871 | 874 | 203.9 |
| D | 1 | 52 | 6931127 | 41319.69 | 679 | 658 | 167.7 |
| D | 2 | 14 | 28025 | 163.16 | 679 | 658 | 167.7 |
| D | 2 | 234 | 20877 | 120.55 | 679 | 658 | 167.7 |
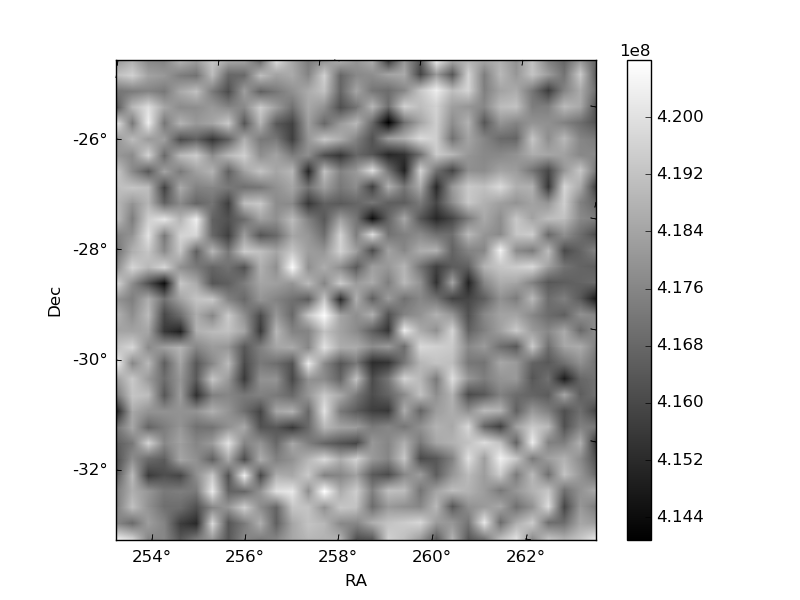
Histogram calculated using DETX and DETY for each event in the final _common_clean file
| Quadrant A | 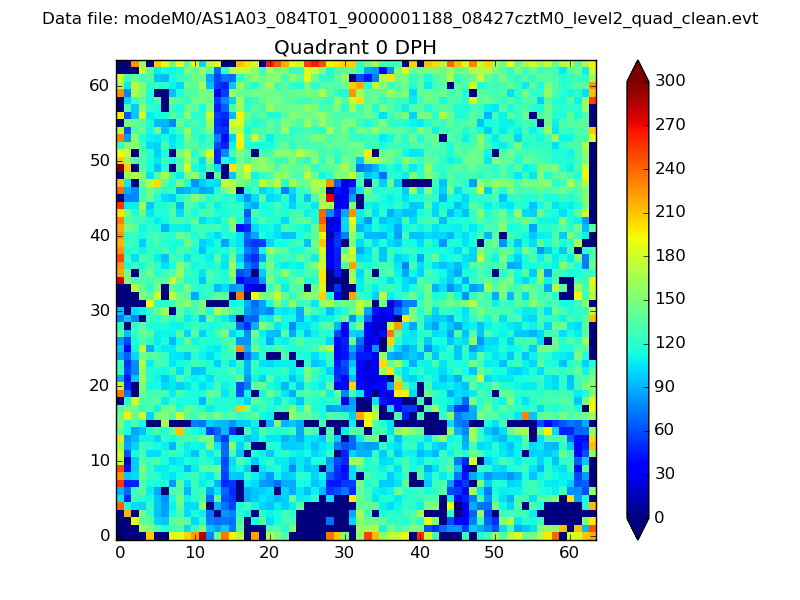 |
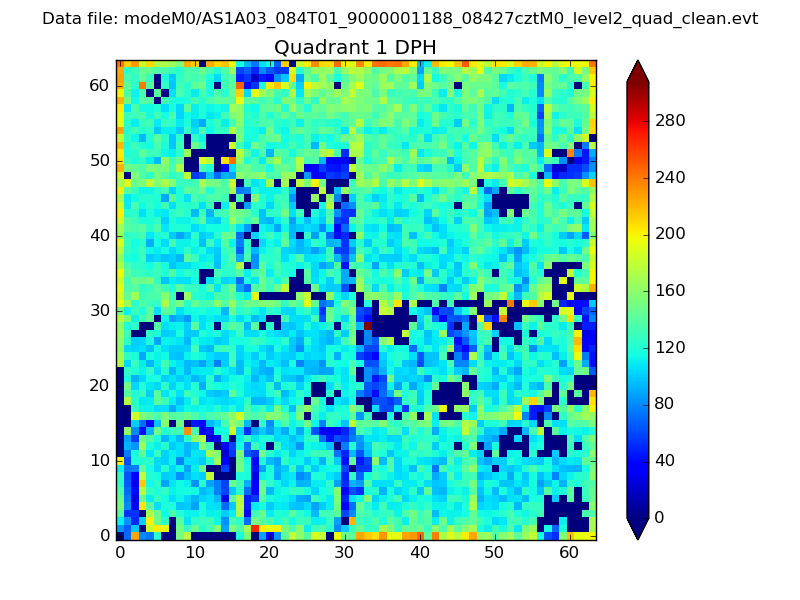 |
Quadrant B |
|---|---|---|---|
| Quadrant D | 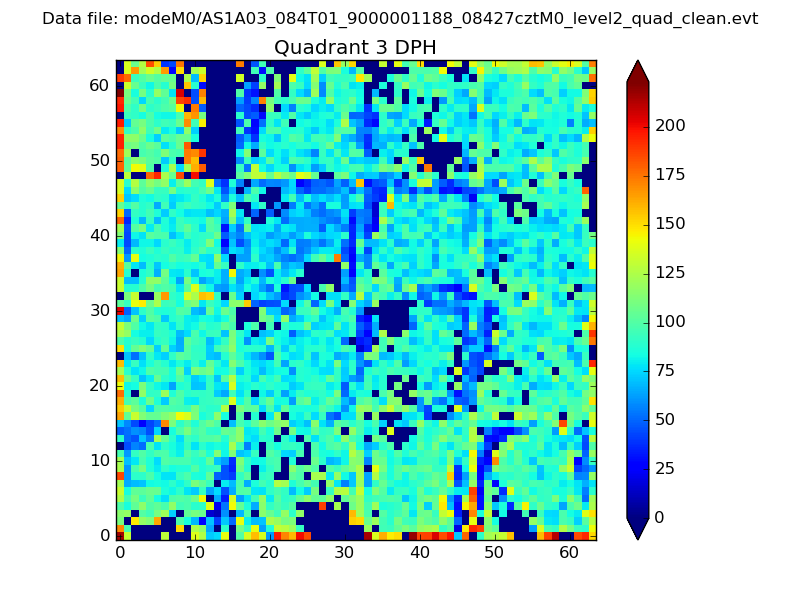 |
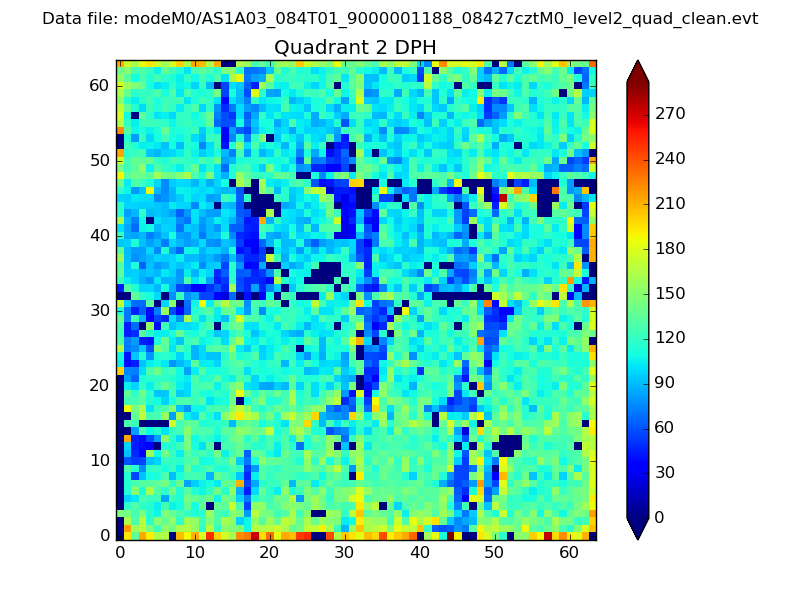 |
Quadrant C |
| Plot type | Count rate plots | Images |
|---|---|---|
| Comparison with Poisson distribution Blue bars denote a histogram of data divided into 1 sec bins. Red curve is a Poisson curve with rate = median count rate of data. |
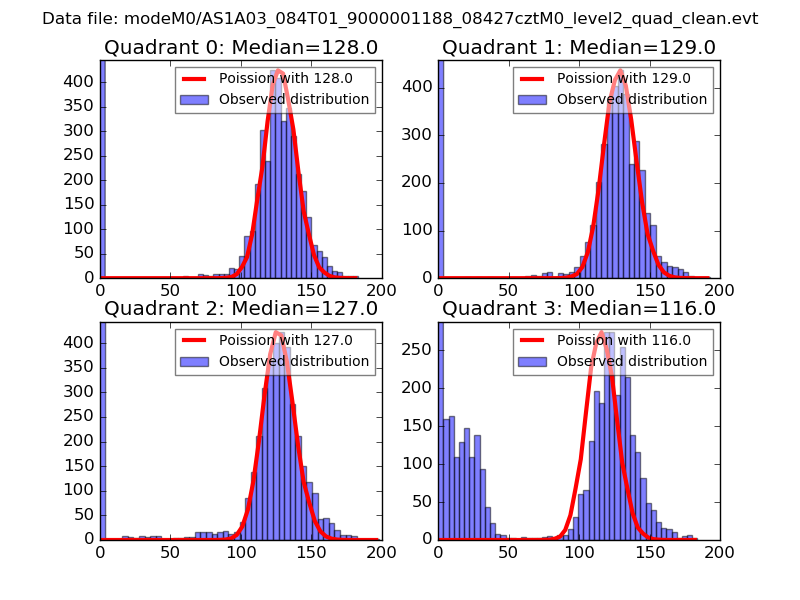 |
 |
| Quadrant-wise count rates Data is divided into 100 sec bins |
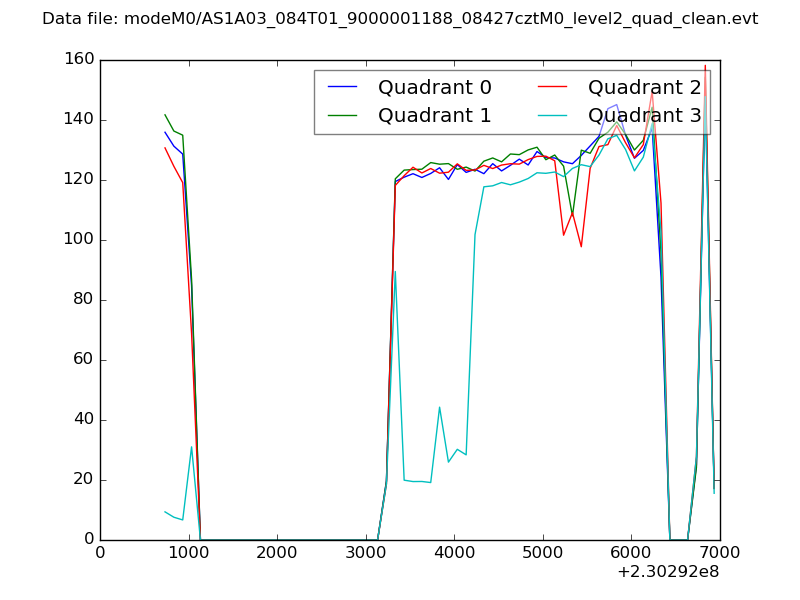 |
|
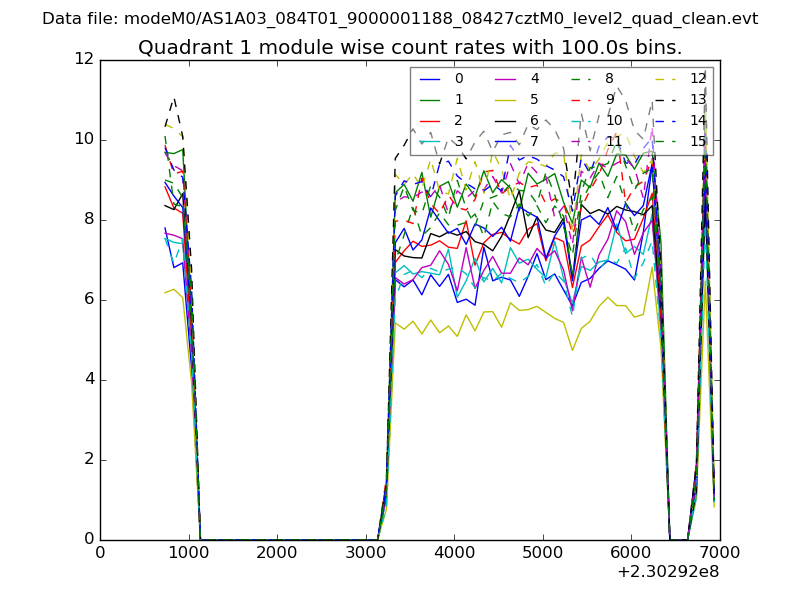
| Module-wise count rates for Quadrant A Data is divided into 100 sec bins |
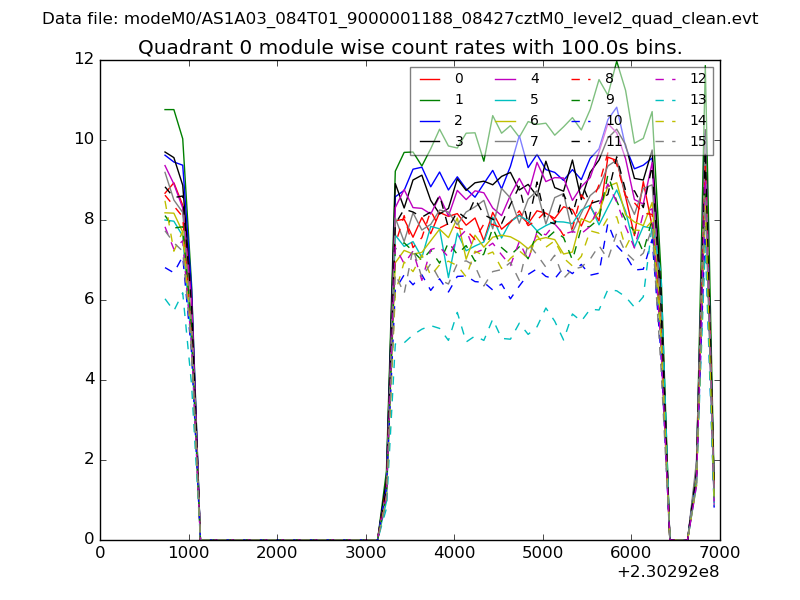 |
 |
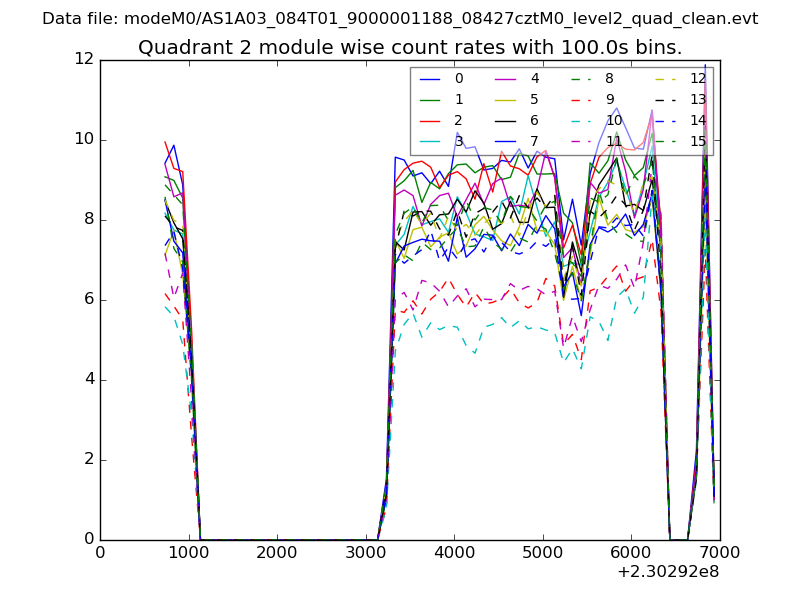
| Module-wise count rates for Quadrant B Data is divided into 100 sec bins |
 |
 |
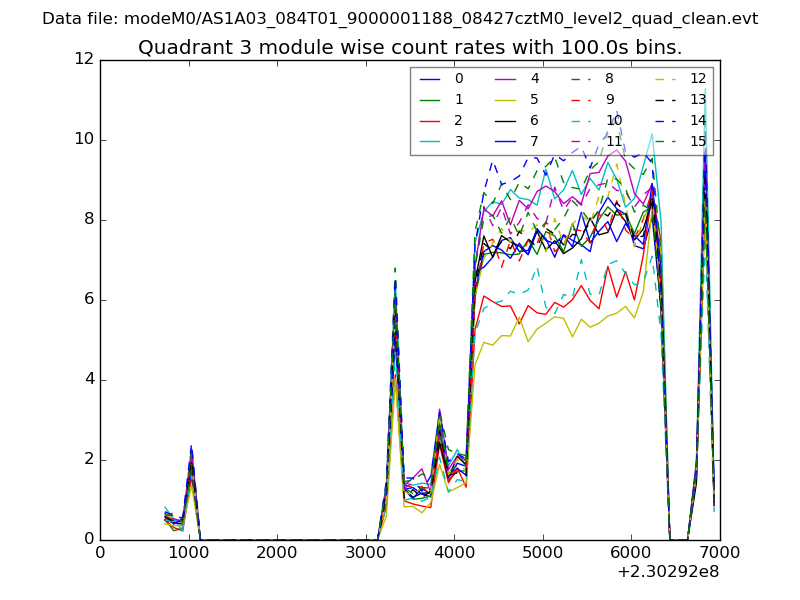
| Module-wise count rates for Quadrant C Data is divided into 100 sec bins |
 |
 |
| Module-wise count rates for Quadrant D Data is divided into 100 sec bins |
 |
 |
| Parameter | Plot |
|---|---|
| CZT HV Monitor | 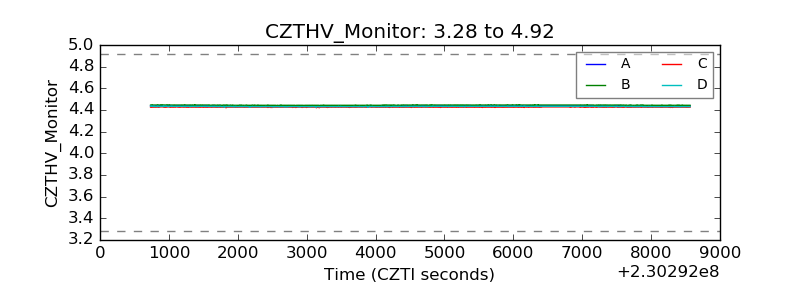 |
| D_VDD |  |
| Temperature 1 |  |
| Veto HV Monitor | 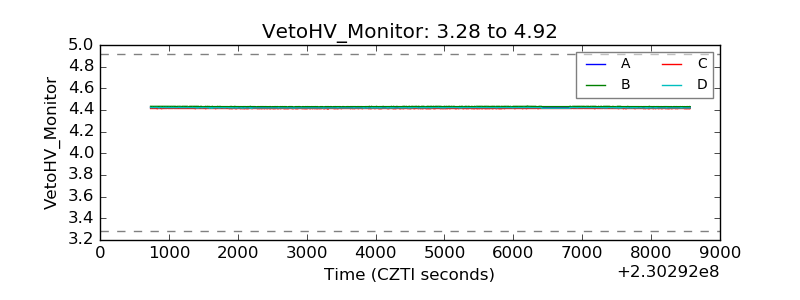 |
| Veto LLD | 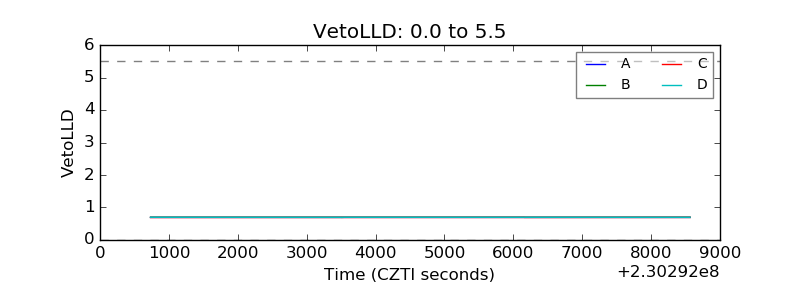 |
| Alpha Counter | 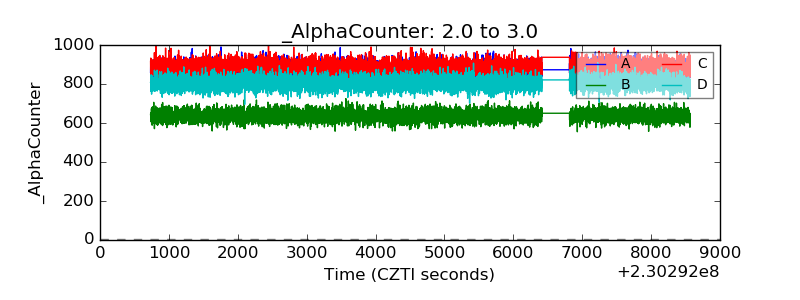 |
| _CPM_Rate | 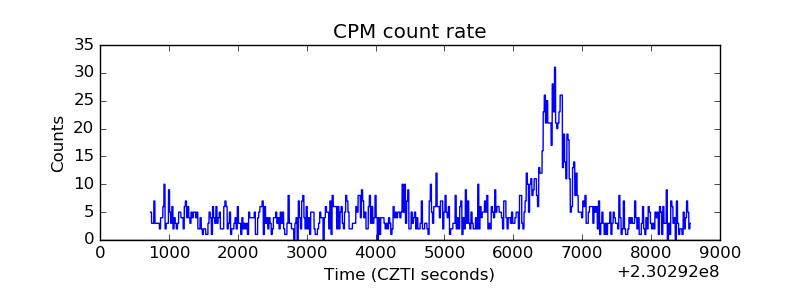 |
| CZT Counter | 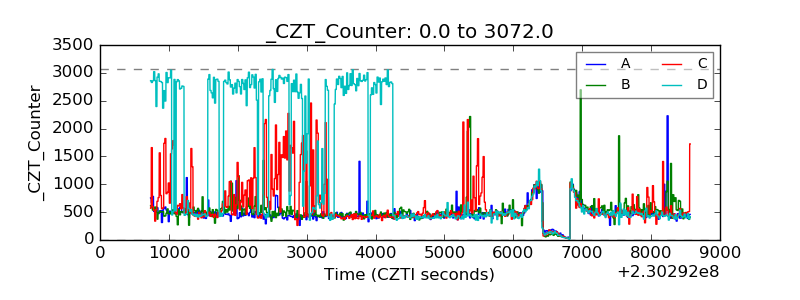 |
| +2.5 Volts monitor |  |
| +5 Volts monitor |  |
| _ROLL_ROT | 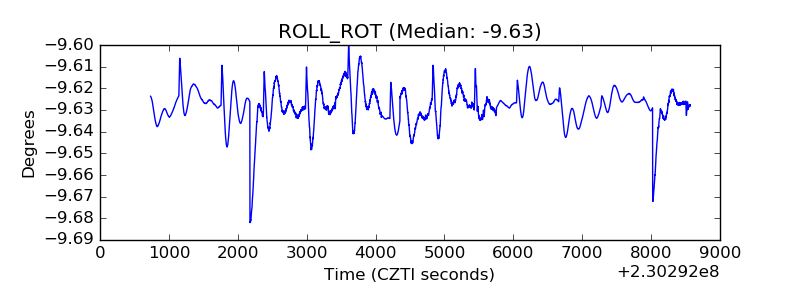 |
| _Roll_DEC | 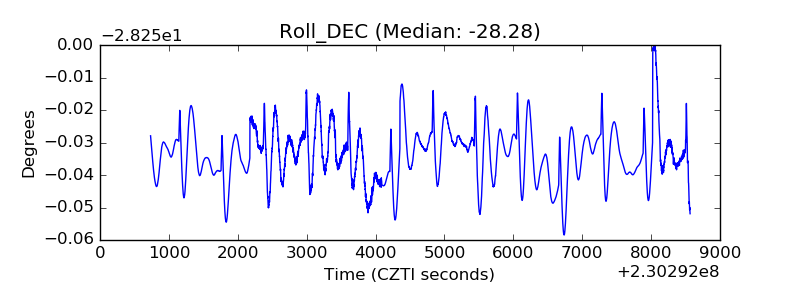 |
| _Roll_RA | 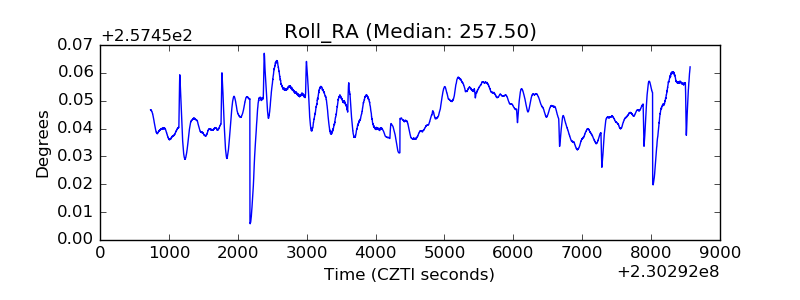 |
| Veto Counter | 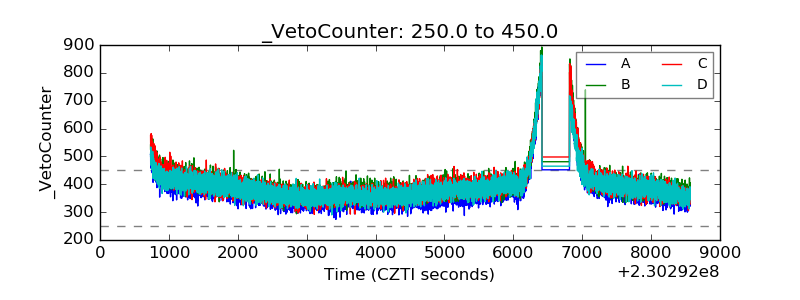 |