| Param | Original file | Final file |
|---|---|---|
| Filename | modeM0/AS1A03_084T01_9000001188_08429cztM0_level2.evt | modeM0/AS1A03_084T01_9000001188_08429cztM0_level2_quad_clean.evt |
| Size (bytes) | 515,191,680 | 75,300,480 |
| Size | 491.3 MB | 71.8 MB |
| Events in quadrant A | 3,729,687 | 441,424 |
| Events in quadrant B | 3,874,796 | 446,886 |
| Events in quadrant C | 3,534,270 | 440,922 |
| Events in quadrant D | 3,948,673 | 423,189 |
| Mode SS | |||
|---|---|---|---|
| Quadrant | BADHDUFLAG | Total packets | Discarded packets |
| A | 0 | 154 | 0 |
| B | 0 | 154 | 0 |
| C | 0 | 154 | 0 |
| D | 0 | 154 | 0 |
| Mode M0 | |||
|---|---|---|---|
| Quadrant | BADHDUFLAG | Total packets | Discarded packets |
| A | 0 | 16164 | 15 |
| B | 0 | 16365 | 11 |
| C | 0 | 15723 | 6 |
| D | 0 | 17079 | 11 |
| Quadrant | Total seconds | Saturated seconds | Saturation percentage |
|---|---|---|---|
| A | 7574 | 223 | 2.944283% |
| B | 7575 | 232 | 3.062706% |
| C | 7577 | 140 | 1.847697% |
| D | 7576 | 191 | 2.521119% |
Noise dominated data is calculated using 1-second bins in cleaned event files. If a bin has >2000 counts, and if more than 50% of those come from <1% of pixels, then it is considered to be noise-dominated and hence unusable.
| Quadrant | # 1 sec bins | Bins with >0 counts | Bins with >2000 counts | High rate bins dominated by noise | Noise dominated (total time) | Noise dominated (detector-on time) | Marked lightcurve |
|---|---|---|---|---|---|---|---|
| A | 7699 | 7581 | 4 | 4 | 0.05% | 0.05% | 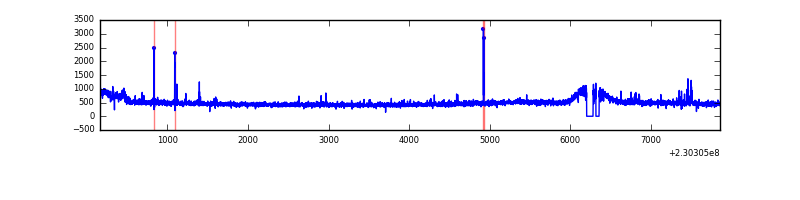 |
| B | 7699 | 7581 | 12 | 12 | 0.16% | 0.16% | 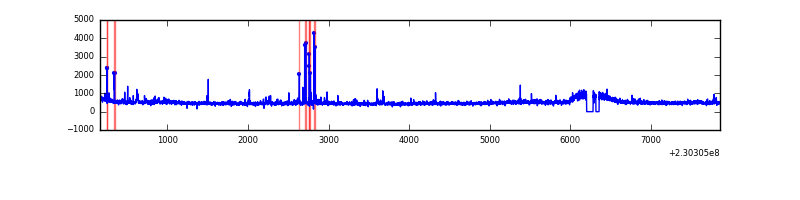 |
| C | 7699 | 7581 | 0 | 0 | 0.00% | 0.00% | 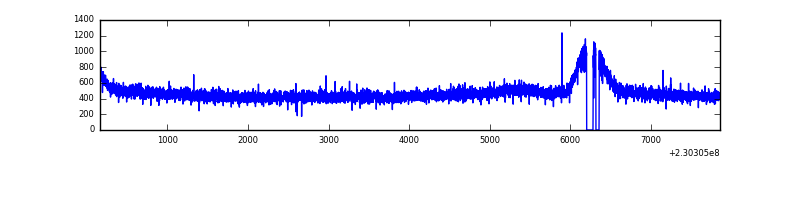 |
| D | 7699 | 7580 | 29 | 29 | 0.38% | 0.38% | 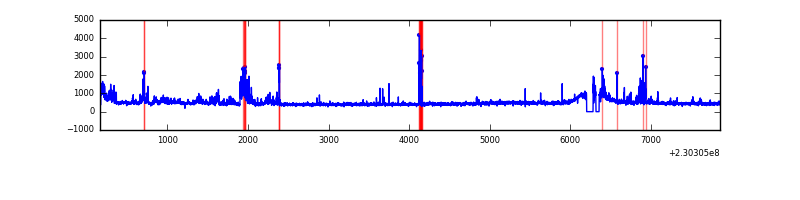 |
Top three noisy pixels from each quadrant. If the there are fewer than three noisy pixels in the level2.evt file, extra rows are filled as -1
| Pixel properties | Quadrant properties | ||||||
|---|---|---|---|---|---|---|---|
| Quadrant | DetID | PixID | Counts | Sigma | Mean | Median | Sigma |
| A | 15 | 236 | 92018 | 474.81 | 924 | 901 | 191.9 |
| A | 2 | 79 | 46533 | 237.79 | 924 | 901 | 191.9 |
| A | 14 | 111 | 15253 | 74.79 | 924 | 901 | 191.9 |
| B | 0 | 214 | 130868 | 718.65 | 924 | 896 | 180.9 |
| B | 4 | 81 | 65510 | 357.27 | 924 | 896 | 180.9 |
| B | 10 | 16 | 37841 | 204.28 | 924 | 896 | 180.9 |
| C | 8 | 128 | 13063 | 57.88 | 899 | 902 | 210.1 |
| C | 13 | 61 | 6870 | 28.41 | 899 | 902 | 210.1 |
| C | 8 | 112 | 6648 | 27.35 | 899 | 902 | 210.1 |
| D | 6 | 225 | 351859 | 1564.48 | 899 | 868 | 224.3 |
| D | 2 | 14 | 69727 | 306.93 | 899 | 868 | 224.3 |
| D | 12 | 233 | 40082 | 174.79 | 899 | 868 | 224.3 |
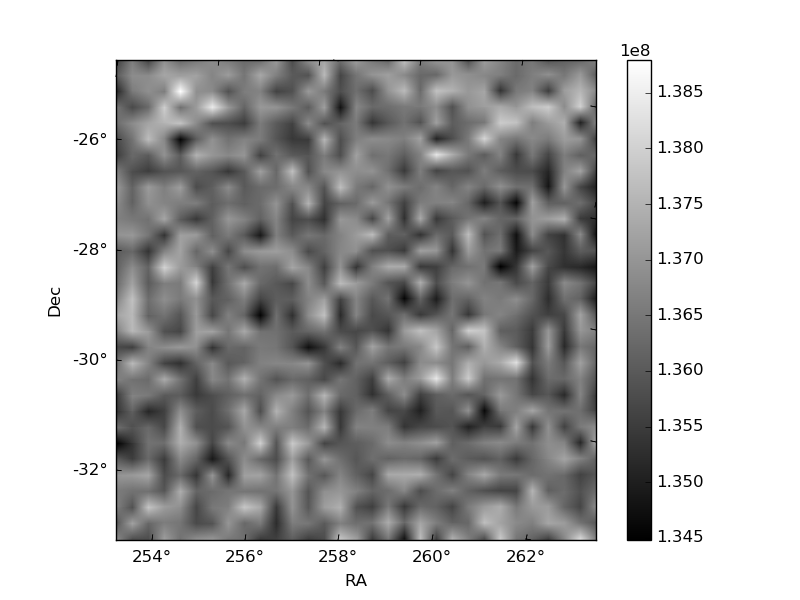
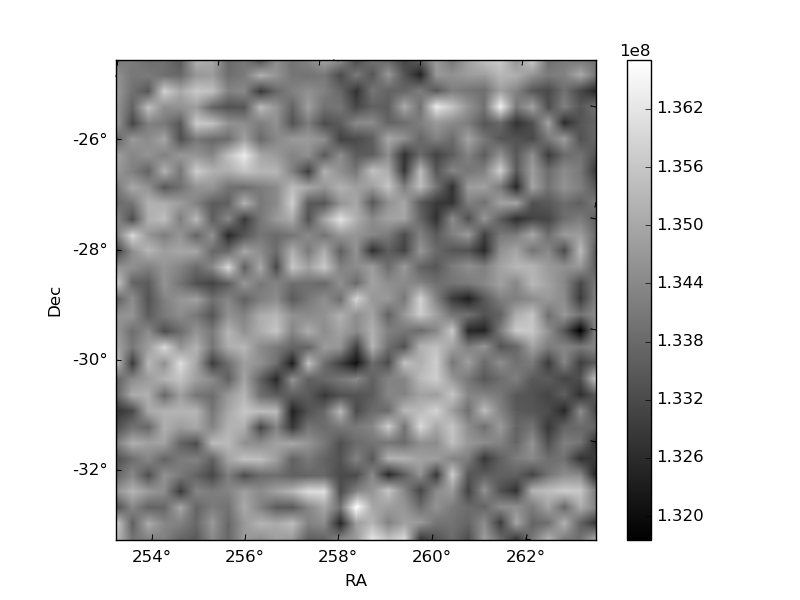
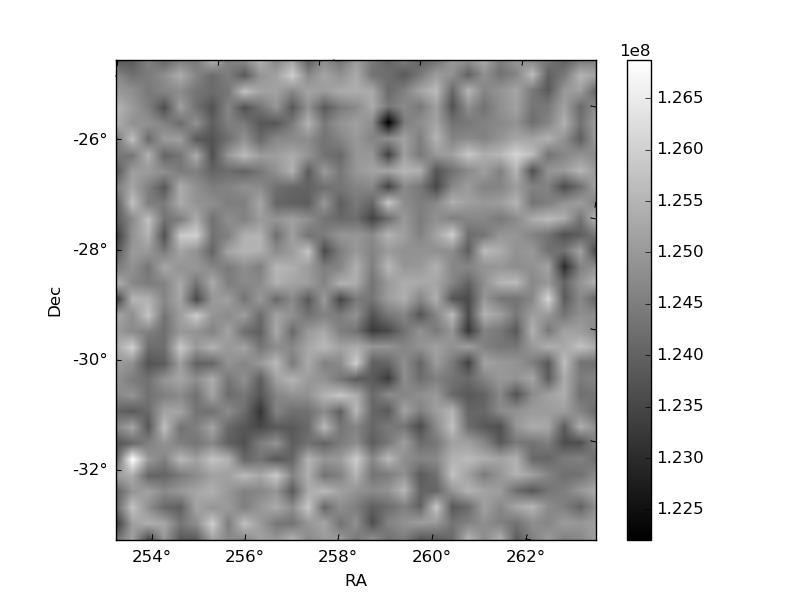
Histogram calculated using DETX and DETY for each event in the final _common_clean file
| Quadrant A | 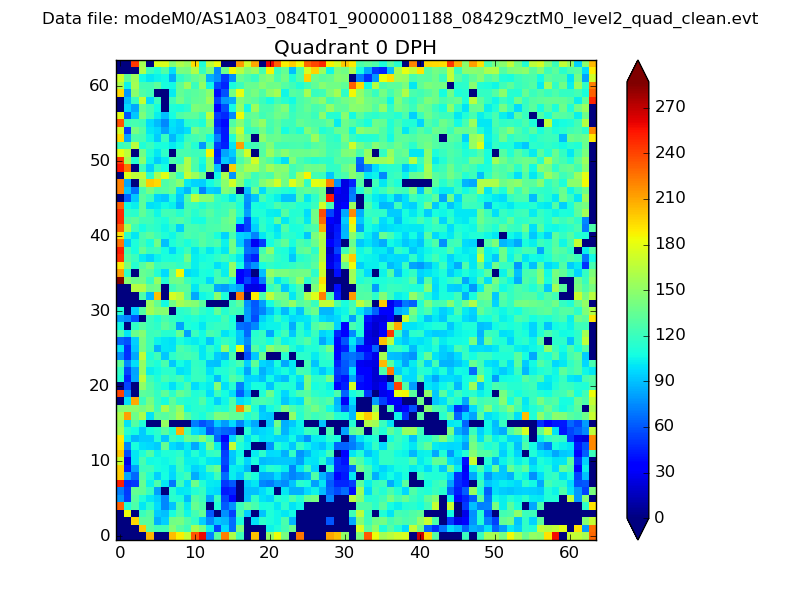 |
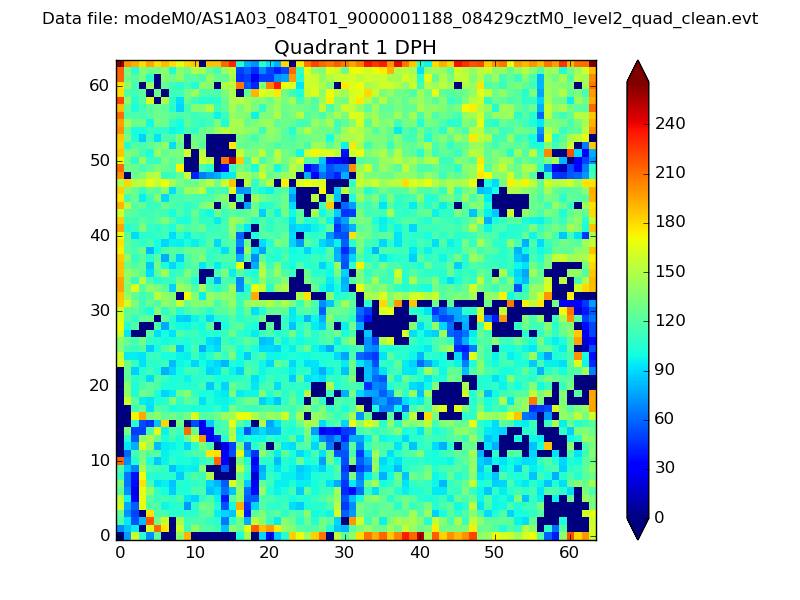 |
Quadrant B |
|---|---|---|---|
| Quadrant D | 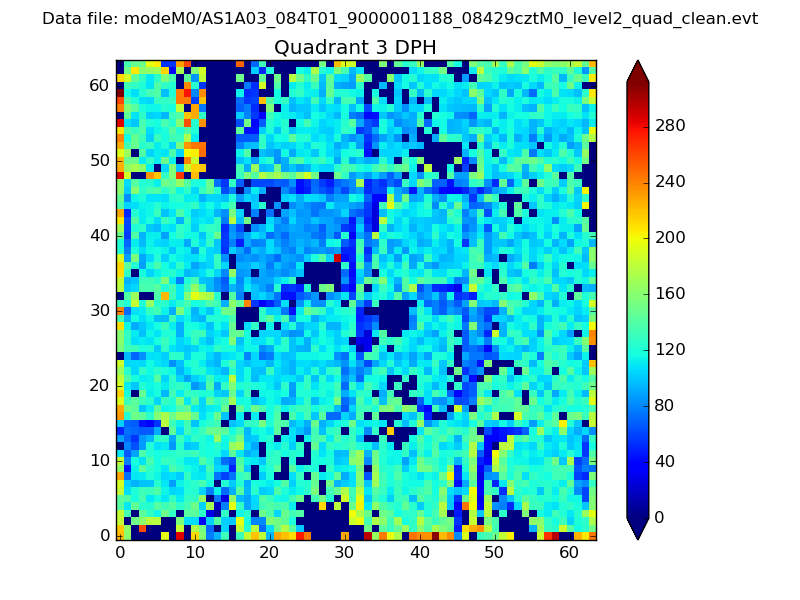 |
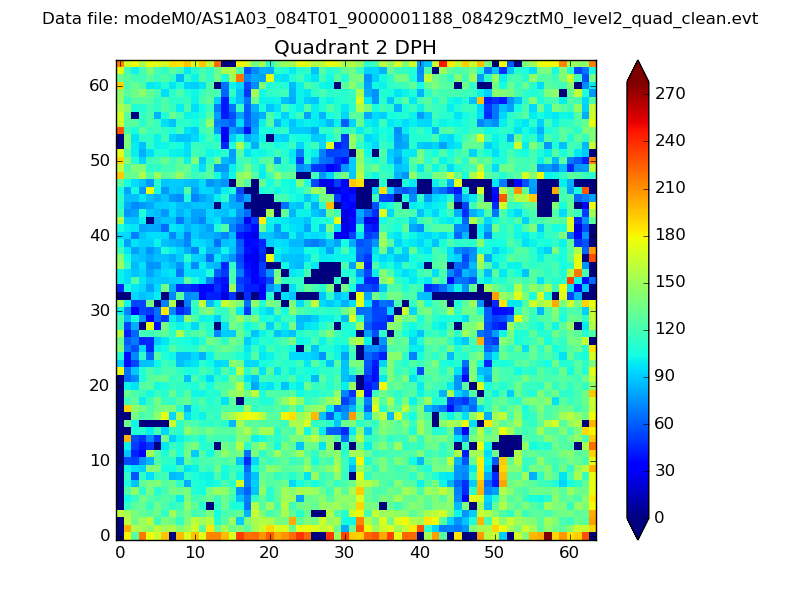 |
Quadrant C |
| Plot type | Count rate plots | Images |
|---|---|---|
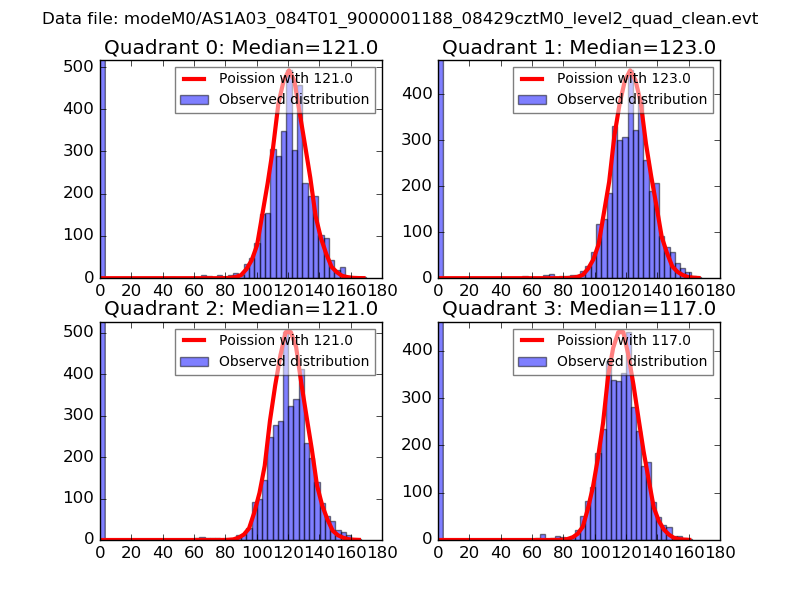
| Comparison with Poisson distribution Blue bars denote a histogram of data divided into 1 sec bins. Red curve is a Poisson curve with rate = median count rate of data. |
 |
 |
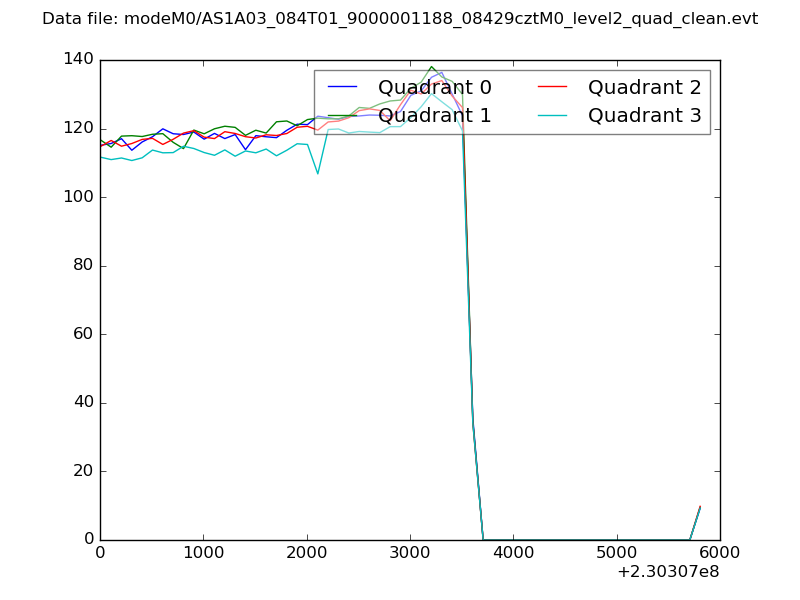
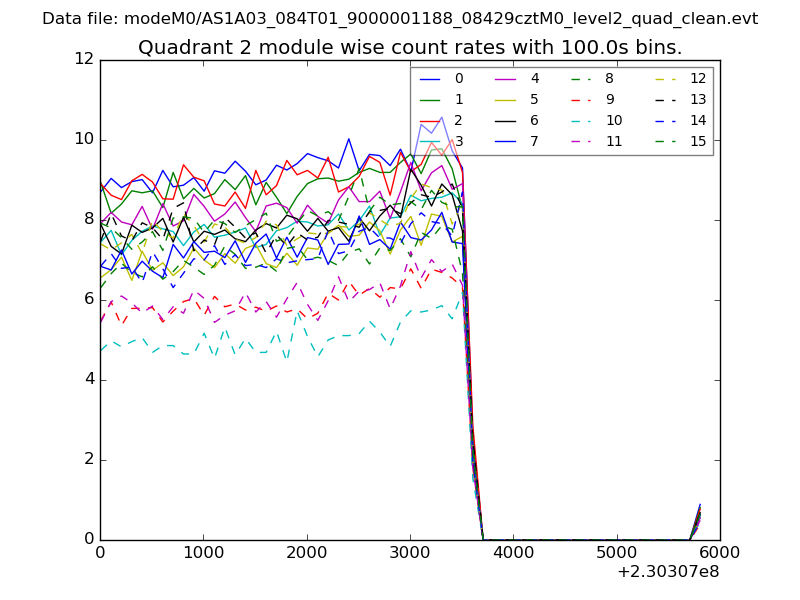
| Quadrant-wise count rates Data is divided into 100 sec bins |
 |
|
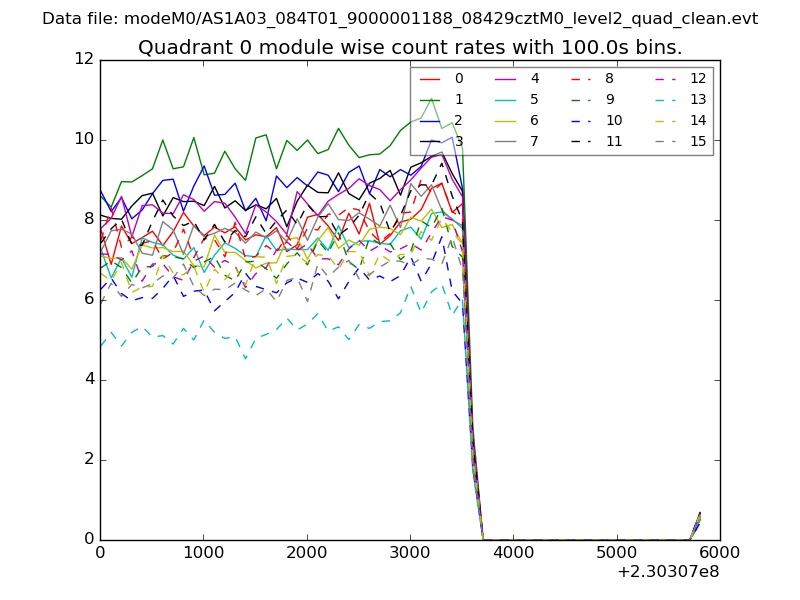
| Module-wise count rates for Quadrant A Data is divided into 100 sec bins |
 |
 |
| Module-wise count rates for Quadrant B Data is divided into 100 sec bins |
 |
 |
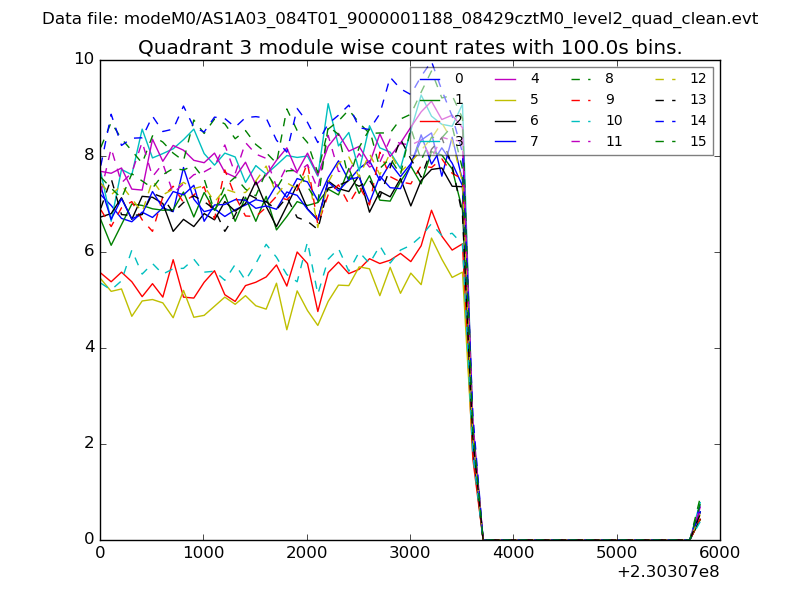
| Module-wise count rates for Quadrant C Data is divided into 100 sec bins |
 |
 |
| Module-wise count rates for Quadrant D Data is divided into 100 sec bins |
 |
 |
| Parameter | Plot |
|---|---|
| CZT HV Monitor | 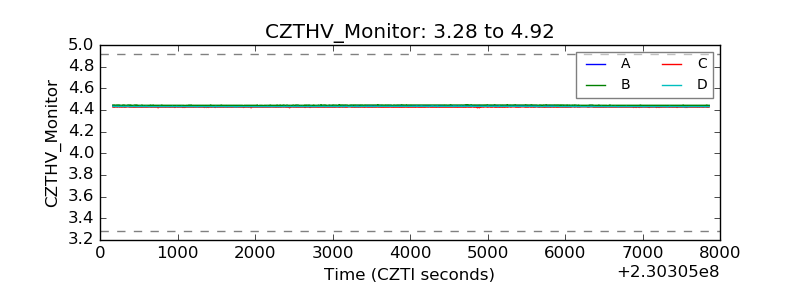 |
| D_VDD | 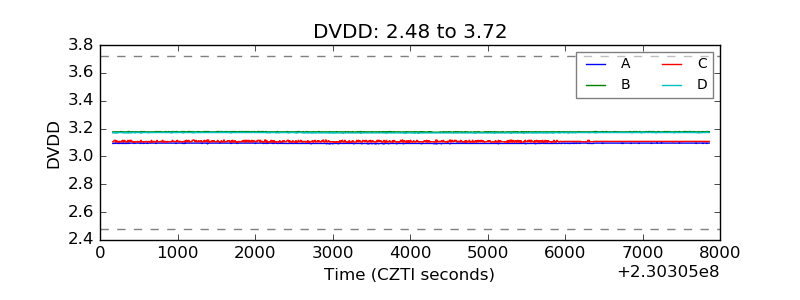 |
| Temperature 1 | 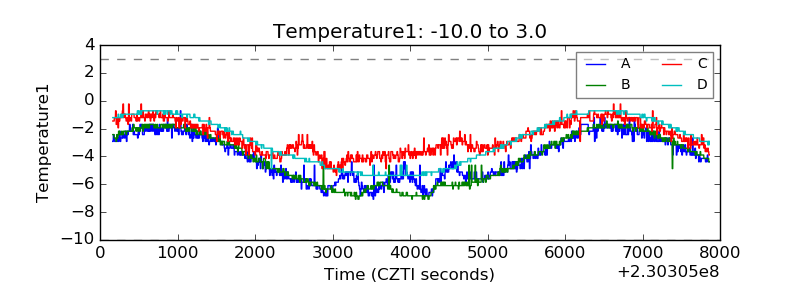 |
| Veto HV Monitor | 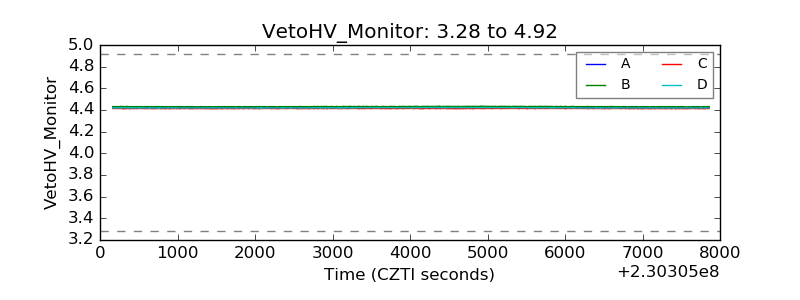 |
| Veto LLD | 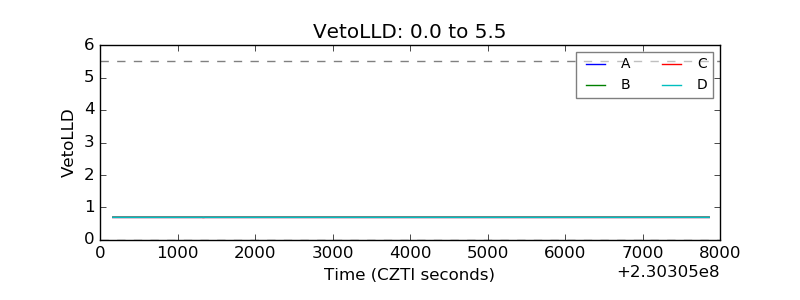 |
| Alpha Counter | 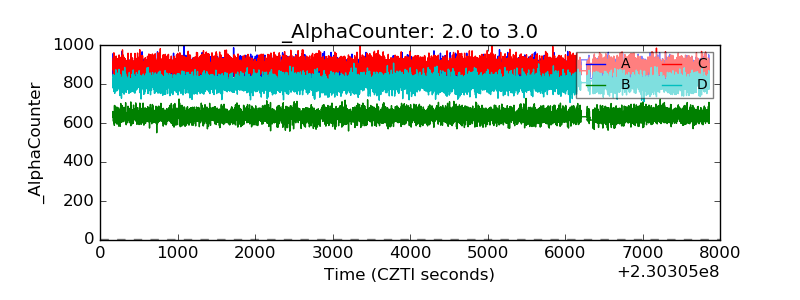 |
| _CPM_Rate | 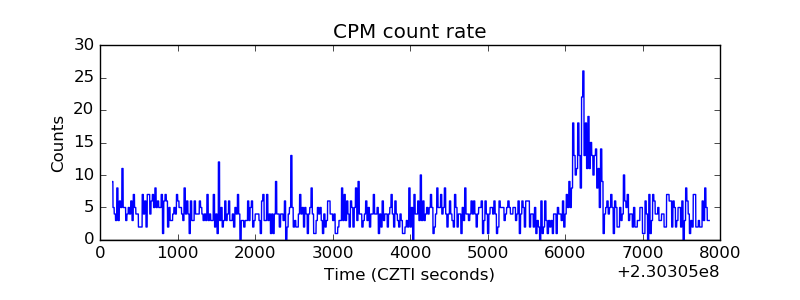 |
| CZT Counter | 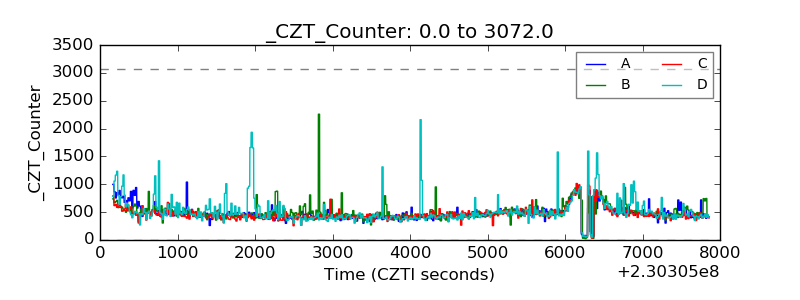 |
| +2.5 Volts monitor |  |
| +5 Volts monitor |  |
| _ROLL_ROT |  |
| _Roll_DEC | 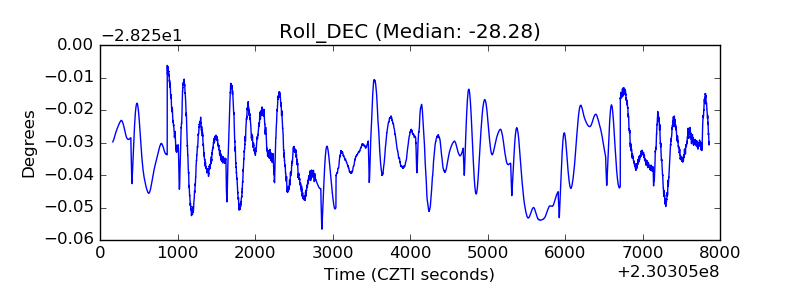 |
| _Roll_RA | 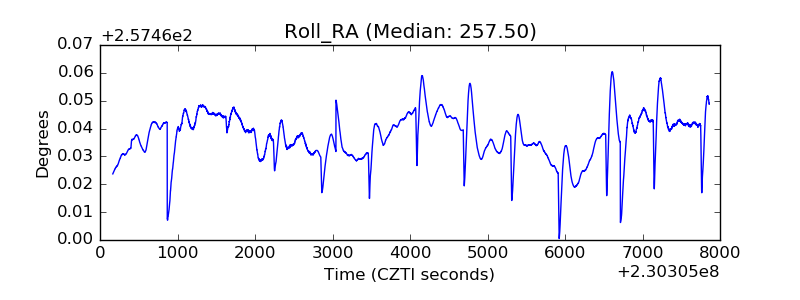 |
| Veto Counter | 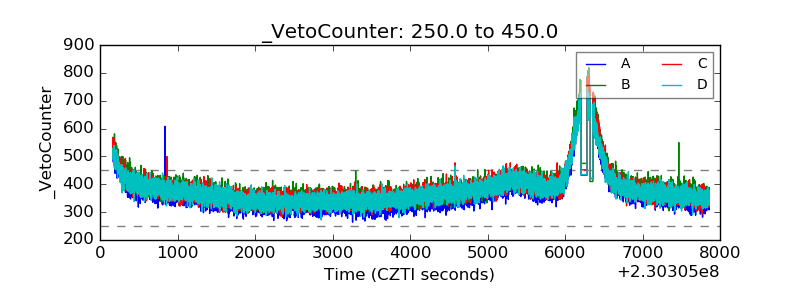 |