| Param | Original file | Final file |
|---|---|---|
| Filename | modeM0/AS1A03_106T01_9000001190cztM0_level2.fits | modeM0/AS1A03_106T01_9000001190cztM0_level2_quad_clean.evt |
| Size (bytes) | 67,222,080 | 58,919,040 |
| Size | 64.1 MB | 56.2 MB |
| Events in quadrant A | 413,426 | 343,886 |
| Events in quadrant B | 404,036 | 349,388 |
| Events in quadrant C | 418,192 | 341,243 |
| Events in quadrant D | 363,272 | 311,626 |
| Mode M9 | |||
|---|---|---|---|
| Quadrant | BADHDUFLAG | Total packets | Discarded packets |
| A | 0 | 14 | 0 |
| B | 0 | 14 | 0 |
| C | 0 | 14 | 0 |
| D | 0 | 14 | 0 |
| Mode M0 | |||
|---|---|---|---|
| Quadrant | BADHDUFLAG | Total packets | Discarded packets |
| A | 0 | 13057 | 0 |
| B | 0 | 13451 | 0 |
| C | 0 | 13008 | 0 |
| D | 0 | 13536 | 0 |
| Mode SS | |||
|---|---|---|---|
| Quadrant | BADHDUFLAG | Total packets | Discarded packets |
| A | 0 | 128 | 0 |
| B | 0 | 128 | 0 |
| C | 0 | 128 | 0 |
| D | 0 | 128 | 0 |
| Quadrant | Total seconds | Saturated seconds | Saturation percentage |
|---|---|---|---|
| A | 6262 | 32 | 0.511019% |
| B | 6262 | 33 | 0.526988% |
| C | 6262 | 28 | 0.447141% |
| D | 6263 | 34 | 0.542871% |
Noise dominated data is calculated using 1-second bins in cleaned event files. If a bin has >2000 counts, and if more than 50% of those come from <1% of pixels, then it is considered to be noise-dominated and hence unusable.
| Quadrant | # 1 sec bins | Bins with >0 counts | Bins with >2000 counts | High rate bins dominated by noise | Noise dominated (total time) | Noise dominated (detector-on time) | Marked lightcurve |
|---|---|---|---|---|---|---|---|
| A | 7642 | 6262 | 0 | 0 | 0.00% | 0.00% | 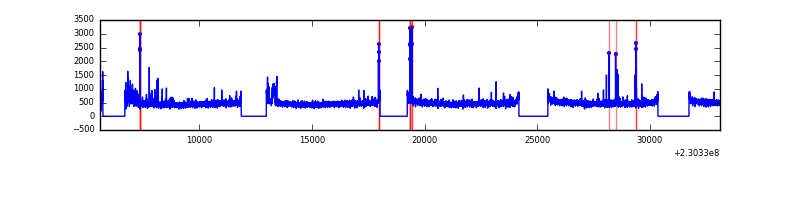 |
| B | 7642 | 6262 | 0 | 0 | 0.00% | 0.00% |  |
| C | 7642 | 6262 | 0 | 0 | 0.00% | 0.00% |  |
| D | 7642 | 6262 | 0 | 0 | 0.00% | 0.00% |  |
Top three noisy pixels from each quadrant. If the there are fewer than three noisy pixels in the level2.evt file, extra rows are filled as -1
| Pixel properties | Quadrant properties | ||||||
|---|---|---|---|---|---|---|---|
| Quadrant | DetID | PixID | Counts | Sigma | Mean | Median | Sigma |
| A | 0 | 29 | 402 | 10.89 | 107 | 102 | 27.5 |
| A | 7 | 110 | 346 | 8.86 | 107 | 102 | 27.5 |
| A | 9 | 19 | 336 | 8.5 | 107 | 102 | 27.5 |
| B | 2 | 9 | 338 | 10.16 | 106 | 102 | 23.2 |
| B | 12 | 226 | 271 | 7.28 | 106 | 102 | 23.2 |
| B | 2 | 8 | 271 | 7.28 | 106 | 102 | 23.2 |
| C | 1 | 80 | 346 | 7.95 | 110 | 104 | 30.4 |
| C | 1 | 81 | 327 | 7.32 | 110 | 104 | 30.4 |
| C | 9 | 188 | 296 | 6.31 | 110 | 104 | 30.4 |
| D | 6 | 67 | 276 | 6.41 | 103 | 94 | 28.3 |
| D | 3 | 14 | 274 | 6.34 | 103 | 94 | 28.3 |
| D | 7 | 5 | 272 | 6.27 | 103 | 94 | 28.3 |
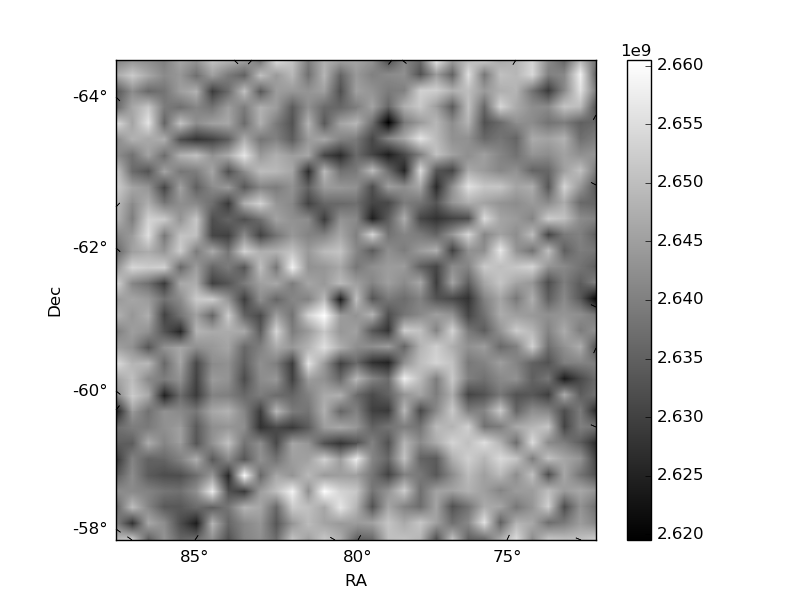
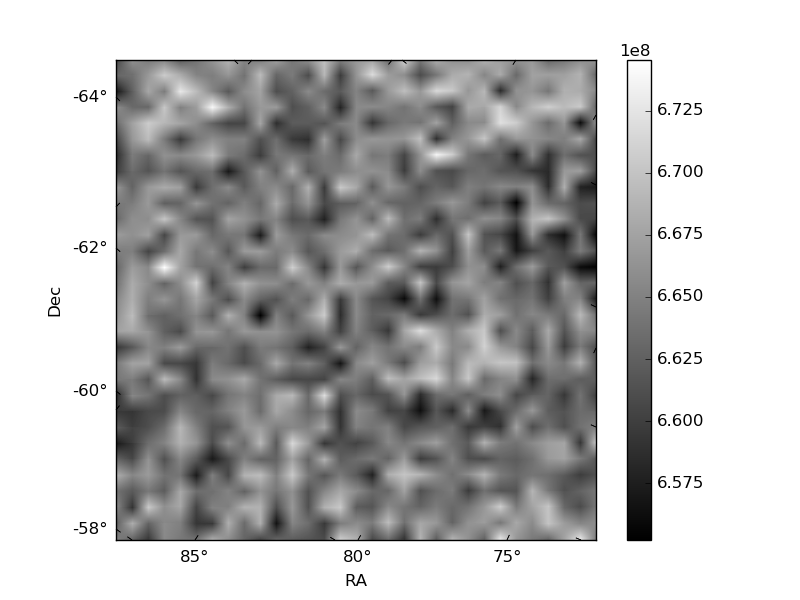
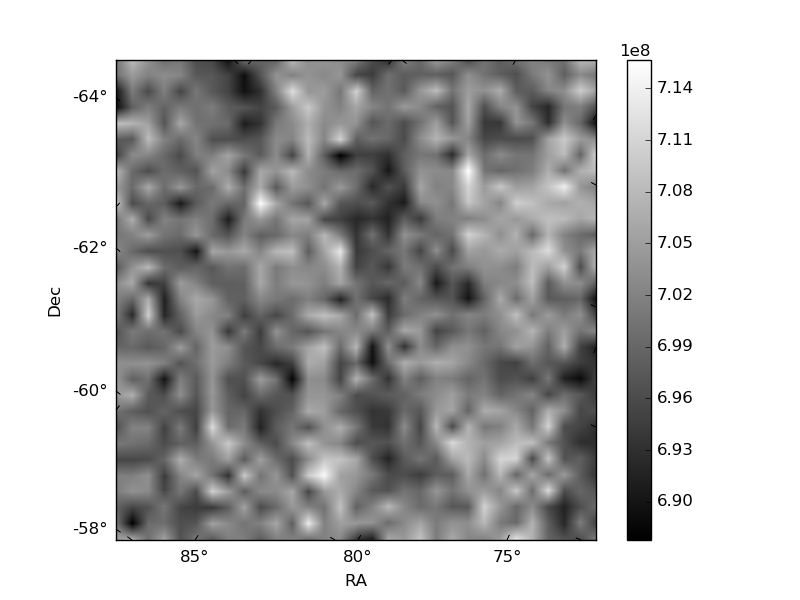
Histogram calculated using DETX and DETY for each event in the final _common_clean file
| Quadrant A | 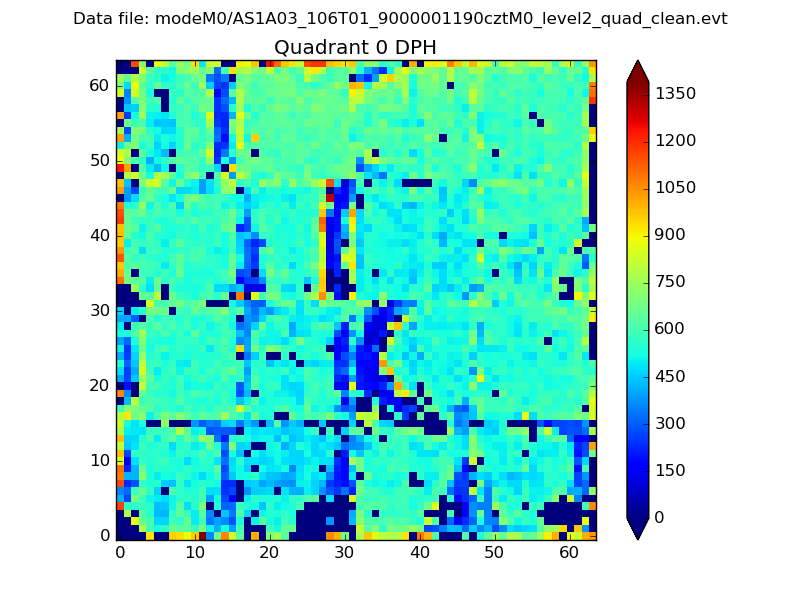 |
 |
Quadrant B |
|---|---|---|---|
| Quadrant D | 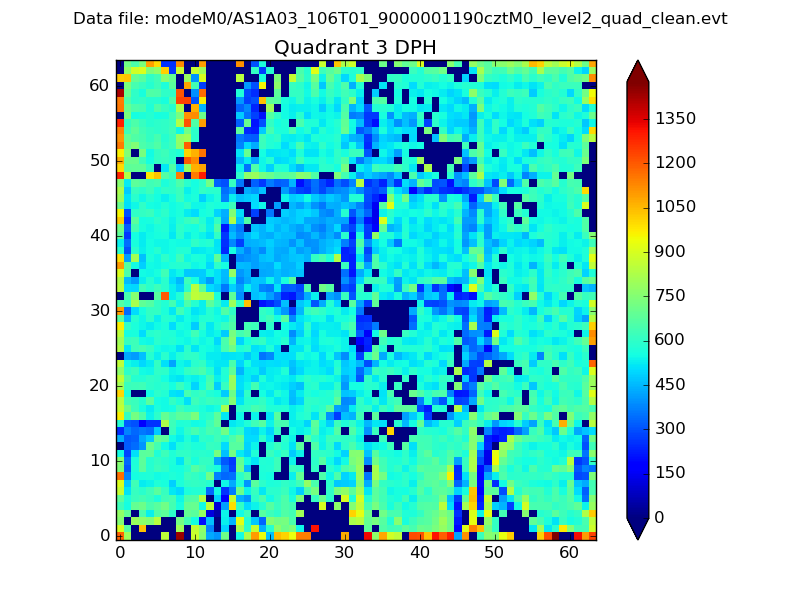 |
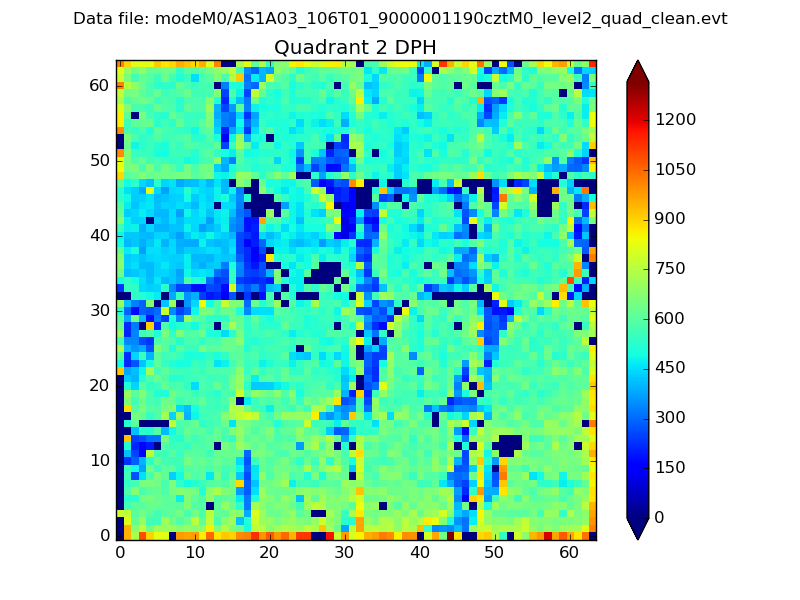 |
Quadrant C |
| Plot type | Count rate plots | Images |
|---|---|---|
| Comparison with Poisson distribution Blue bars denote a histogram of data divided into 1 sec bins. Red curve is a Poisson curve with rate = median count rate of data. |
 |
 |
| Quadrant-wise count rates Data is divided into 100 sec bins |
 |
|
| Module-wise count rates for Quadrant A Data is divided into 100 sec bins |
 |
 |
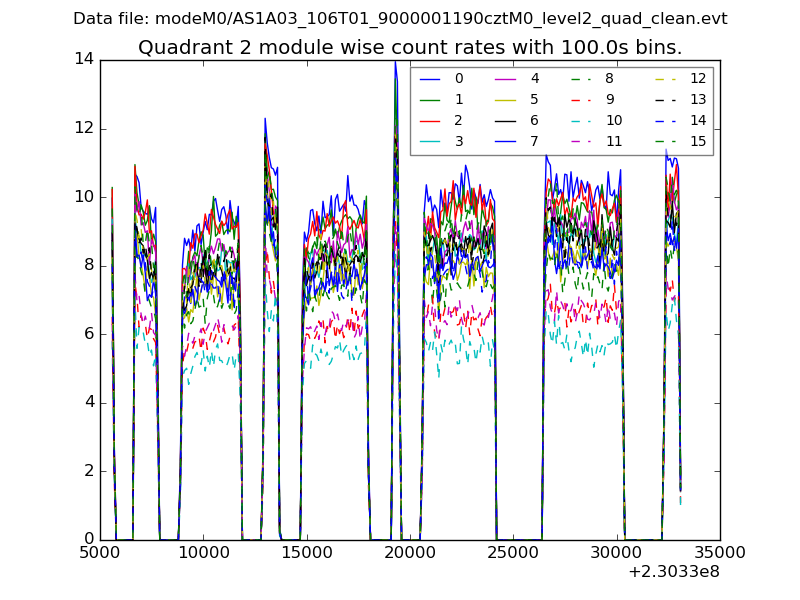
| Module-wise count rates for Quadrant B Data is divided into 100 sec bins |
 |
 |
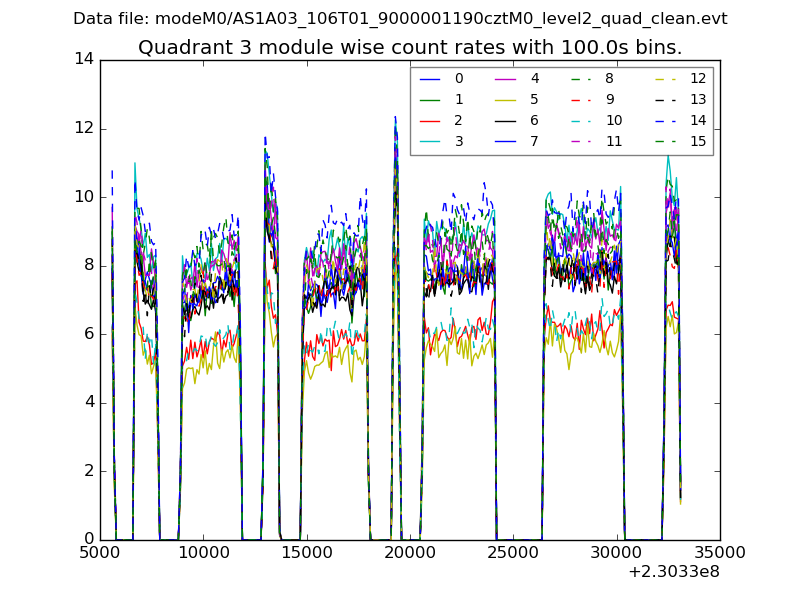
| Module-wise count rates for Quadrant C Data is divided into 100 sec bins |
 |
 |
| Module-wise count rates for Quadrant D Data is divided into 100 sec bins |
 |
 |
| Parameter | Plot |
|---|---|
| CZT HV Monitor | 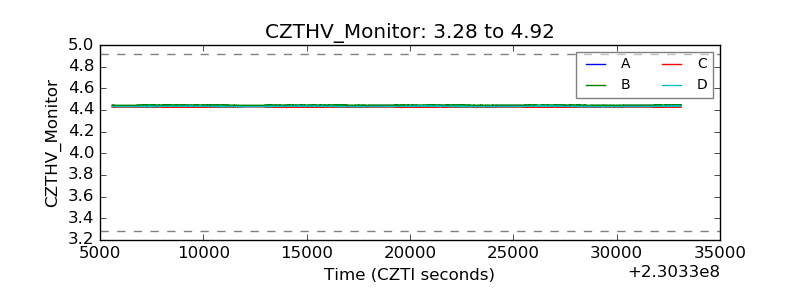 |
| D_VDD |  |
| Temperature 1 |  |
| Veto HV Monitor |  |
| Veto LLD |  |
| Alpha Counter |  |
| _CPM_Rate |  |
| CZT Counter |  |
| +2.5 Volts monitor |  |
| +5 Volts monitor |  |
| _ROLL_ROT |  |
| _Roll_DEC |  |
| _Roll_RA |  |
| Veto Counter |  |