| Param | Original file | Final file |
|---|---|---|
| Filename | modeM0/AS1A03_106T01_9000001190_08433cztM0_level2.evt | modeM0/AS1A03_106T01_9000001190_08433cztM0_level2_quad_clean.evt |
| Size (bytes) | 440,959,680 | 103,020,480 |
| Size | 420.5 MB | 98.2 MB |
| Events in quadrant A | 3,157,102 | 669,693 |
| Events in quadrant B | 3,514,086 | 670,111 |
| Events in quadrant C | 2,929,695 | 667,646 |
| Events in quadrant D | 3,294,862 | 642,464 |
| Mode M9 | |||
|---|---|---|---|
| Quadrant | BADHDUFLAG | Total packets | Discarded packets |
| A | 0 | 17 | 0 |
| B | 0 | 17 | 0 |
| C | 0 | 17 | 0 |
| D | 0 | 17 | 0 |
| Mode M0 | |||
|---|---|---|---|
| Quadrant | BADHDUFLAG | Total packets | Discarded packets |
| A | 0 | 14067 | 3 |
| B | 0 | 14879 | 2 |
| C | 0 | 13613 | 2 |
| D | 0 | 14877 | 2 |
| Mode SS | |||
|---|---|---|---|
| Quadrant | BADHDUFLAG | Total packets | Discarded packets |
| A | 0 | 140 | 0 |
| B | 0 | 140 | 0 |
| C | 0 | 140 | 0 |
| D | 0 | 140 | 0 |
| Quadrant | Total seconds | Saturated seconds | Saturation percentage |
|---|---|---|---|
| A | 6740 | 35 | 0.519288% |
| B | 6740 | 116 | 1.721068% |
| C | 6740 | 9 | 0.133531% |
| D | 6740 | 29 | 0.430267% |
Noise dominated data is calculated using 1-second bins in cleaned event files. If a bin has >2000 counts, and if more than 50% of those come from <1% of pixels, then it is considered to be noise-dominated and hence unusable.
| Quadrant | # 1 sec bins | Bins with >0 counts | Bins with >2000 counts | High rate bins dominated by noise | Noise dominated (total time) | Noise dominated (detector-on time) | Marked lightcurve |
|---|---|---|---|---|---|---|---|
| A | 8530 | 6742 | 5 | 5 | 0.06% | 0.07% | 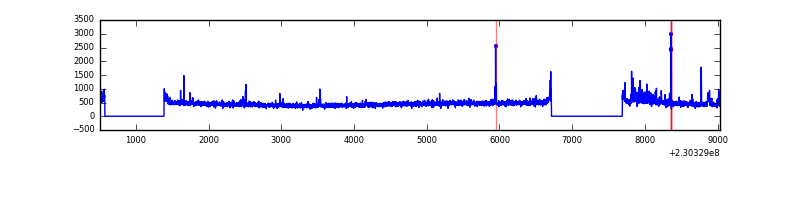 |
| B | 8530 | 6742 | 69 | 69 | 0.81% | 1.02% | 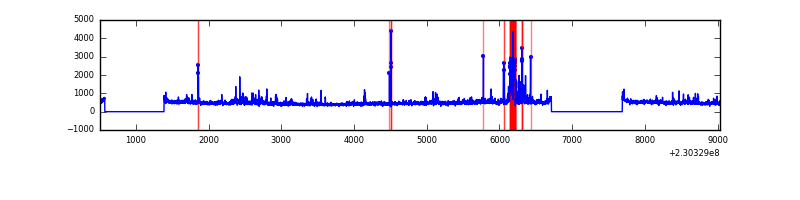 |
| C | 8530 | 6742 | 0 | 0 | 0.00% | 0.00% | 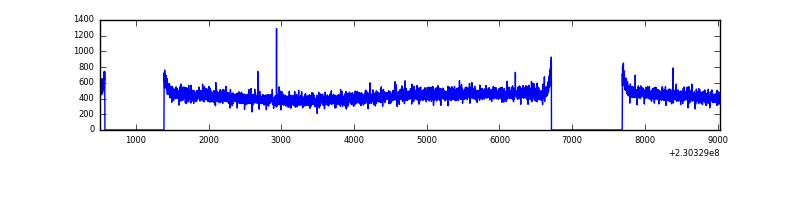 |
| D | 8530 | 6742 | 13 | 13 | 0.15% | 0.19% | 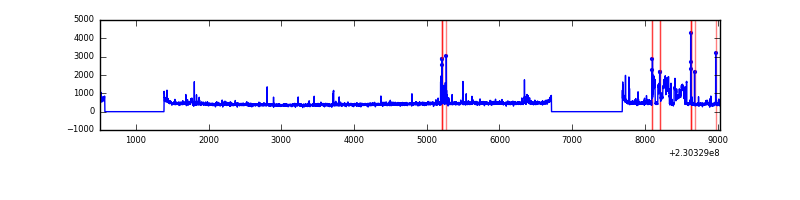 |
Top three noisy pixels from each quadrant. If the there are fewer than three noisy pixels in the level2.evt file, extra rows are filled as -1
| Pixel properties | Quadrant properties | ||||||
|---|---|---|---|---|---|---|---|
| Quadrant | DetID | PixID | Counts | Sigma | Mean | Median | Sigma |
| A | 15 | 236 | 107009 | 671.04 | 775 | 758 | 158.3 |
| A | 15 | 223 | 22834 | 139.42 | 775 | 758 | 158.3 |
| A | 15 | 239 | 9507 | 55.26 | 775 | 758 | 158.3 |
| B | 10 | 16 | 260764 | 1732.91 | 777 | 755 | 150.0 |
| B | 0 | 214 | 111661 | 739.17 | 777 | 755 | 150.0 |
| B | 4 | 81 | 74795 | 493.46 | 777 | 755 | 150.0 |
| C | 13 | 61 | 5961 | 30.03 | 750 | 752 | 173.5 |
| C | 8 | 222 | 3375 | 15.12 | 750 | 752 | 173.5 |
| C | 3 | 202 | 1869 | 6.44 | 750 | 752 | 173.5 |
| D | 7 | 71 | 275955 | 1488.03 | 747 | 722 | 185.0 |
| D | 12 | 221 | 45572 | 242.48 | 747 | 722 | 185.0 |
| D | 14 | 34 | 43963 | 233.78 | 747 | 722 | 185.0 |
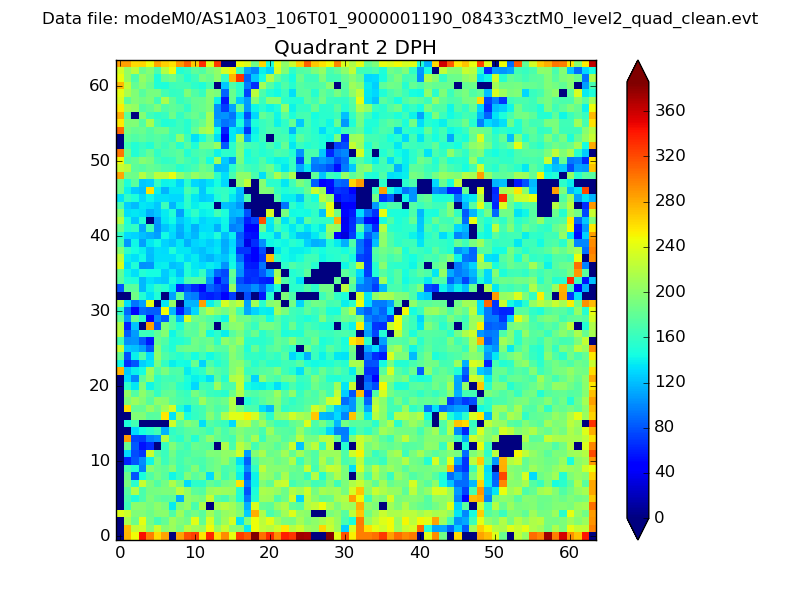
Histogram calculated using DETX and DETY for each event in the final _common_clean file
| Quadrant A |  |
 |
Quadrant B |
|---|---|---|---|
| Quadrant D | 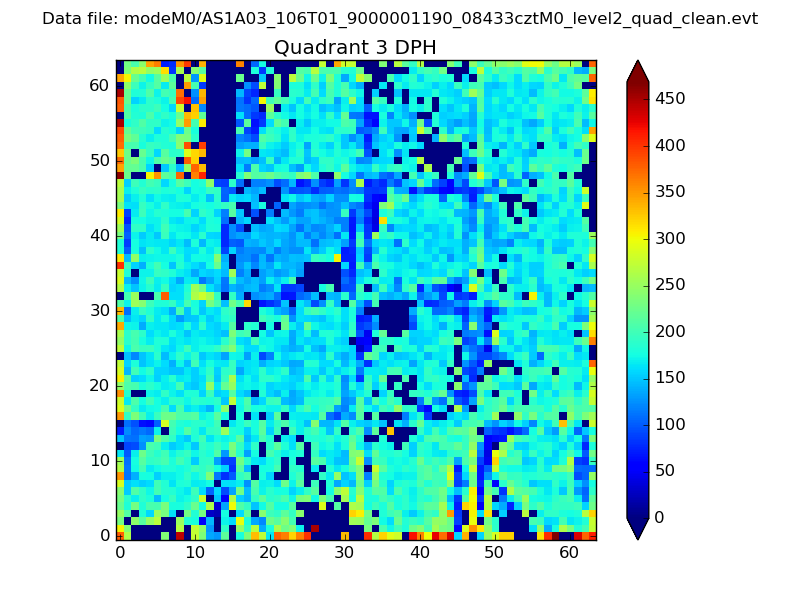 |
 |
Quadrant C |
| Plot type | Count rate plots | Images |
|---|---|---|
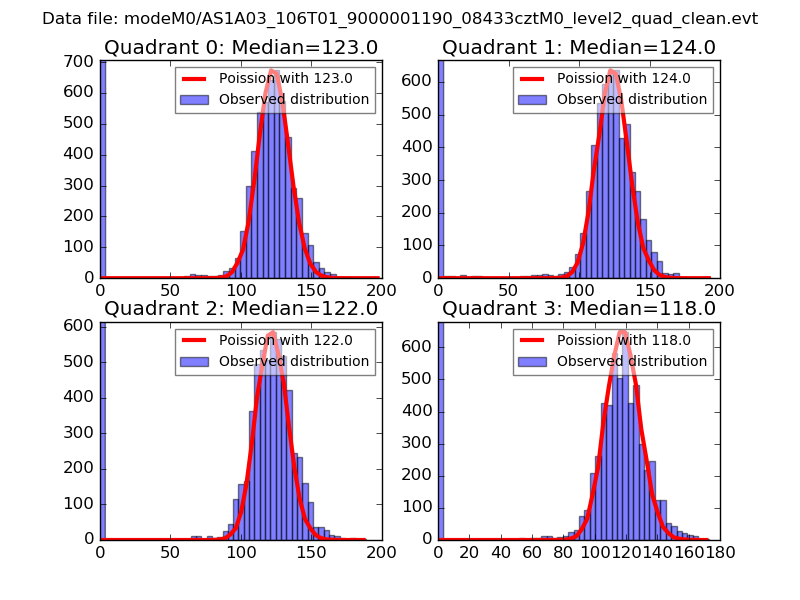
| Comparison with Poisson distribution Blue bars denote a histogram of data divided into 1 sec bins. Red curve is a Poisson curve with rate = median count rate of data. |
 |
 |
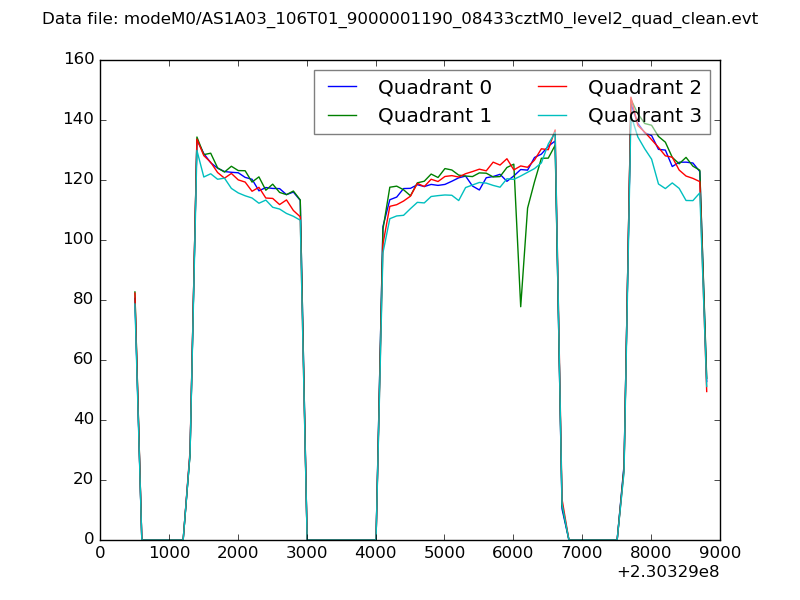
| Quadrant-wise count rates Data is divided into 100 sec bins |
 |
|
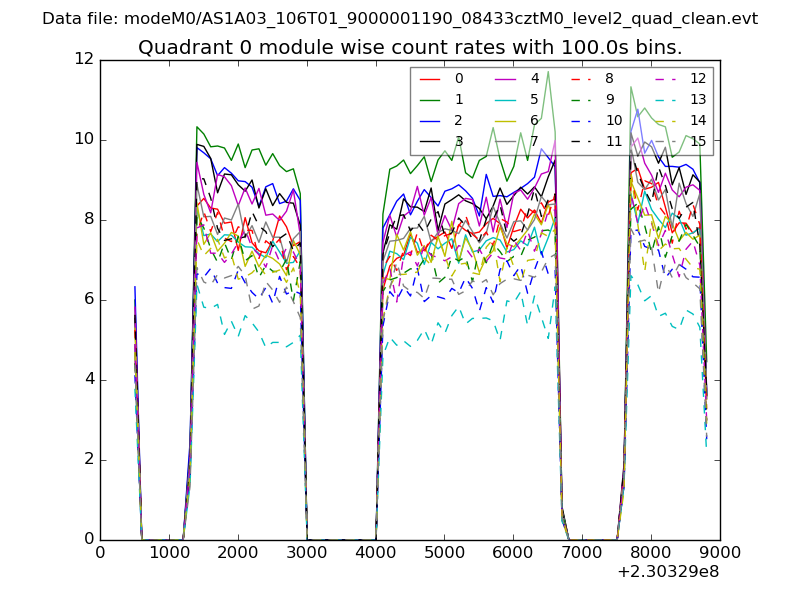
| Module-wise count rates for Quadrant A Data is divided into 100 sec bins |
 |
 |
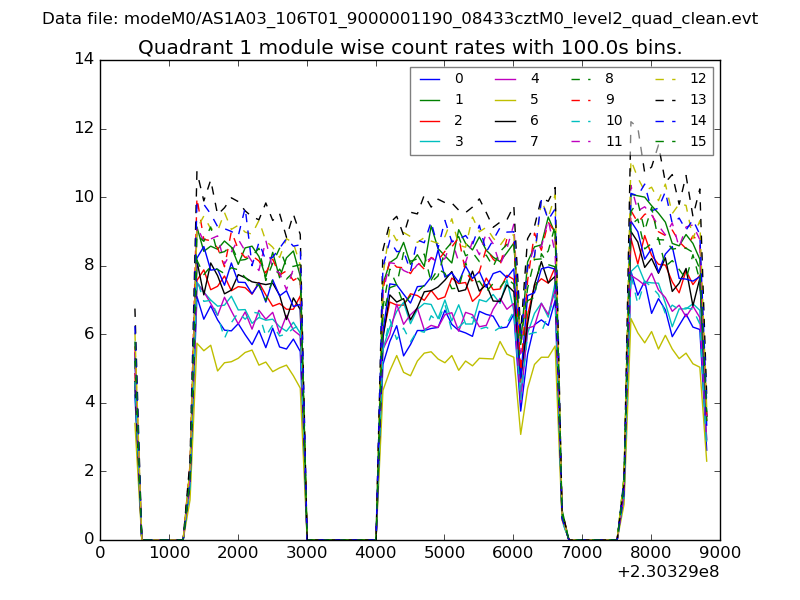
| Module-wise count rates for Quadrant B Data is divided into 100 sec bins |
 |
 |
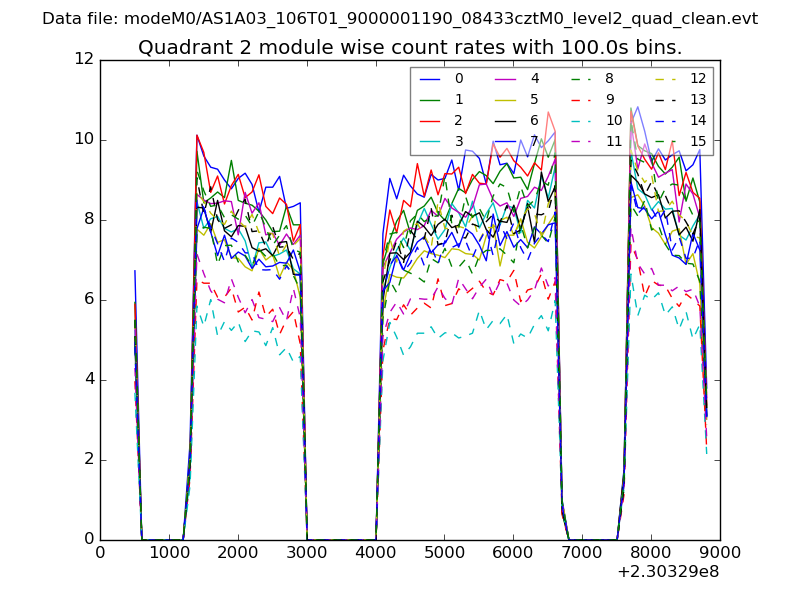
| Module-wise count rates for Quadrant C Data is divided into 100 sec bins |
 |
 |
| Module-wise count rates for Quadrant D Data is divided into 100 sec bins |
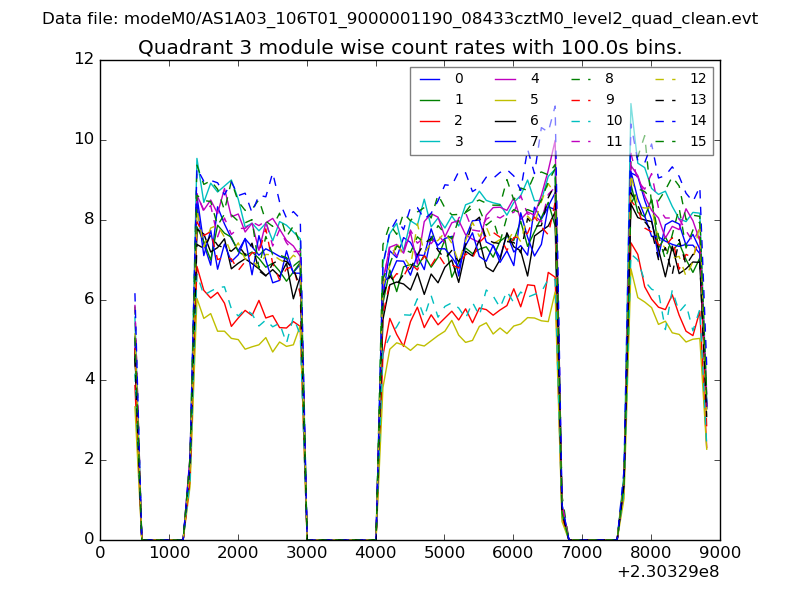 |
 |
| Parameter | Plot |
|---|---|
| CZT HV Monitor | 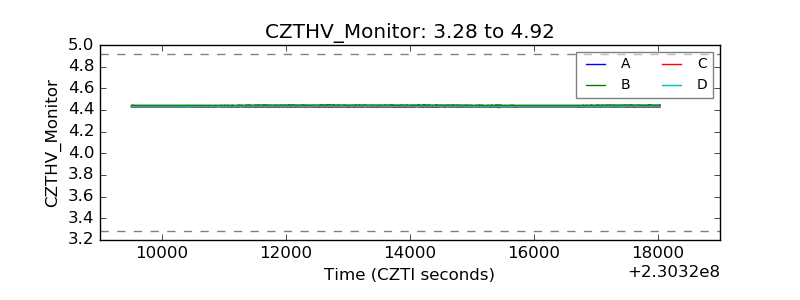 |
| D_VDD | 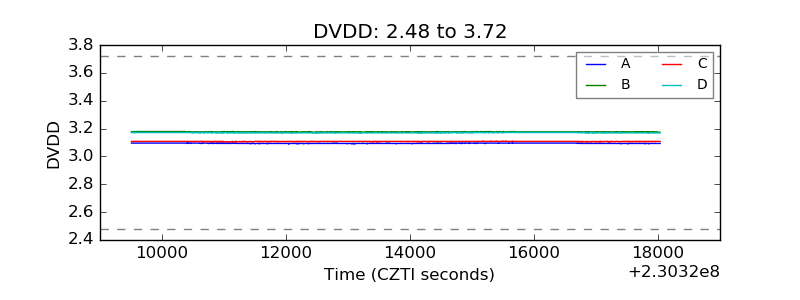 |
| Temperature 1 | 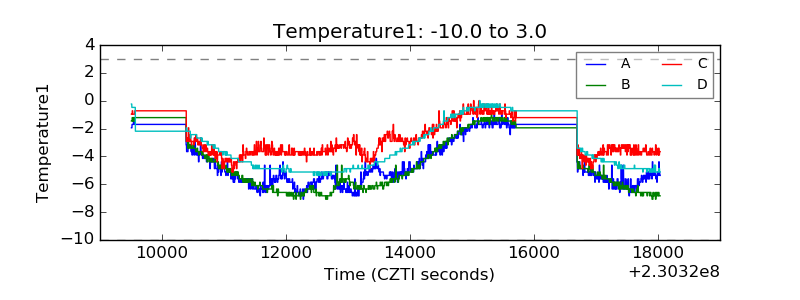 |
| Veto HV Monitor | 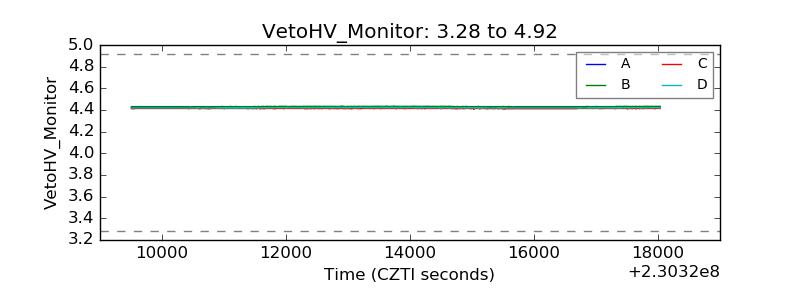 |
| Veto LLD | 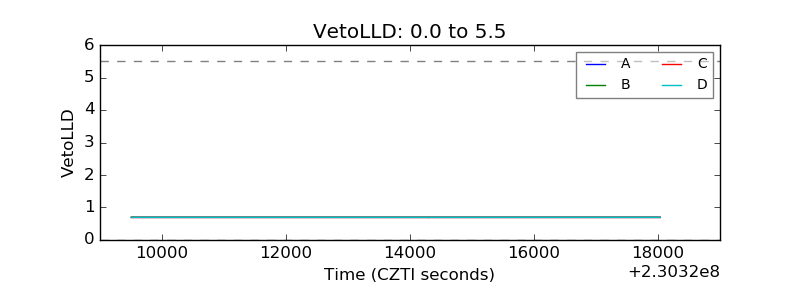 |
| Alpha Counter | 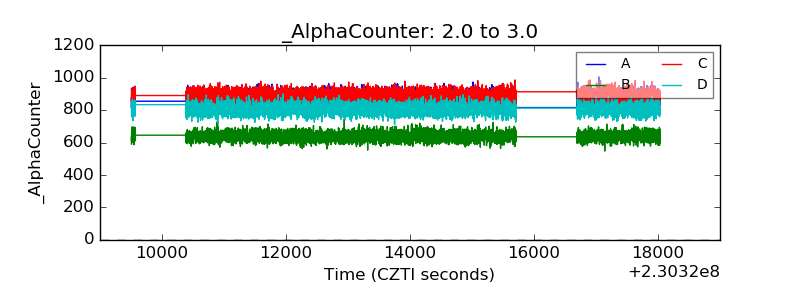 |
| _CPM_Rate | 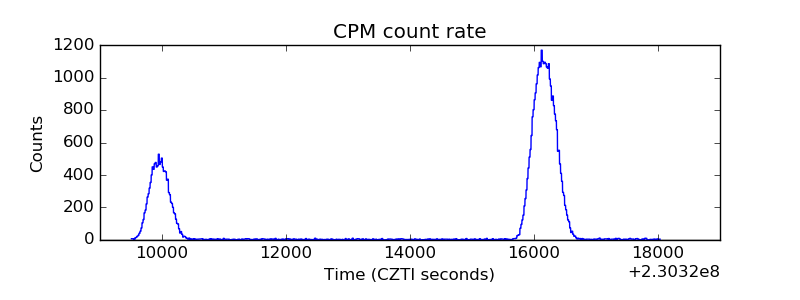 |
| CZT Counter | 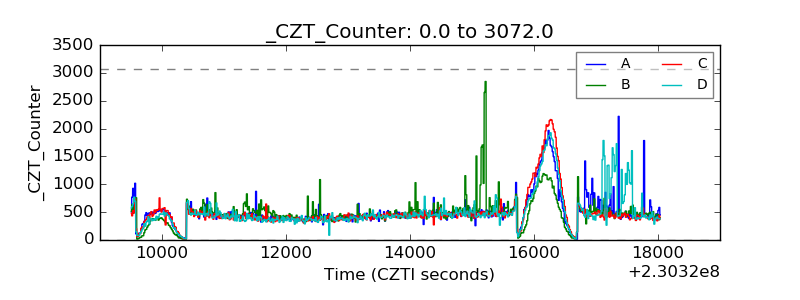 |
| +2.5 Volts monitor |  |
| +5 Volts monitor |  |
| _ROLL_ROT | 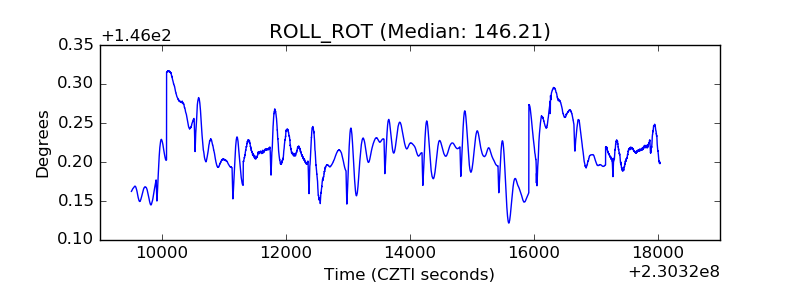 |
| _Roll_DEC | 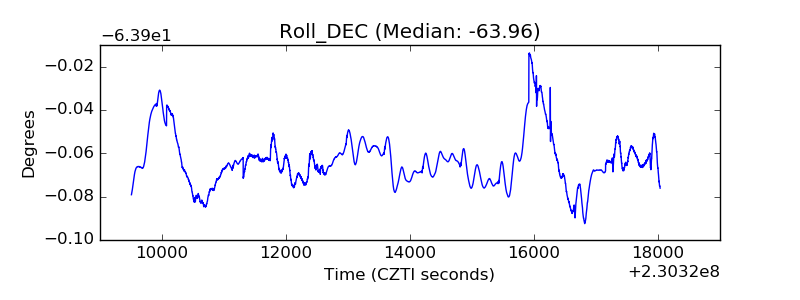 |
| _Roll_RA | 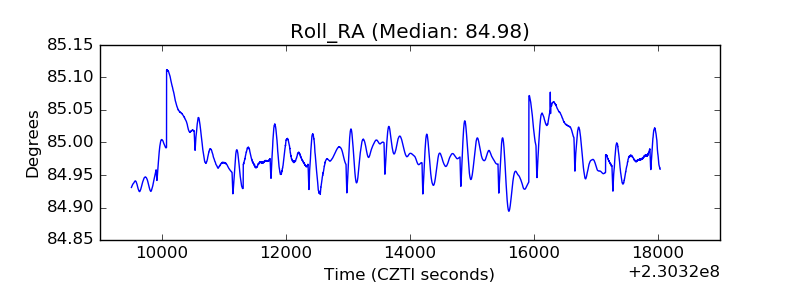 |
| Veto Counter | 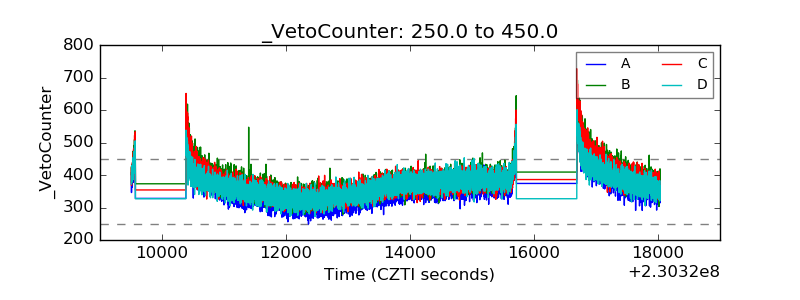 |