| Param | Original file | Final file |
|---|---|---|
| Filename | modeM0/AS1A03_106T01_9000001190_08436cztM0_level2.evt | modeM0/AS1A03_106T01_9000001190_08436cztM0_level2_quad_clean.evt |
| Size (bytes) | 448,819,200 | 90,616,320 |
| Size | 428.0 MB | 86.4 MB |
| Events in quadrant A | 3,260,871 | 570,858 |
| Events in quadrant B | 3,430,473 | 586,042 |
| Events in quadrant C | 3,095,939 | 577,595 |
| Events in quadrant D | 3,357,681 | 550,490 |
| Mode M9 | |||
|---|---|---|---|
| Quadrant | BADHDUFLAG | Total packets | Discarded packets |
| A | 0 | 13 | 0 |
| B | 0 | 13 | 0 |
| C | 0 | 13 | 0 |
| D | 0 | 14 | 0 |
| Mode M0 | |||
|---|---|---|---|
| Quadrant | BADHDUFLAG | Total packets | Discarded packets |
| A | 0 | 14050 | 3 |
| B | 0 | 14373 | 2 |
| C | 0 | 13494 | 2 |
| D | 0 | 14553 | 2 |
| Mode SS | |||
|---|---|---|---|
| Quadrant | BADHDUFLAG | Total packets | Discarded packets |
| A | 0 | 134 | 0 |
| B | 0 | 134 | 0 |
| C | 0 | 134 | 0 |
| D | 0 | 134 | 0 |
| Quadrant | Total seconds | Saturated seconds | Saturation percentage |
|---|---|---|---|
| A | 6583 | 57 | 0.865867% |
| B | 6583 | 62 | 0.941820% |
| C | 6583 | 32 | 0.486101% |
| D | 6583 | 63 | 0.957010% |
Noise dominated data is calculated using 1-second bins in cleaned event files. If a bin has >2000 counts, and if more than 50% of those come from <1% of pixels, then it is considered to be noise-dominated and hence unusable.
| Quadrant | # 1 sec bins | Bins with >0 counts | Bins with >2000 counts | High rate bins dominated by noise | Noise dominated (total time) | Noise dominated (detector-on time) | Marked lightcurve |
|---|---|---|---|---|---|---|---|
| A | 7793 | 6584 | 9 | 9 | 0.12% | 0.14% | 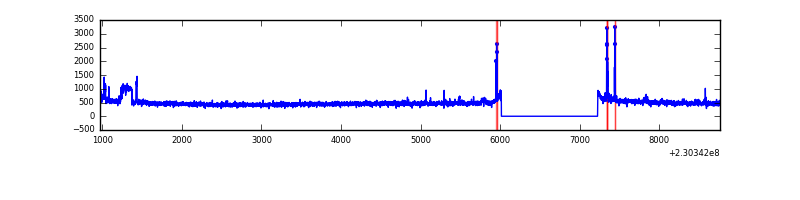 |
| B | 7793 | 6584 | 16 | 16 | 0.21% | 0.24% | 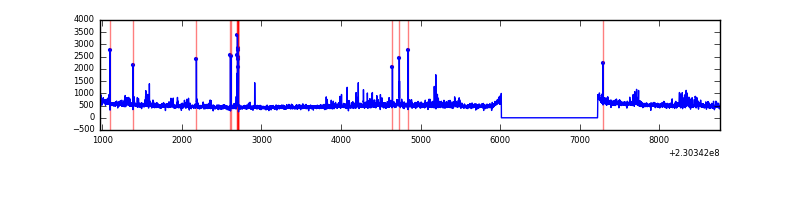 |
| C | 7793 | 6584 | 2 | 2 | 0.03% | 0.03% | 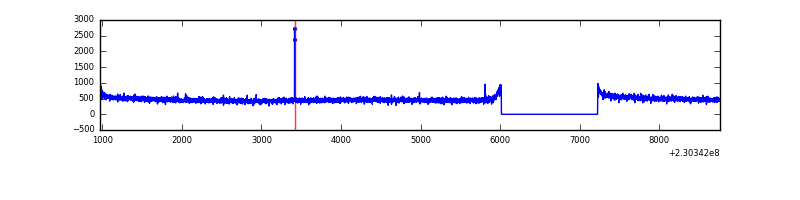 |
| D | 7793 | 6583 | 30 | 30 | 0.38% | 0.46% | 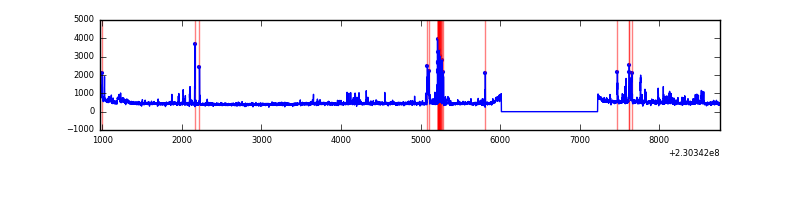 |
Top three noisy pixels from each quadrant. If the there are fewer than three noisy pixels in the level2.evt file, extra rows are filled as -1
| Pixel properties | Quadrant properties | ||||||
|---|---|---|---|---|---|---|---|
| Quadrant | DetID | PixID | Counts | Sigma | Mean | Median | Sigma |
| A | 15 | 236 | 84800 | 528.4 | 799 | 785 | 159.0 |
| A | 14 | 111 | 34947 | 214.86 | 799 | 785 | 159.0 |
| A | 15 | 223 | 32364 | 198.61 | 799 | 785 | 159.0 |
| B | 0 | 214 | 115606 | 772.37 | 809 | 792 | 148.7 |
| B | 4 | 81 | 90202 | 601.47 | 809 | 792 | 148.7 |
| B | 10 | 16 | 44758 | 295.76 | 809 | 792 | 148.7 |
| C | 8 | 128 | 12647 | 66.42 | 786 | 791 | 178.5 |
| C | 13 | 61 | 6890 | 34.17 | 786 | 791 | 178.5 |
| C | 8 | 112 | 6202 | 30.31 | 786 | 791 | 178.5 |
| D | 6 | 225 | 198257 | 1049.27 | 779 | 755 | 188.2 |
| D | 12 | 233 | 97518 | 514.07 | 779 | 755 | 188.2 |
| D | 2 | 14 | 46412 | 242.56 | 779 | 755 | 188.2 |
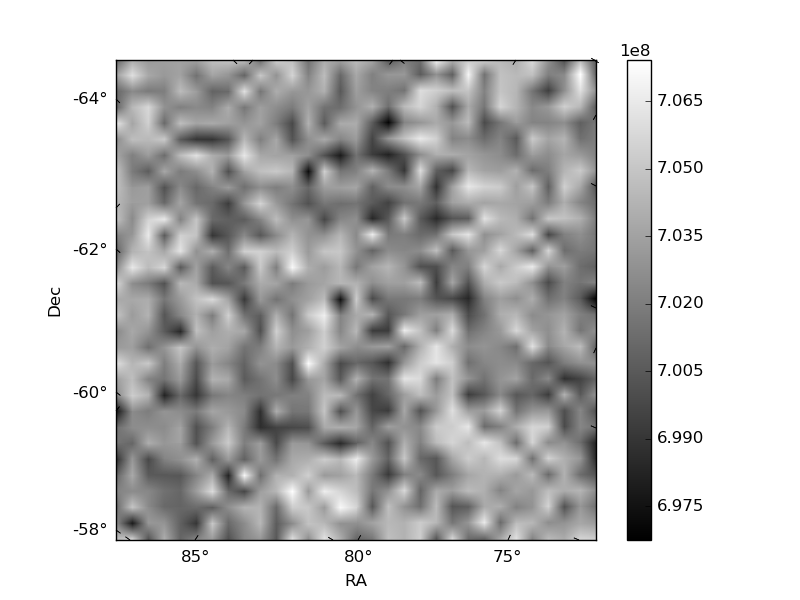
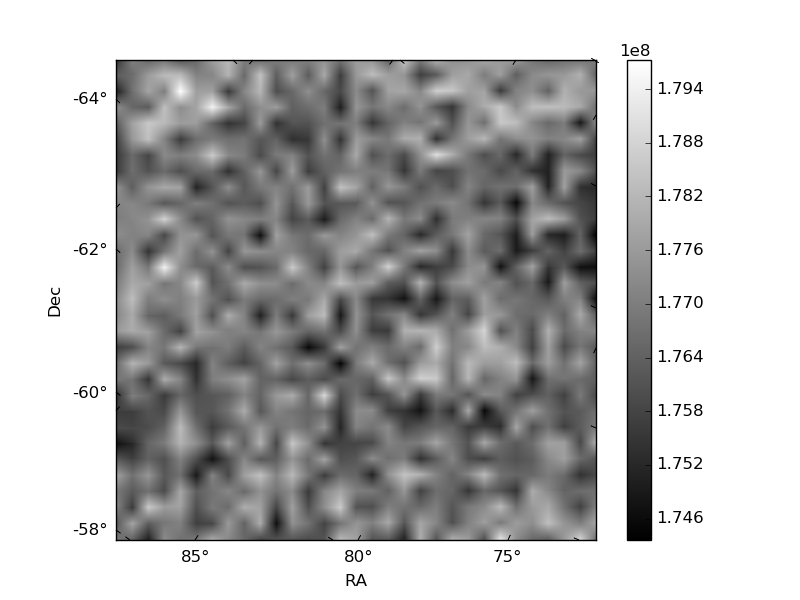
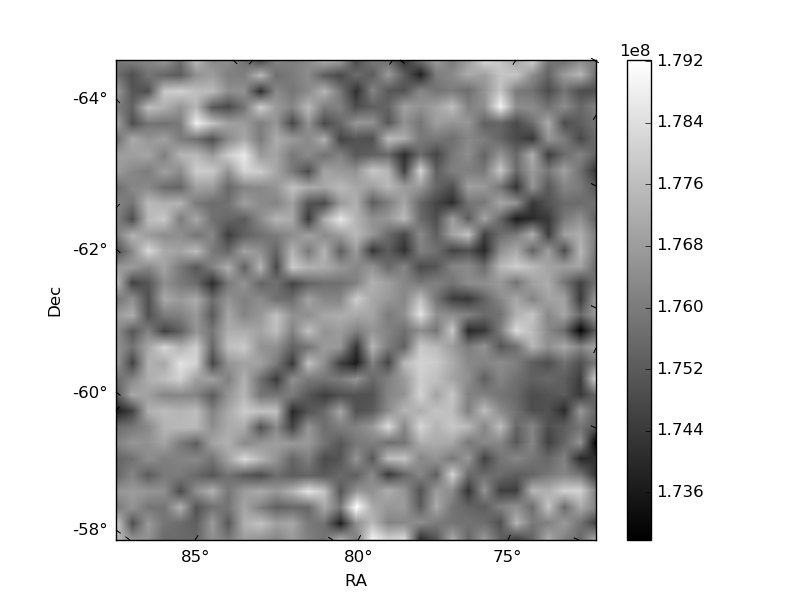
Histogram calculated using DETX and DETY for each event in the final _common_clean file
| Quadrant A | 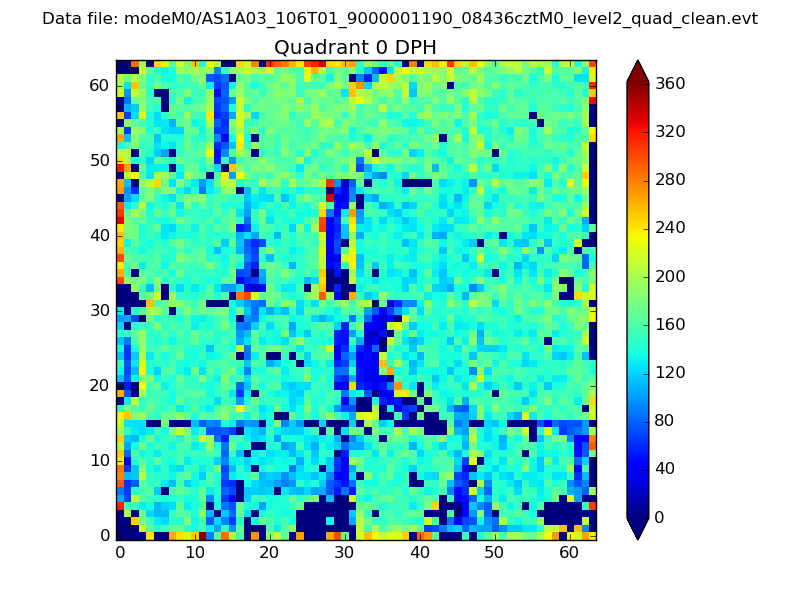 |
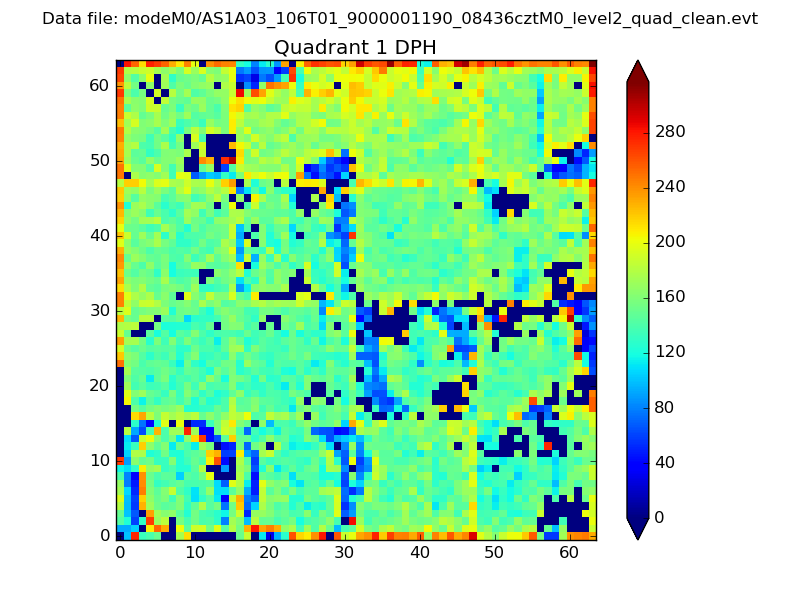 |
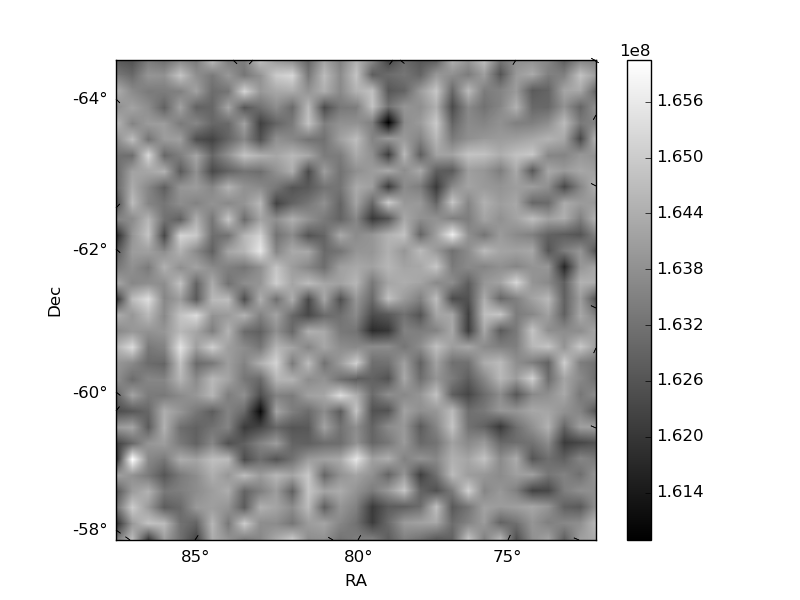
Quadrant B |
|---|---|---|---|
| Quadrant D | 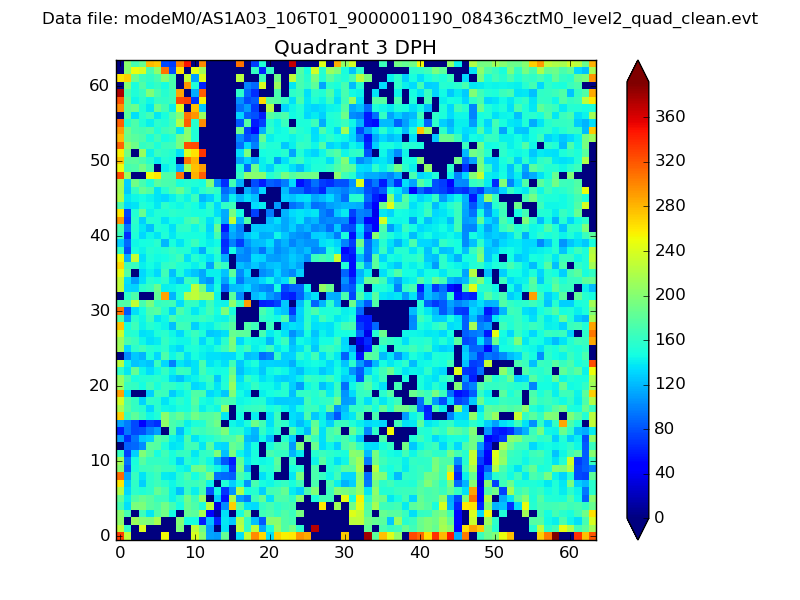 |
 |
Quadrant C |
| Plot type | Count rate plots | Images |
|---|---|---|
| Comparison with Poisson distribution Blue bars denote a histogram of data divided into 1 sec bins. Red curve is a Poisson curve with rate = median count rate of data. |
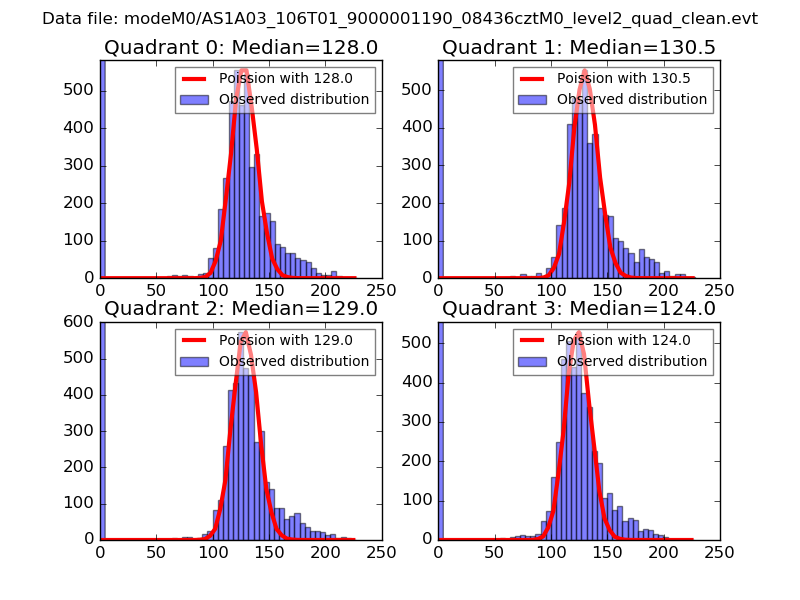 |
 |
| Quadrant-wise count rates Data is divided into 100 sec bins |
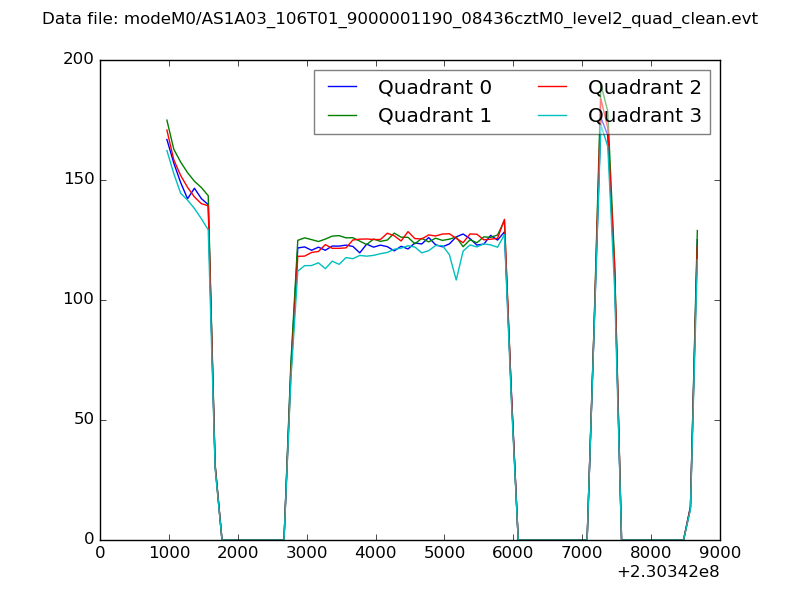 |
|
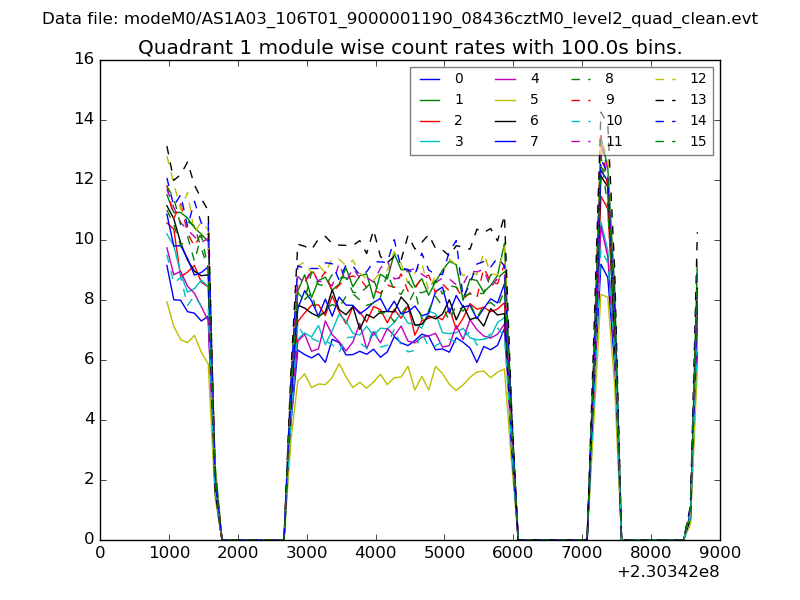
| Module-wise count rates for Quadrant A Data is divided into 100 sec bins |
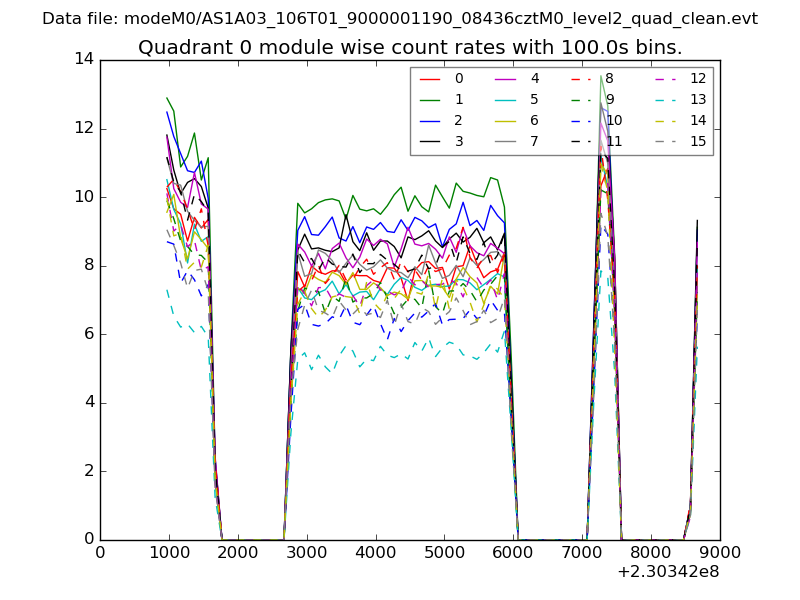 |
 |
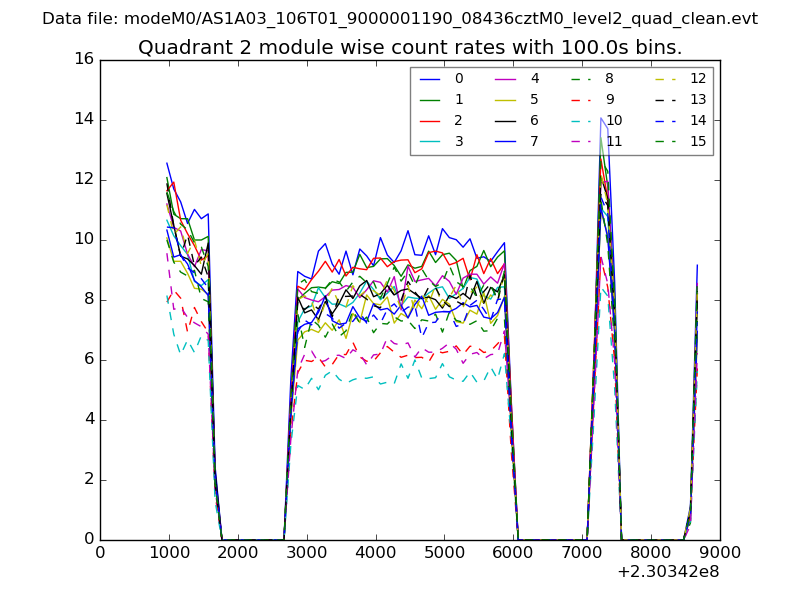
| Module-wise count rates for Quadrant B Data is divided into 100 sec bins |
 |
 |
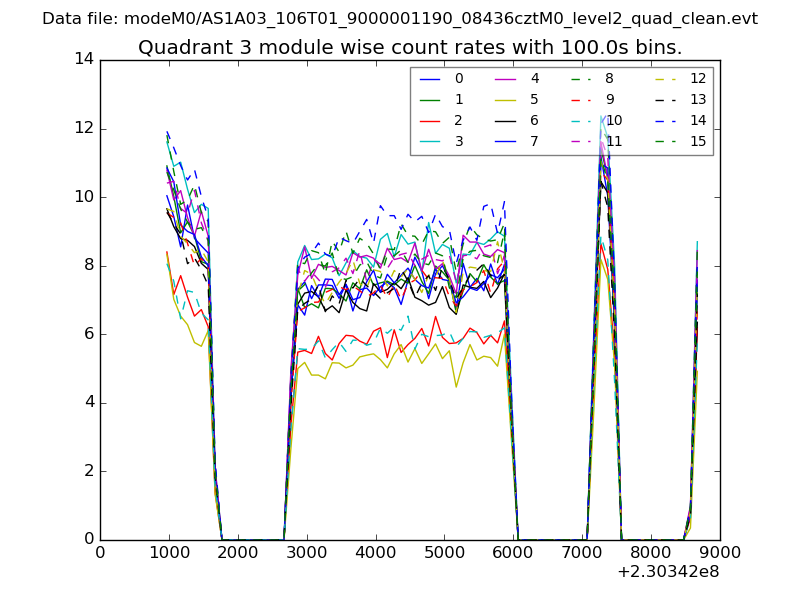
| Module-wise count rates for Quadrant C Data is divided into 100 sec bins |
 |
 |
| Module-wise count rates for Quadrant D Data is divided into 100 sec bins |
 |
 |
| Parameter | Plot |
|---|---|
| CZT HV Monitor |  |
| D_VDD | 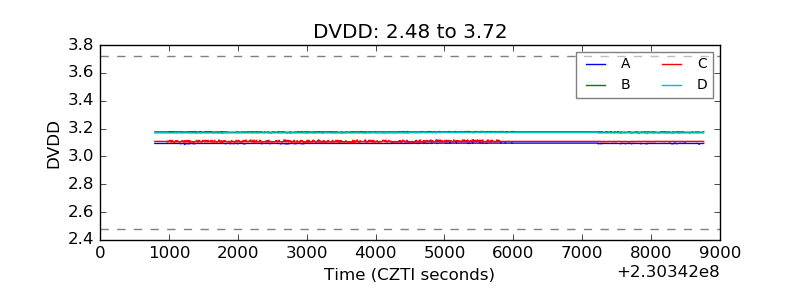 |
| Temperature 1 | 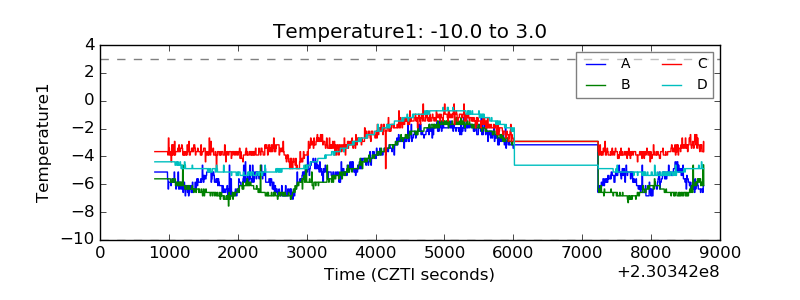 |
| Veto HV Monitor | 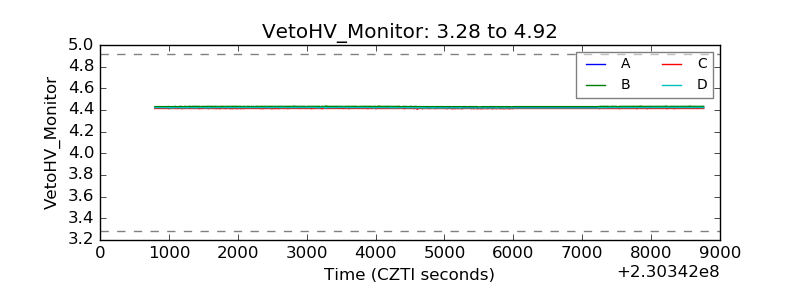 |
| Veto LLD | 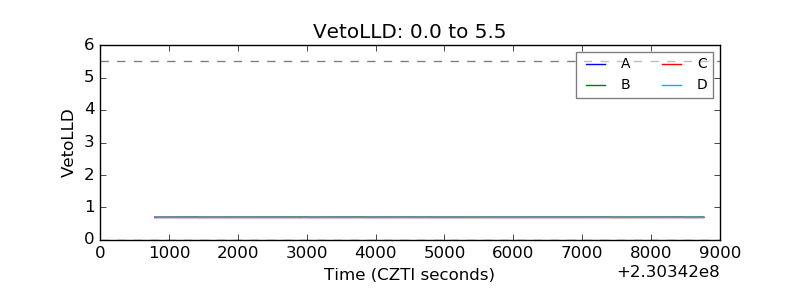 |
| Alpha Counter | 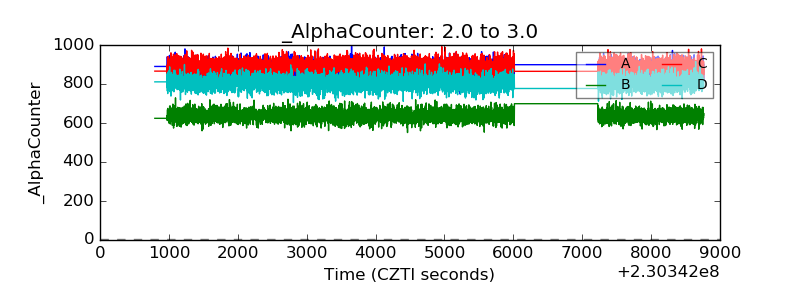 |
| _CPM_Rate | 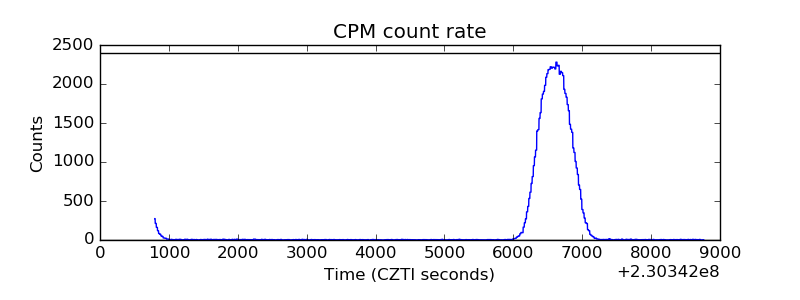 |
| CZT Counter |  |
| +2.5 Volts monitor |  |
| +5 Volts monitor | 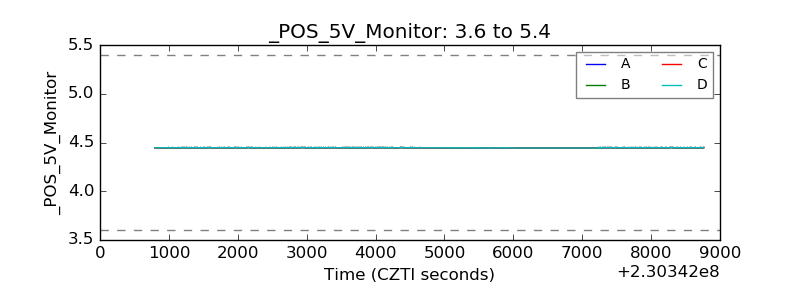 |
| _ROLL_ROT | 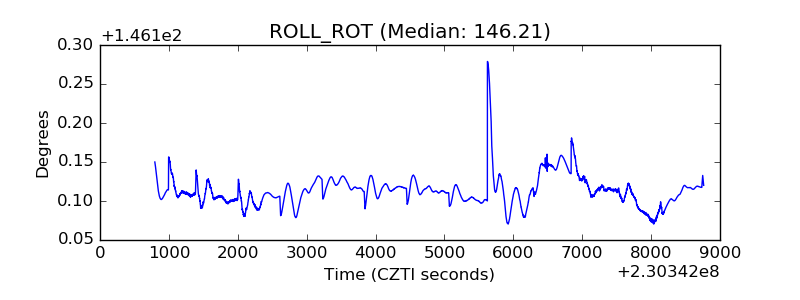 |
| _Roll_DEC | 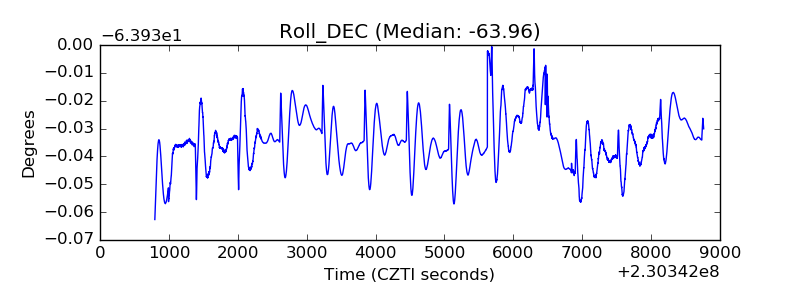 |
| _Roll_RA |  |
| Veto Counter |  |