| Param | Original file | Final file |
|---|---|---|
| Filename | modeM0/AS1A03_074T01_9000001192_08440cztM0_level2.evt | modeM0/AS1A03_074T01_9000001192_08440cztM0_level2_quad_clean.evt |
| Size (bytes) | 461,410,560 | 80,622,720 |
| Size | 440.0 MB | 76.9 MB |
| Events in quadrant A | 3,292,616 | 487,944 |
| Events in quadrant B | 3,529,740 | 494,969 |
| Events in quadrant C | 3,245,849 | 503,299 |
| Events in quadrant D | 3,446,487 | 484,309 |
| Mode SS | |||
|---|---|---|---|
| Quadrant | BADHDUFLAG | Total packets | Discarded packets |
| A | 0 | 138 | 0 |
| B | 0 | 138 | 0 |
| C | 0 | 138 | 0 |
| D | 0 | 138 | 0 |
| Mode M9 | |||
|---|---|---|---|
| Quadrant | BADHDUFLAG | Total packets | Discarded packets |
| A | 0 | 10 | 0 |
| B | 0 | 10 | 0 |
| C | 0 | 10 | 0 |
| D | 0 | 10 | 0 |
| Mode M0 | |||
|---|---|---|---|
| Quadrant | BADHDUFLAG | Total packets | Discarded packets |
| A | 0 | 14006 | 2 |
| B | 0 | 14579 | 1 |
| C | 0 | 14052 | 1 |
| D | 0 | 14659 | 1 |
| Quadrant | Total seconds | Saturated seconds | Saturation percentage |
|---|---|---|---|
| A | 6752 | 115 | 1.703199% |
| B | 6752 | 125 | 1.851303% |
| C | 6752 | 79 | 1.170024% |
| D | 6752 | 118 | 1.747630% |
Noise dominated data is calculated using 1-second bins in cleaned event files. If a bin has >2000 counts, and if more than 50% of those come from <1% of pixels, then it is considered to be noise-dominated and hence unusable.
| Quadrant | # 1 sec bins | Bins with >0 counts | Bins with >2000 counts | High rate bins dominated by noise | Noise dominated (total time) | Noise dominated (detector-on time) | Marked lightcurve |
|---|---|---|---|---|---|---|---|
| A | 7772 | 6752 | 0 | 0 | 0.00% | 0.00% |  |
| B | 7772 | 6753 | 4 | 4 | 0.05% | 0.06% |  |
| C | 7772 | 6753 | 2 | 2 | 0.03% | 0.03% |  |
| D | 7772 | 6753 | 19 | 19 | 0.24% | 0.28% | 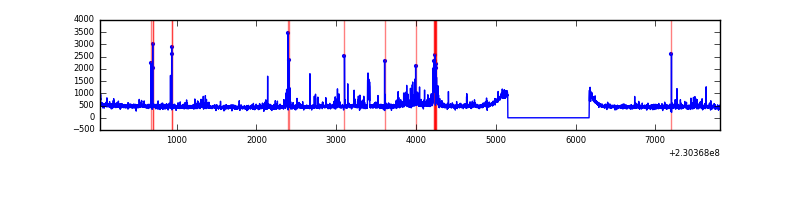 |
Top three noisy pixels from each quadrant. If the there are fewer than three noisy pixels in the level2.evt file, extra rows are filled as -1
| Pixel properties | Quadrant properties | ||||||
|---|---|---|---|---|---|---|---|
| Quadrant | DetID | PixID | Counts | Sigma | Mean | Median | Sigma |
| A | 0 | 128 | 20337 | 113.57 | 842 | 824 | 171.8 |
| A | 13 | 251 | 18897 | 105.19 | 842 | 824 | 171.8 |
| A | 4 | 2 | 10836 | 58.27 | 842 | 824 | 171.8 |
| B | 0 | 214 | 91278 | 568.02 | 839 | 818 | 159.3 |
| B | 4 | 81 | 81614 | 507.34 | 839 | 818 | 159.3 |
| B | 11 | 51 | 49586 | 306.23 | 839 | 818 | 159.3 |
| C | 13 | 255 | 46224 | 239.97 | 818 | 823 | 189.2 |
| C | 13 | 61 | 13817 | 68.68 | 818 | 823 | 189.2 |
| C | 14 | 67 | 2772 | 10.3 | 818 | 823 | 189.2 |
| D | 2 | 152 | 117309 | 579.46 | 821 | 798 | 201.1 |
| D | 7 | 71 | 107721 | 531.78 | 821 | 798 | 201.1 |
| D | 1 | 52 | 38859 | 189.29 | 821 | 798 | 201.1 |
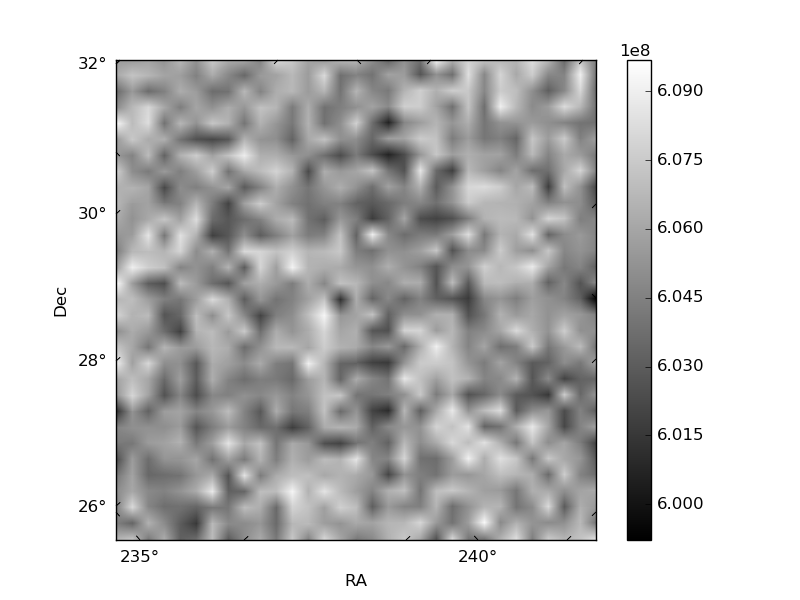
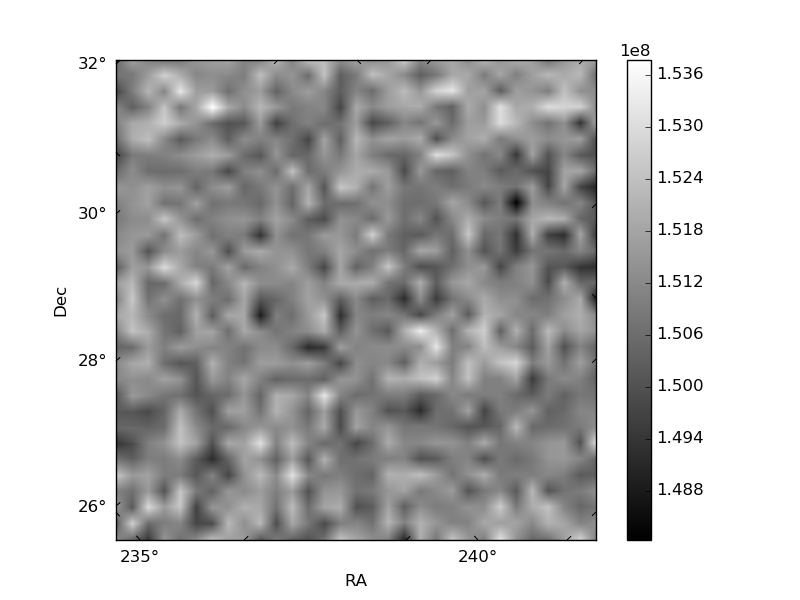
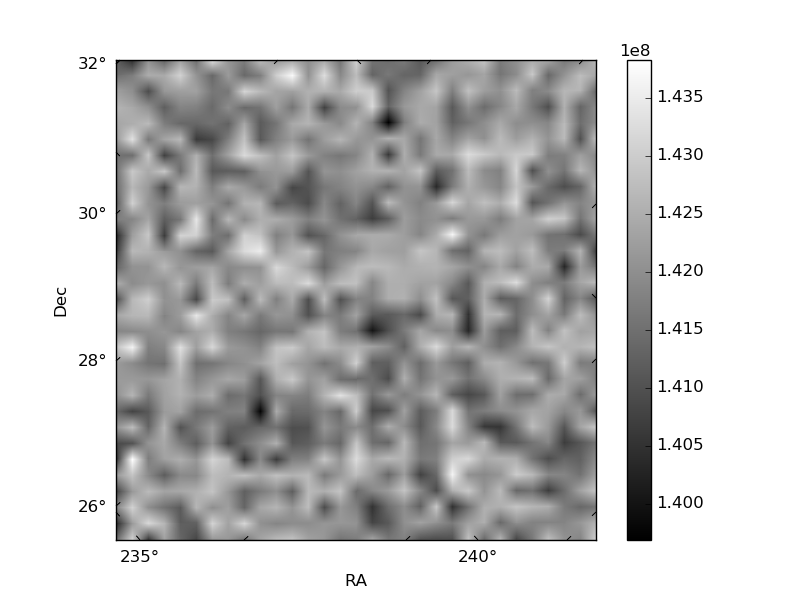
Histogram calculated using DETX and DETY for each event in the final _common_clean file
| Quadrant A | 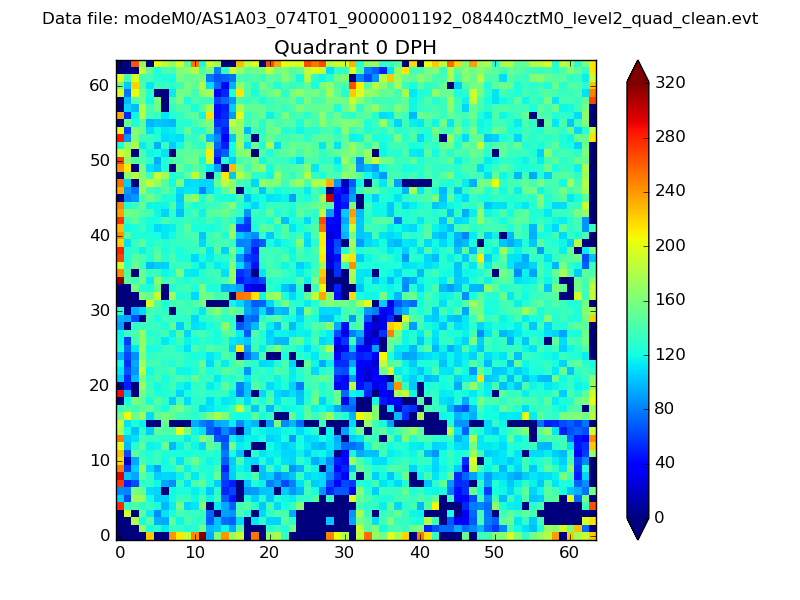 |
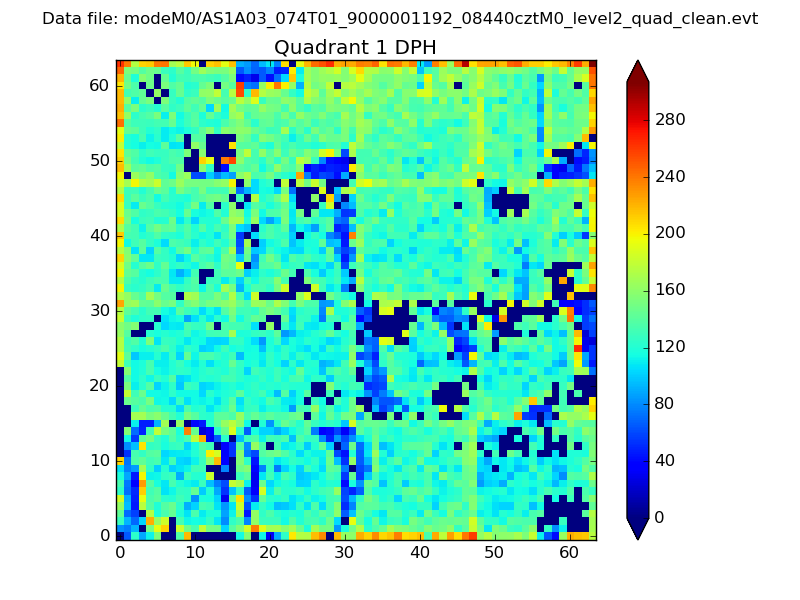 |
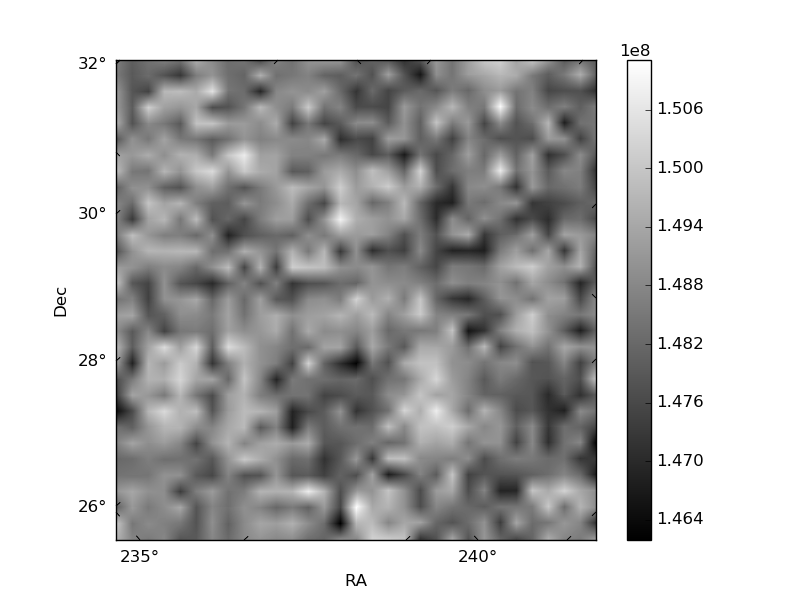
Quadrant B |
|---|---|---|---|
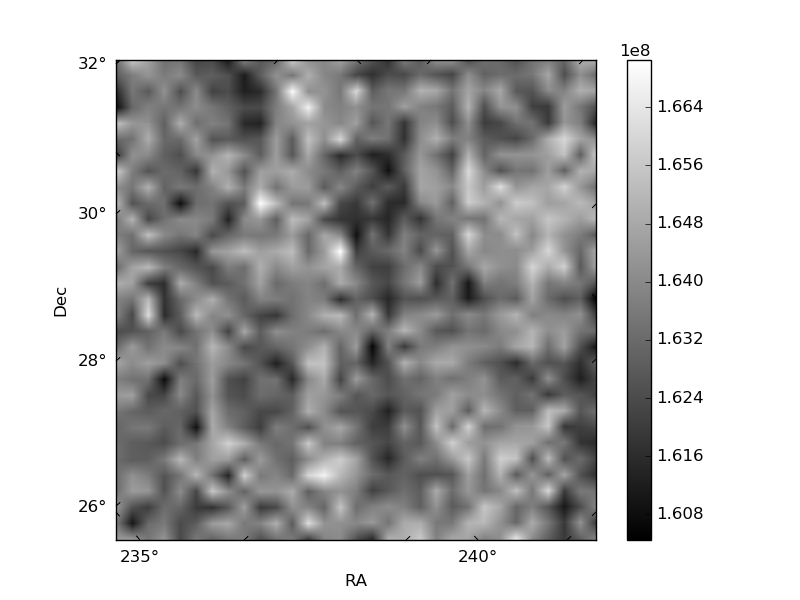
| Quadrant D | 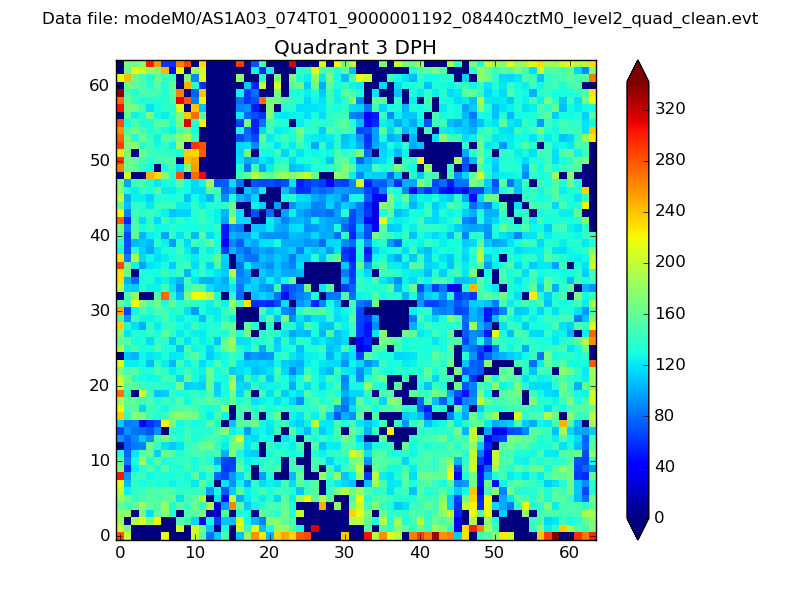 |
 |
Quadrant C |
| Plot type | Count rate plots | Images |
|---|---|---|
| Comparison with Poisson distribution Blue bars denote a histogram of data divided into 1 sec bins. Red curve is a Poisson curve with rate = median count rate of data. |
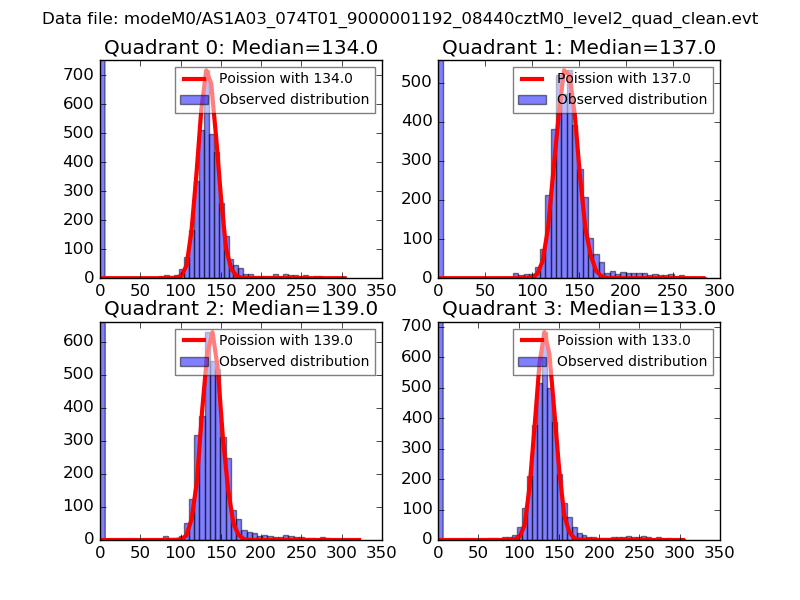 |
 |
| Quadrant-wise count rates Data is divided into 100 sec bins |
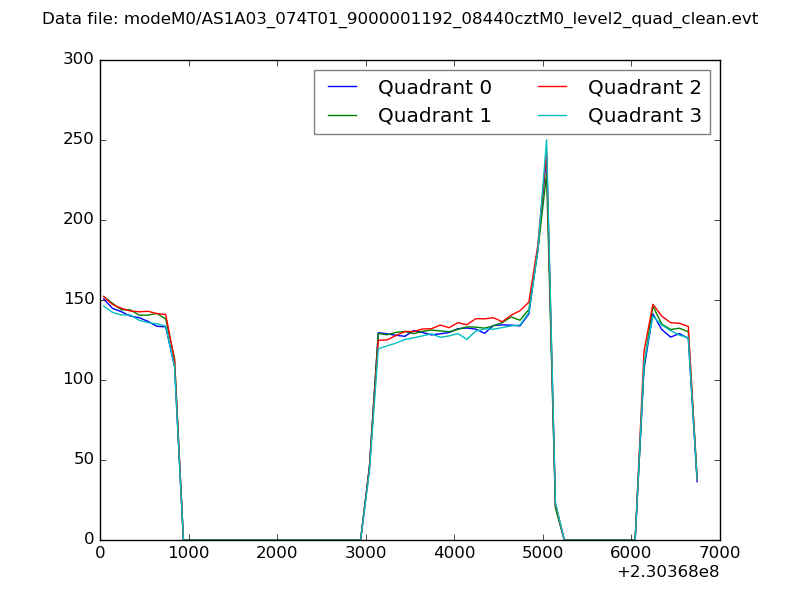 |
|
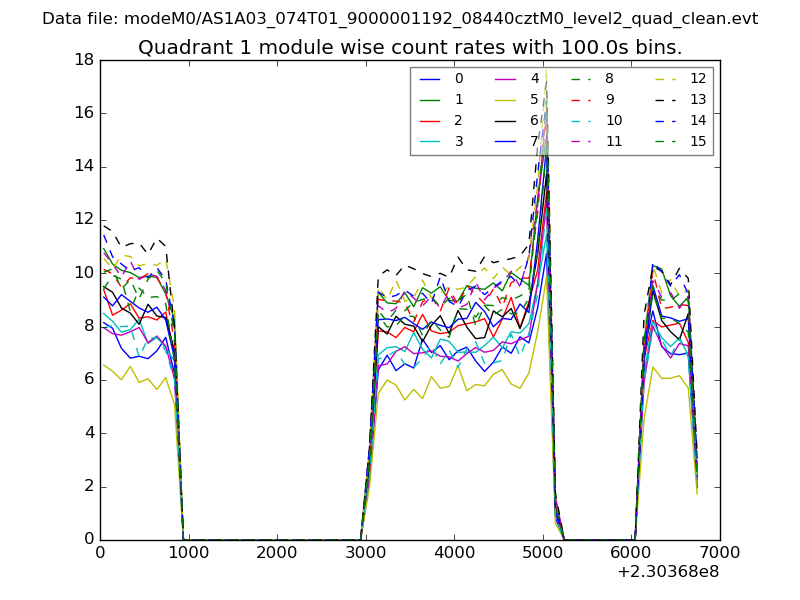
| Module-wise count rates for Quadrant A Data is divided into 100 sec bins |
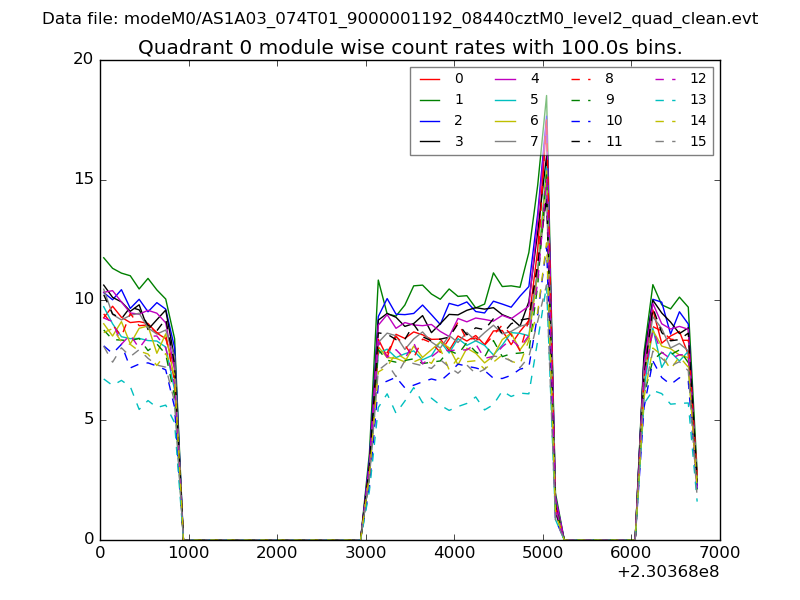 |
 |
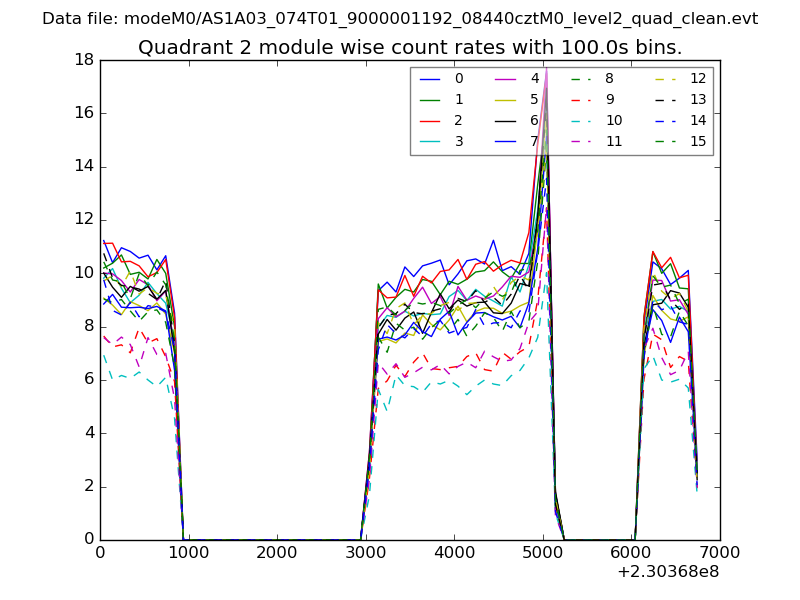
| Module-wise count rates for Quadrant B Data is divided into 100 sec bins |
 |
 |
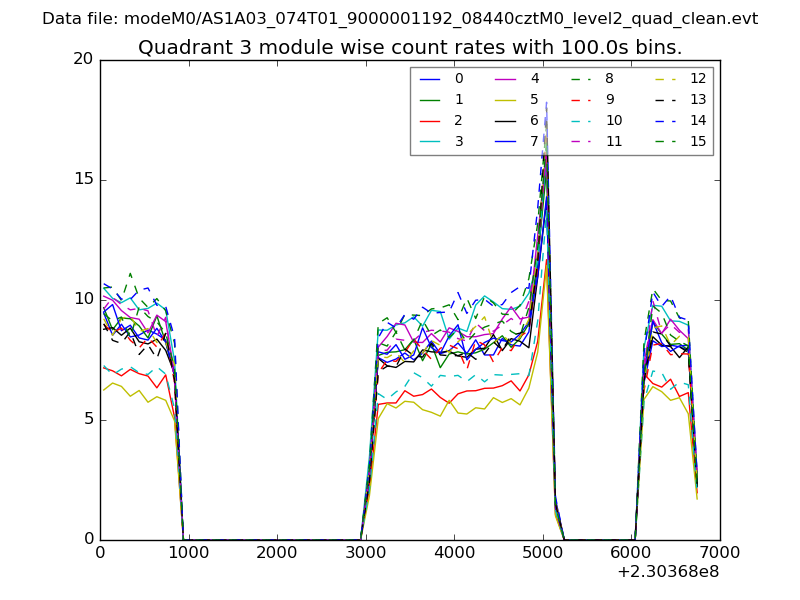
| Module-wise count rates for Quadrant C Data is divided into 100 sec bins |
 |
 |
| Module-wise count rates for Quadrant D Data is divided into 100 sec bins |
 |
 |
| Parameter | Plot |
|---|---|
| CZT HV Monitor | 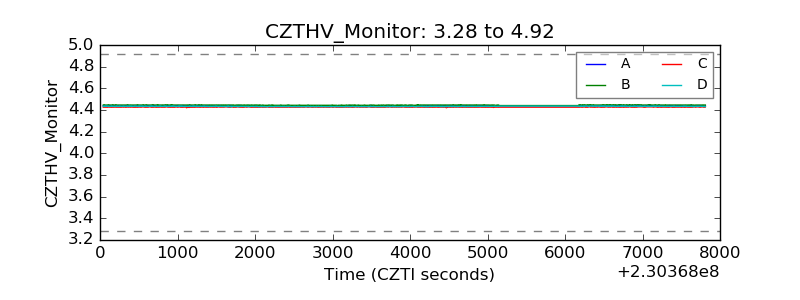 |
| D_VDD | 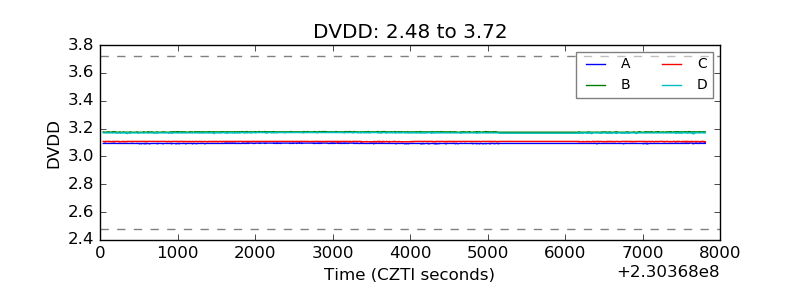 |
| Temperature 1 | 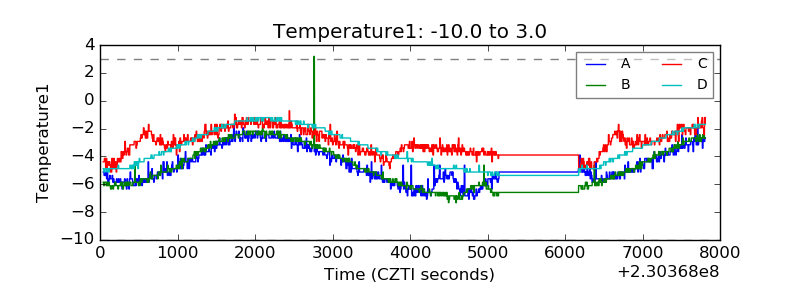 |
| Veto HV Monitor | 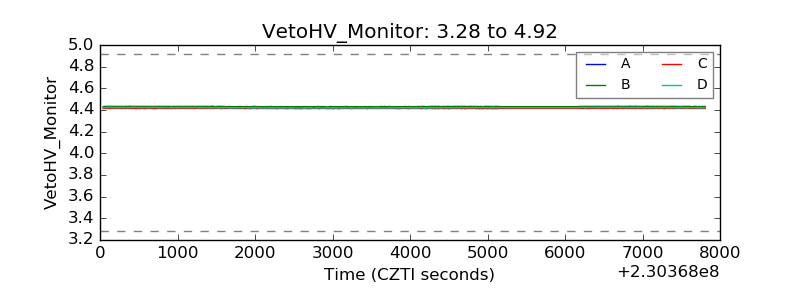 |
| Veto LLD | 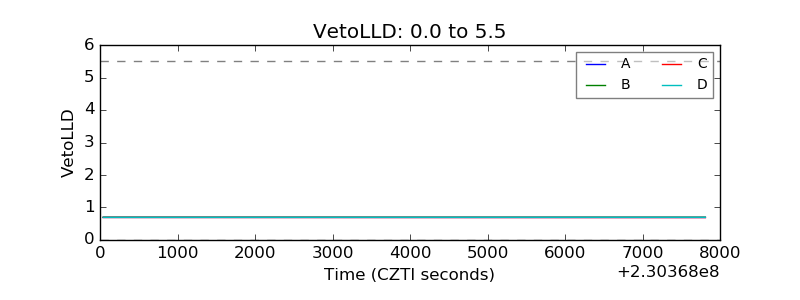 |
| Alpha Counter | 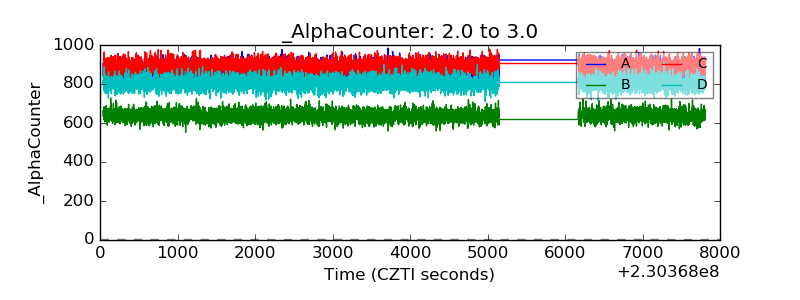 |
| _CPM_Rate | 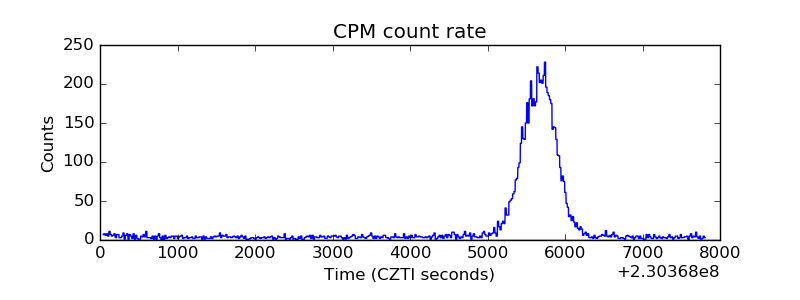 |
| CZT Counter | 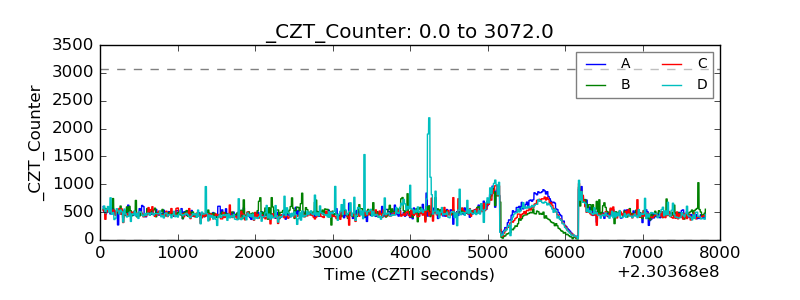 |
| +2.5 Volts monitor |  |
| +5 Volts monitor |  |
| _ROLL_ROT | 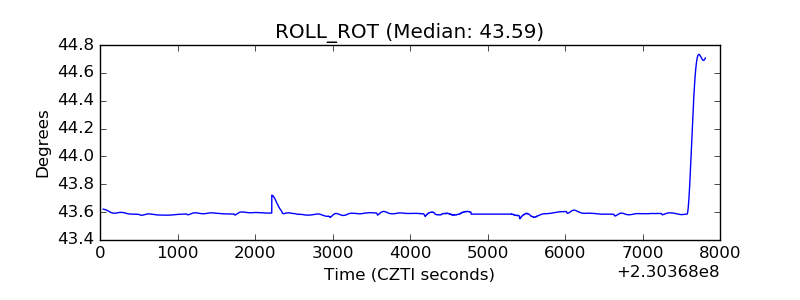 |
| _Roll_DEC | 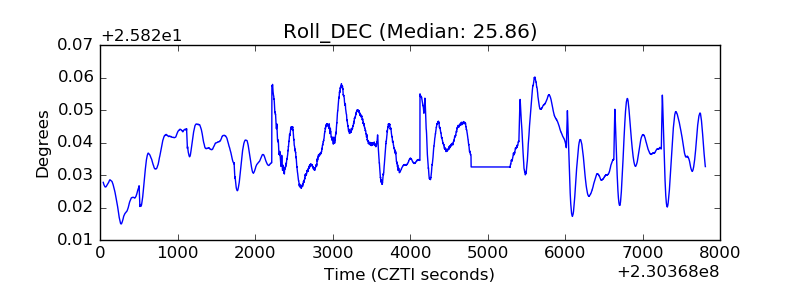 |
| _Roll_RA | 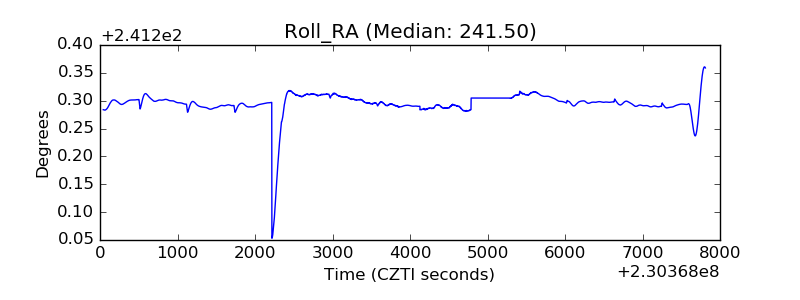 |
| Veto Counter | 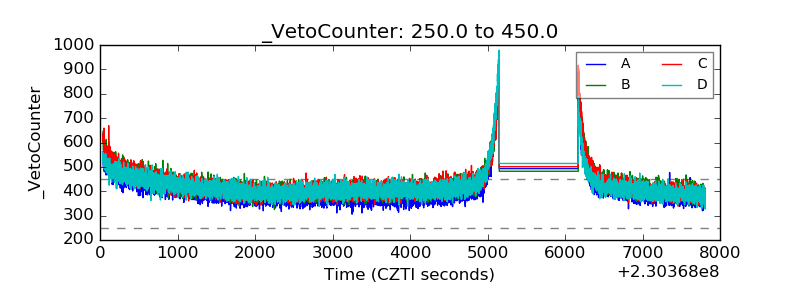 |