| Param | Original file | Final file |
|---|---|---|
| Filename | modeM0/AS1A03_074T01_9000001192_08441cztM0_level2.evt | modeM0/AS1A03_074T01_9000001192_08441cztM0_level2_quad_clean.evt |
| Size (bytes) | 572,696,640 | 82,028,160 |
| Size | 546.2 MB | 78.2 MB |
| Events in quadrant A | 3,519,026 | 498,771 |
| Events in quadrant B | 3,833,093 | 497,109 |
| Events in quadrant C | 3,511,198 | 503,685 |
| Events in quadrant D | 5,990,613 | 480,708 |
| Mode SS | |||
|---|---|---|---|
| Quadrant | BADHDUFLAG | Total packets | Discarded packets |
| A | 0 | 146 | 0 |
| B | 0 | 146 | 0 |
| C | 0 | 146 | 0 |
| D | 0 | 146 | 0 |
| Mode M9 | |||
|---|---|---|---|
| Quadrant | BADHDUFLAG | Total packets | Discarded packets |
| A | 0 | 15 | 0 |
| B | 0 | 15 | 0 |
| C | 0 | 15 | 0 |
| D | 0 | 16 | 0 |
| Mode M0 | |||
|---|---|---|---|
| Quadrant | BADHDUFLAG | Total packets | Discarded packets |
| A | 0 | 15222 | 3 |
| B | 0 | 15862 | 2 |
| C | 0 | 15340 | 2 |
| D | 0 | 22695 | 2 |
| Quadrant | Total seconds | Saturated seconds | Saturation percentage |
|---|---|---|---|
| A | 7226 | 170 | 2.352616% |
| B | 7226 | 220 | 3.044561% |
| C | 7226 | 163 | 2.255743% |
| D | 7226 | 799 | 11.057293% |
Noise dominated data is calculated using 1-second bins in cleaned event files. If a bin has >2000 counts, and if more than 50% of those come from <1% of pixels, then it is considered to be noise-dominated and hence unusable.
| Quadrant | # 1 sec bins | Bins with >0 counts | Bins with >2000 counts | High rate bins dominated by noise | Noise dominated (total time) | Noise dominated (detector-on time) | Marked lightcurve |
|---|---|---|---|---|---|---|---|
| A | 7851 | 7226 | 10 | 10 | 0.13% | 0.14% | 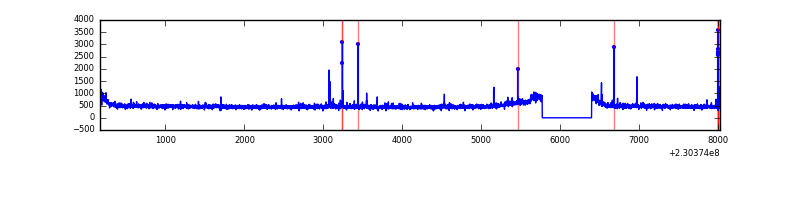 |
| B | 7851 | 7226 | 38 | 38 | 0.48% | 0.53% |  |
| C | 7851 | 7226 | 42 | 42 | 0.53% | 0.58% |  |
| D | 7851 | 7226 | 569 | 569 | 7.25% | 7.87% | 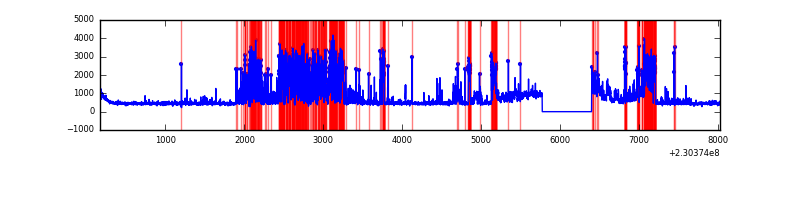 |
Top three noisy pixels from each quadrant. If the there are fewer than three noisy pixels in the level2.evt file, extra rows are filled as -1
| Pixel properties | Quadrant properties | ||||||
|---|---|---|---|---|---|---|---|
| Quadrant | DetID | PixID | Counts | Sigma | Mean | Median | Sigma |
| A | 13 | 251 | 37664 | 201.57 | 895 | 875 | 182.5 |
| A | 4 | 2 | 23255 | 122.62 | 895 | 875 | 182.5 |
| A | 13 | 248 | 11658 | 59.08 | 895 | 875 | 182.5 |
| B | 0 | 214 | 120074 | 695.72 | 888 | 866 | 171.3 |
| B | 5 | 255 | 97747 | 565.41 | 888 | 866 | 171.3 |
| B | 4 | 81 | 88133 | 509.3 | 888 | 866 | 171.3 |
| C | 13 | 255 | 107708 | 529.07 | 867 | 869 | 201.9 |
| C | 13 | 61 | 22060 | 104.94 | 867 | 869 | 201.9 |
| C | 12 | 4 | 4888 | 19.9 | 867 | 869 | 201.9 |
| D | 12 | 233 | 1483851 | 7121.01 | 851 | 826 | 208.3 |
| D | 12 | 227 | 814066 | 3904.92 | 851 | 826 | 208.3 |
| D | 1 | 52 | 175134 | 836.97 | 851 | 826 | 208.3 |
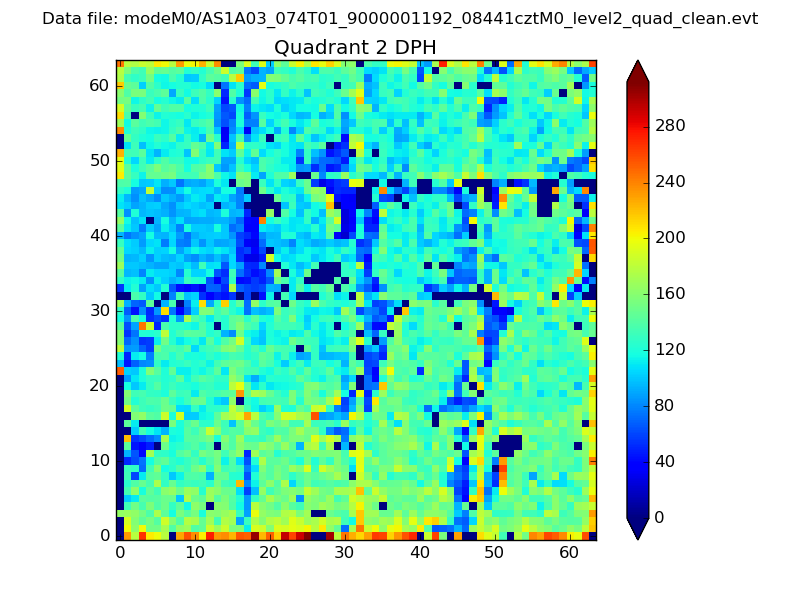
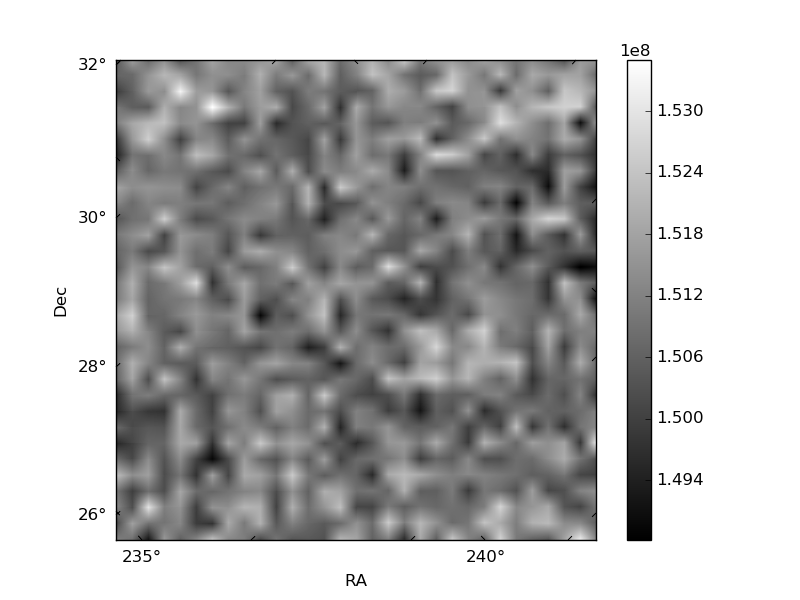
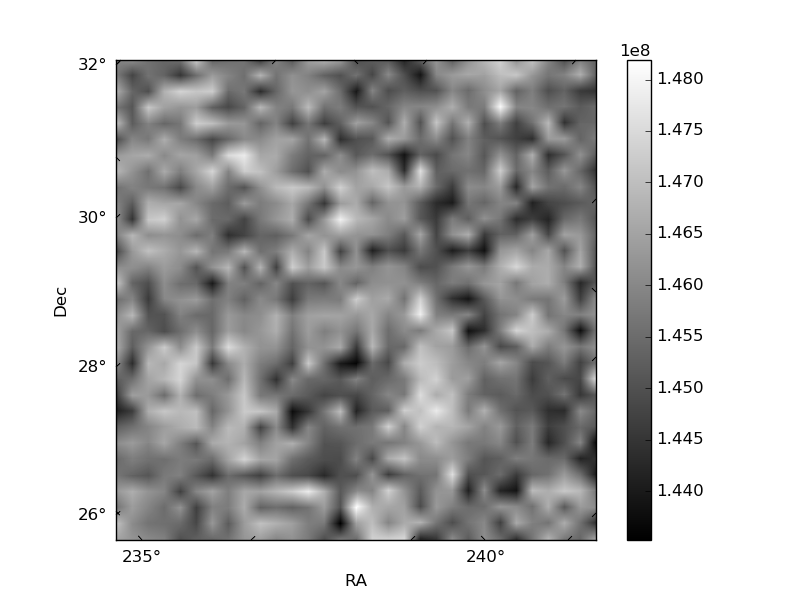
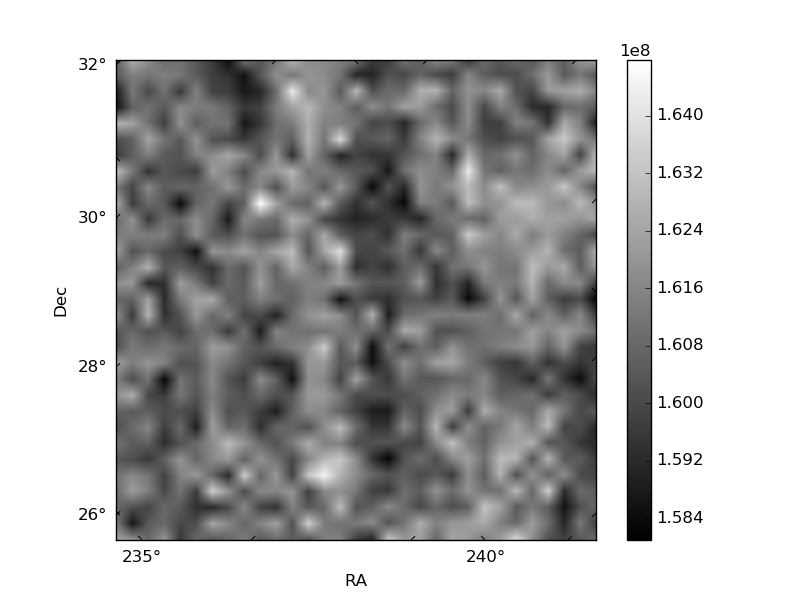
Histogram calculated using DETX and DETY for each event in the final _common_clean file
| Quadrant A | 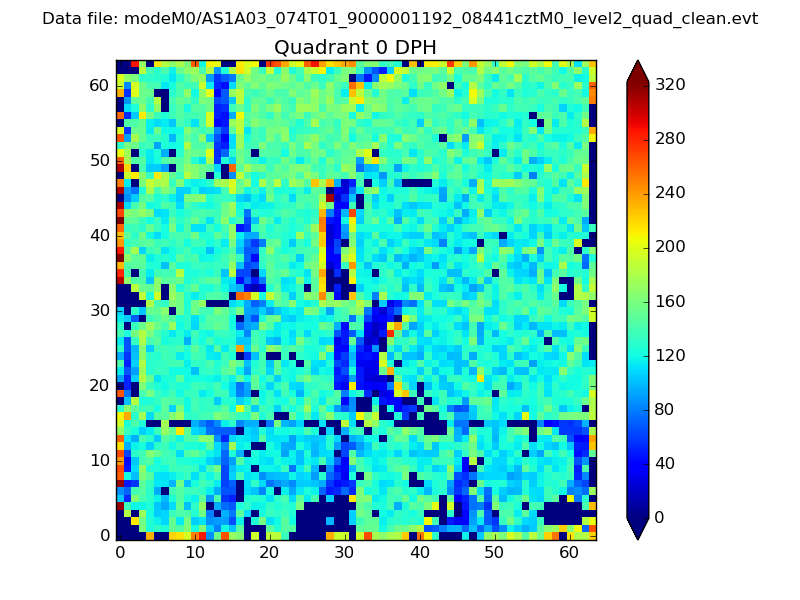 |
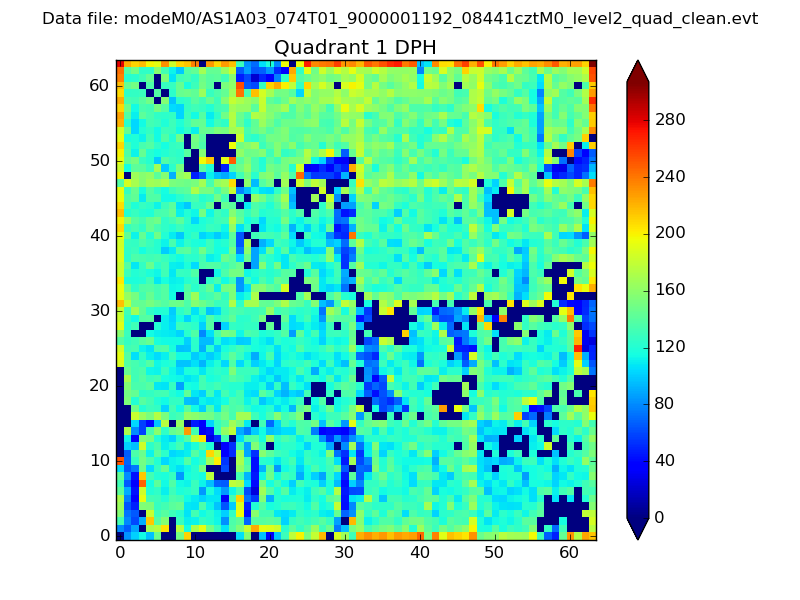 |
Quadrant B |
|---|---|---|---|
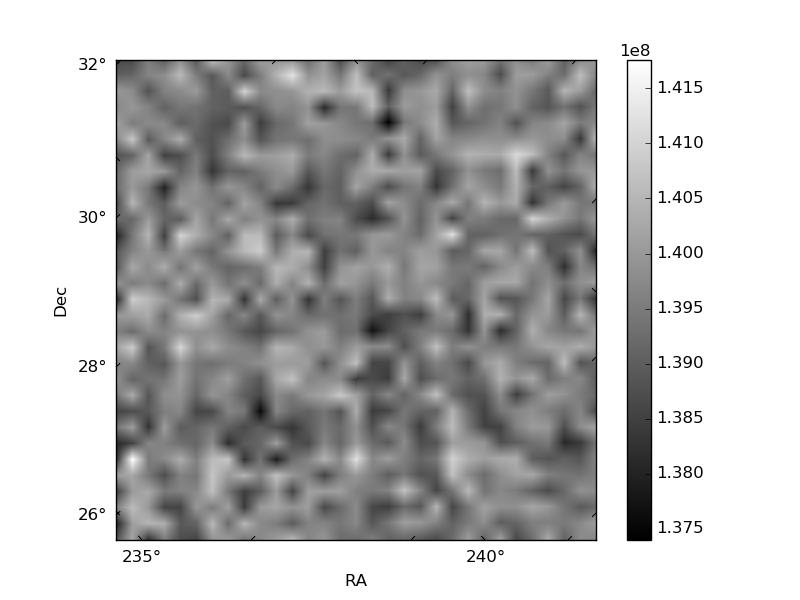
| Quadrant D | 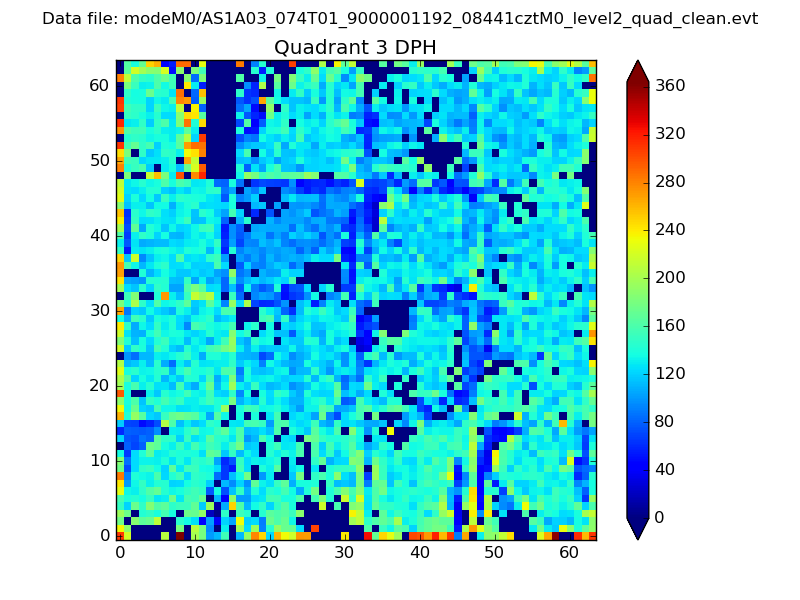 |
 |
Quadrant C |
| Plot type | Count rate plots | Images |
|---|---|---|
| Comparison with Poisson distribution Blue bars denote a histogram of data divided into 1 sec bins. Red curve is a Poisson curve with rate = median count rate of data. |
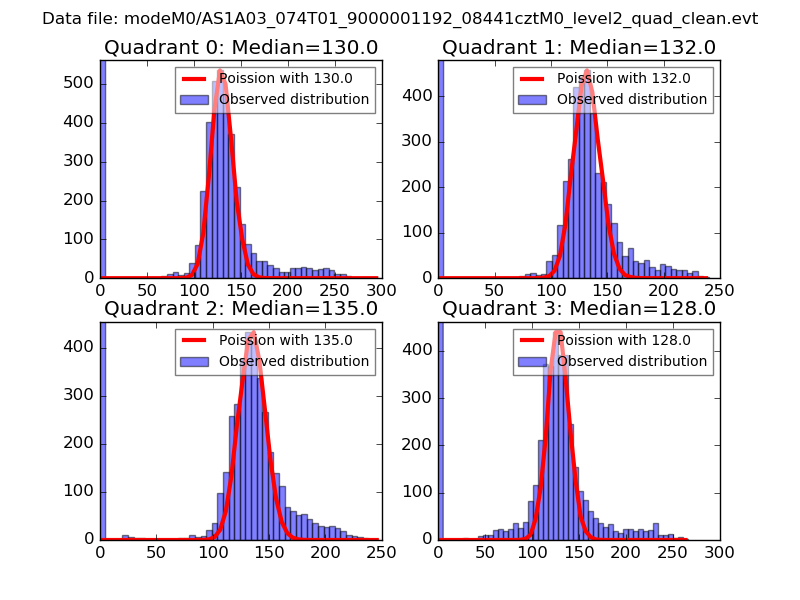 |
 |
| Quadrant-wise count rates Data is divided into 100 sec bins |
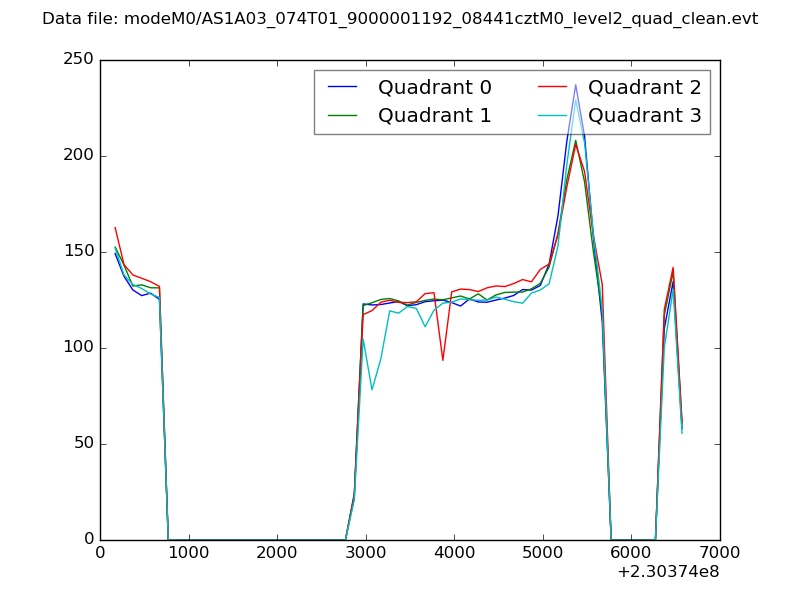 |
|
| Module-wise count rates for Quadrant A Data is divided into 100 sec bins |
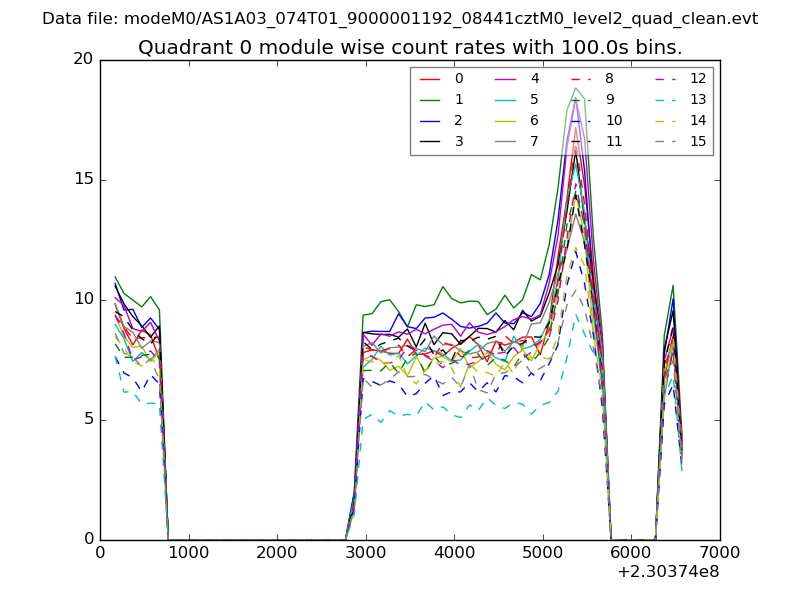 |
 |
| Module-wise count rates for Quadrant B Data is divided into 100 sec bins |
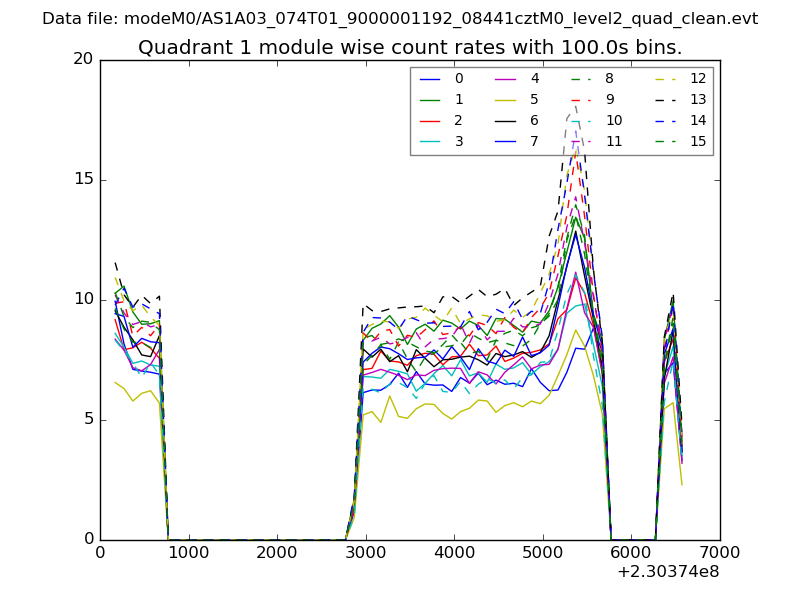 |
 |
| Module-wise count rates for Quadrant C Data is divided into 100 sec bins |
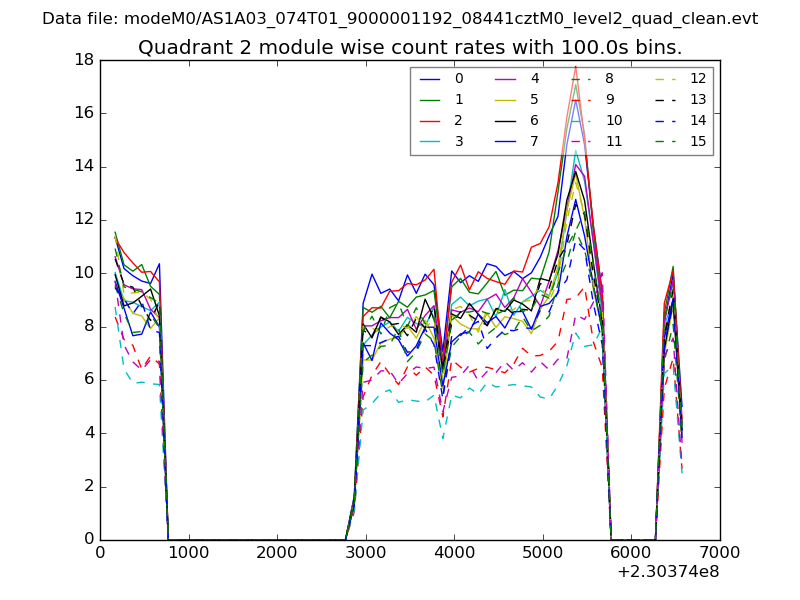 |
 |
| Module-wise count rates for Quadrant D Data is divided into 100 sec bins |
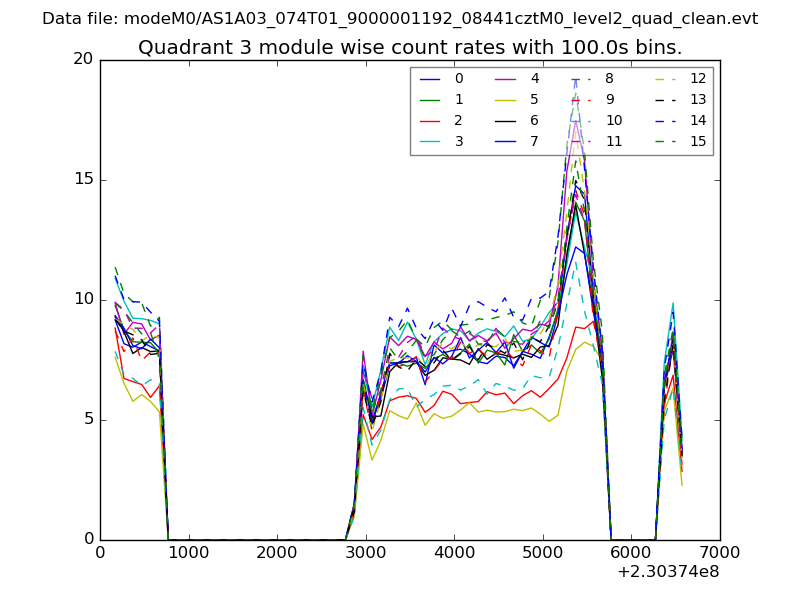 |
 |
| Parameter | Plot |
|---|---|
| CZT HV Monitor | 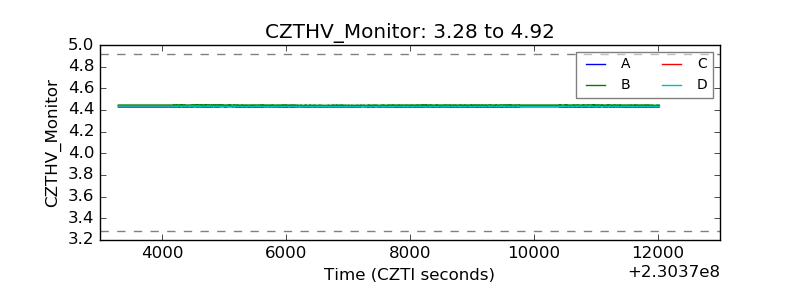 |
| D_VDD | 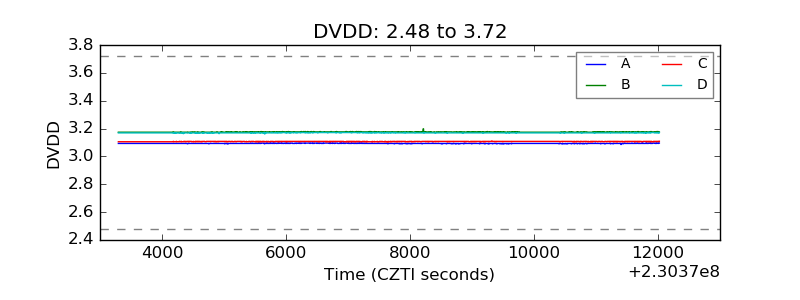 |
| Temperature 1 | 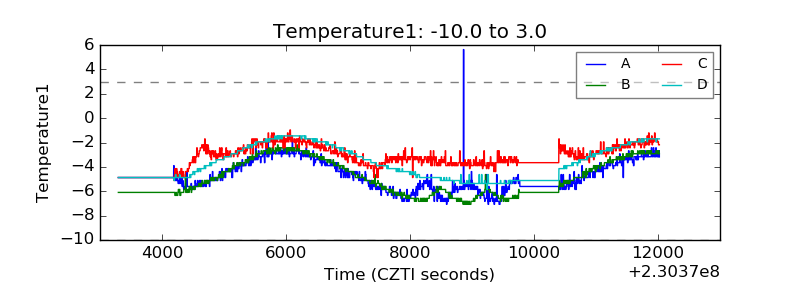 |
| Veto HV Monitor | 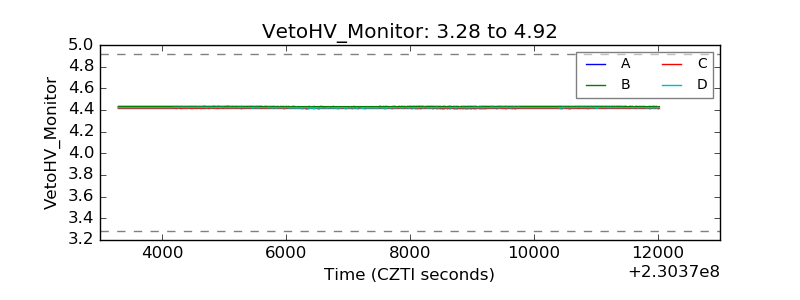 |
| Veto LLD | 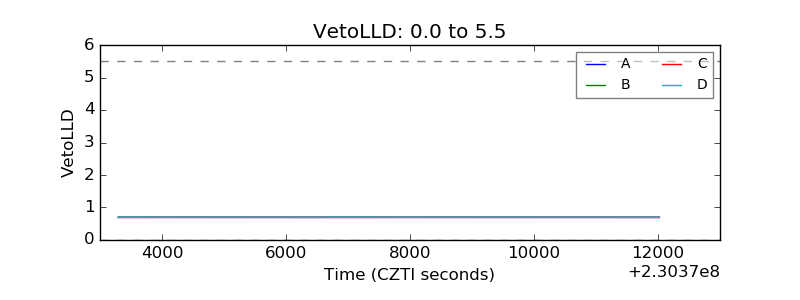 |
| Alpha Counter | 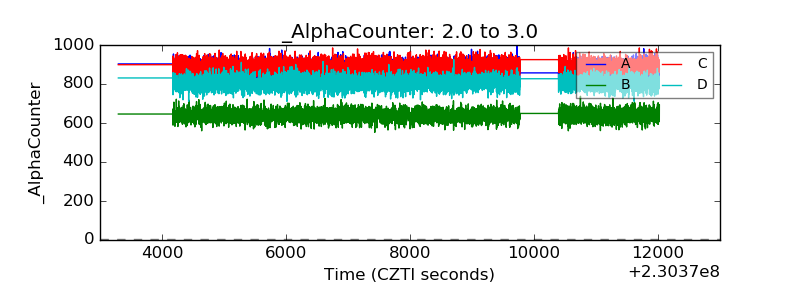 |
| _CPM_Rate | 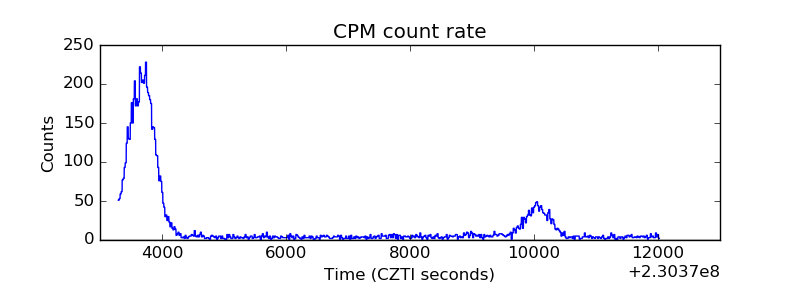 |
| CZT Counter | 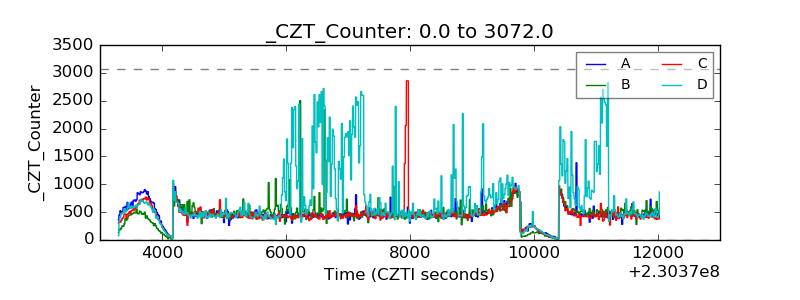 |
| +2.5 Volts monitor |  |
| +5 Volts monitor |  |
| _ROLL_ROT | 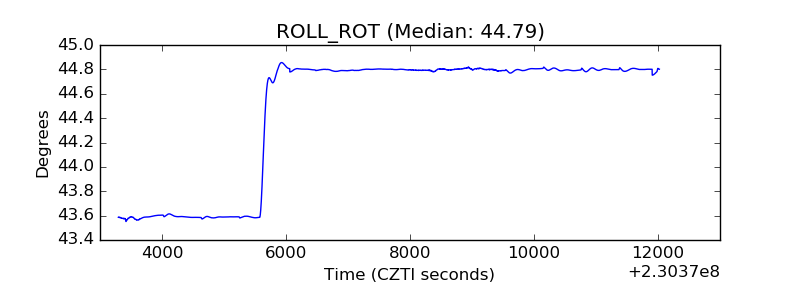 |
| _Roll_DEC | 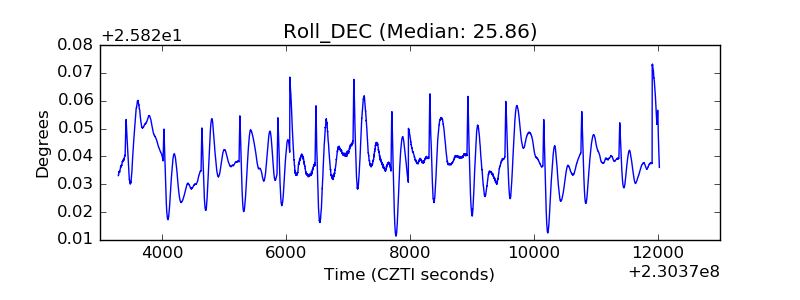 |
| _Roll_RA | 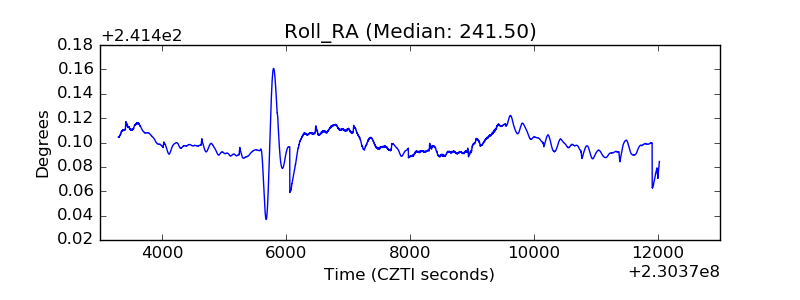 |
| Veto Counter | 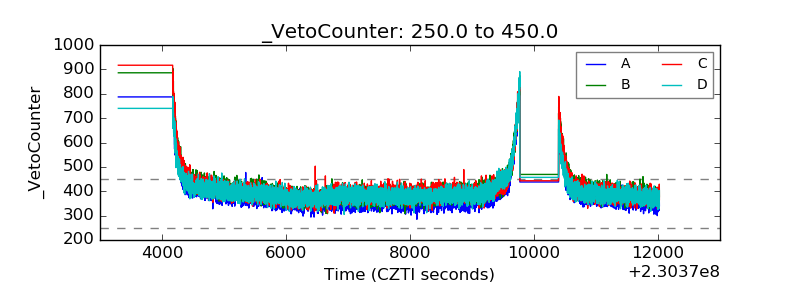 |