| Param | Original file | Final file |
|---|---|---|
| Filename | modeM0/AS1A03_074T01_9000001192_08444cztM0_level2.evt | modeM0/AS1A03_074T01_9000001192_08444cztM0_level2_quad_clean.evt |
| Size (bytes) | 574,894,080 | 93,340,800 |
| Size | 548.3 MB | 89.0 MB |
| Events in quadrant A | 4,097,982 | 553,069 |
| Events in quadrant B | 4,433,220 | 557,167 |
| Events in quadrant C | 4,106,749 | 569,447 |
| Events in quadrant D | 4,190,992 | 551,994 |
| Mode SS | |||
|---|---|---|---|
| Quadrant | BADHDUFLAG | Total packets | Discarded packets |
| A | 0 | 174 | 0 |
| B | 0 | 174 | 0 |
| C | 0 | 174 | 0 |
| D | 0 | 174 | 0 |
| Mode M9 | |||
|---|---|---|---|
| Quadrant | BADHDUFLAG | Total packets | Discarded packets |
| A | 0 | 5 | 0 |
| B | 0 | 5 | 0 |
| C | 0 | 5 | 0 |
| D | 0 | 5 | 0 |
| Mode M0 | |||
|---|---|---|---|
| Quadrant | BADHDUFLAG | Total packets | Discarded packets |
| A | 0 | 17851 | 34 |
| B | 0 | 18743 | 27 |
| C | 0 | 18027 | 23 |
| D | 0 | 18319 | 18 |
| Quadrant | Total seconds | Saturated seconds | Saturation percentage |
|---|---|---|---|
| A | 8568 | 203 | 2.369281% |
| B | 8571 | 296 | 3.453506% |
| C | 8572 | 179 | 2.088194% |
| D | 8574 | 178 | 2.076044% |
Noise dominated data is calculated using 1-second bins in cleaned event files. If a bin has >2000 counts, and if more than 50% of those come from <1% of pixels, then it is considered to be noise-dominated and hence unusable.
| Quadrant | # 1 sec bins | Bins with >0 counts | Bins with >2000 counts | High rate bins dominated by noise | Noise dominated (total time) | Noise dominated (detector-on time) | Marked lightcurve |
|---|---|---|---|---|---|---|---|
| A | 9005 | 8579 | 0 | 0 | 0.00% | 0.00% |  |
| B | 9005 | 8581 | 11 | 11 | 0.12% | 0.13% |  |
| C | 9005 | 8581 | 16 | 16 | 0.18% | 0.19% |  |
| D | 9005 | 8582 | 16 | 16 | 0.18% | 0.19% | 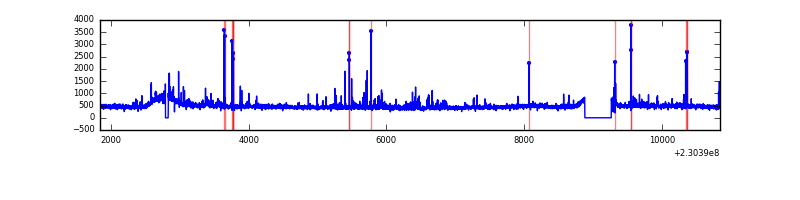 |
Top three noisy pixels from each quadrant. If the there are fewer than three noisy pixels in the level2.evt file, extra rows are filled as -1
| Pixel properties | Quadrant properties | ||||||
|---|---|---|---|---|---|---|---|
| Quadrant | DetID | PixID | Counts | Sigma | Mean | Median | Sigma |
| A | 1 | 162 | 24531 | 109.41 | 1048 | 1024 | 214.9 |
| A | 0 | 226 | 9736 | 40.55 | 1048 | 1024 | 214.9 |
| A | 12 | 194 | 9508 | 39.48 | 1048 | 1024 | 214.9 |
| B | 10 | 245 | 147045 | 717.77 | 1046 | 1019 | 203.4 |
| B | 0 | 214 | 100994 | 491.41 | 1046 | 1019 | 203.4 |
| B | 11 | 51 | 80004 | 388.24 | 1046 | 1019 | 203.4 |
| C | 12 | 4 | 111974 | 468.09 | 1020 | 1019 | 237.0 |
| C | 13 | 61 | 8238 | 30.46 | 1020 | 1019 | 237.0 |
| C | 14 | 67 | 6182 | 21.78 | 1020 | 1019 | 237.0 |
| D | 2 | 152 | 114339 | 413.72 | 1012 | 989 | 274.0 |
| D | 7 | 71 | 78370 | 282.44 | 1012 | 989 | 274.0 |
| D | 14 | 34 | 43672 | 155.79 | 1012 | 989 | 274.0 |
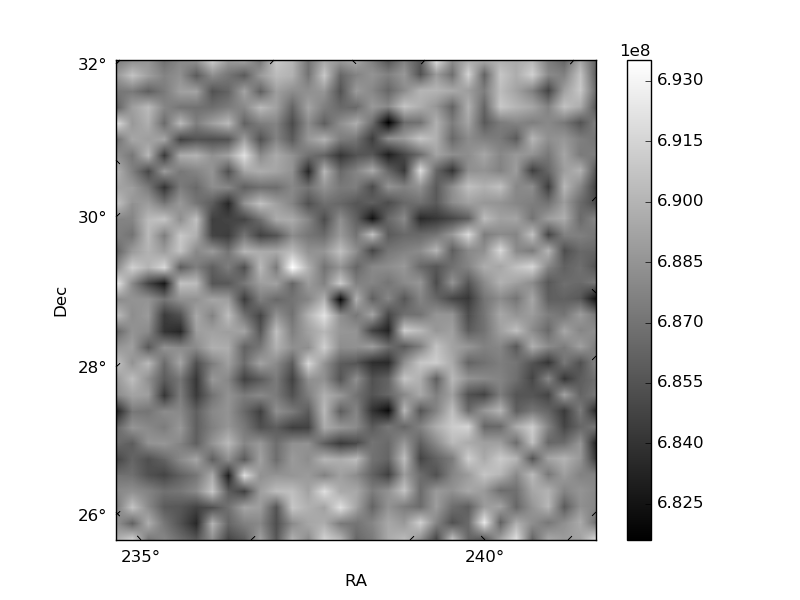
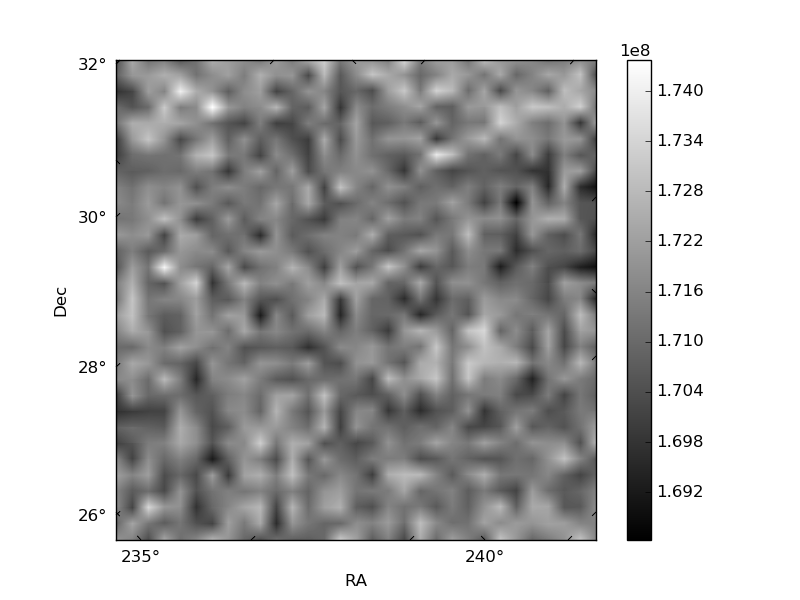
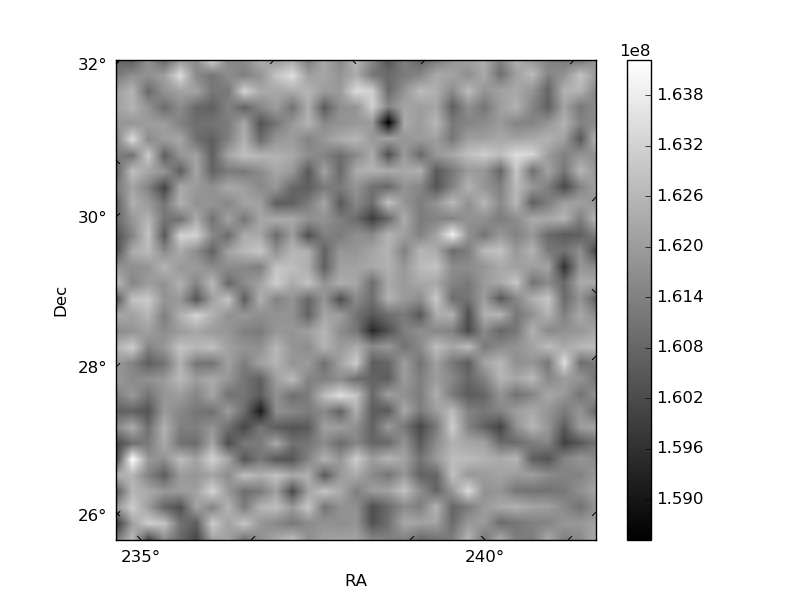
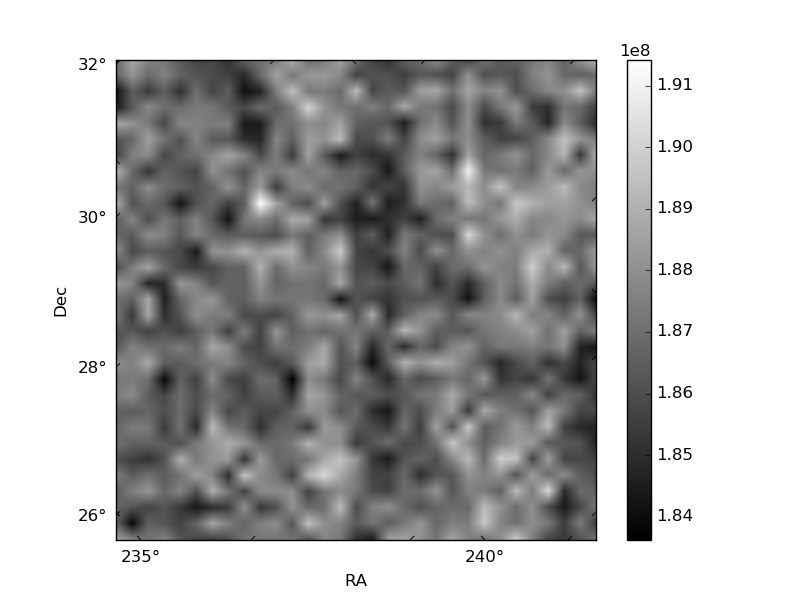
Histogram calculated using DETX and DETY for each event in the final _common_clean file
| Quadrant A | 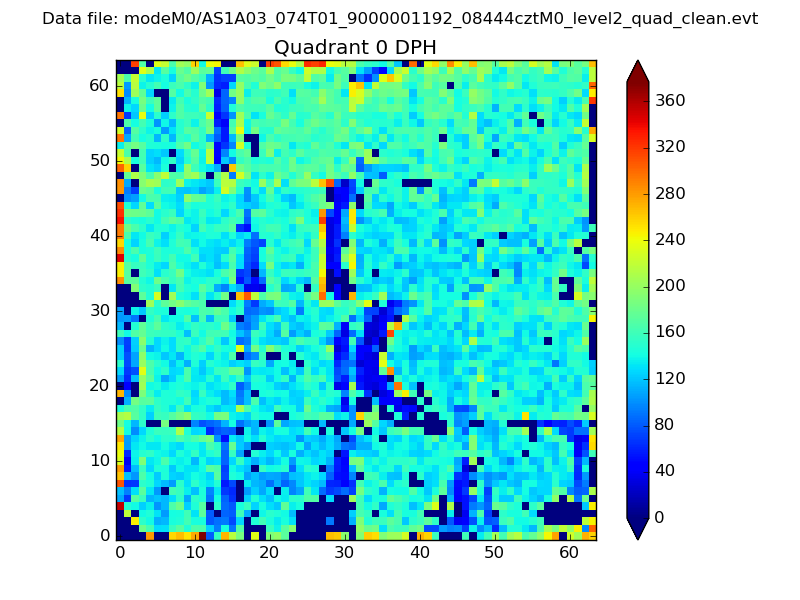 |
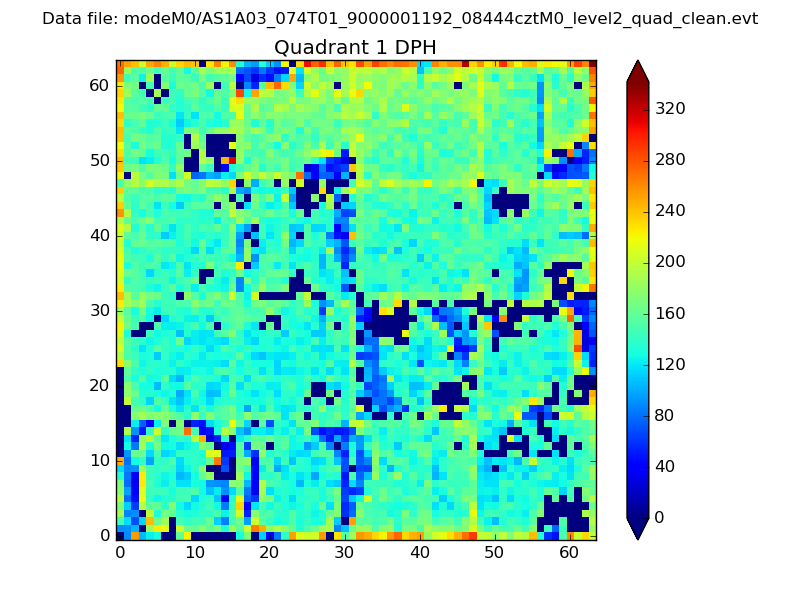 |
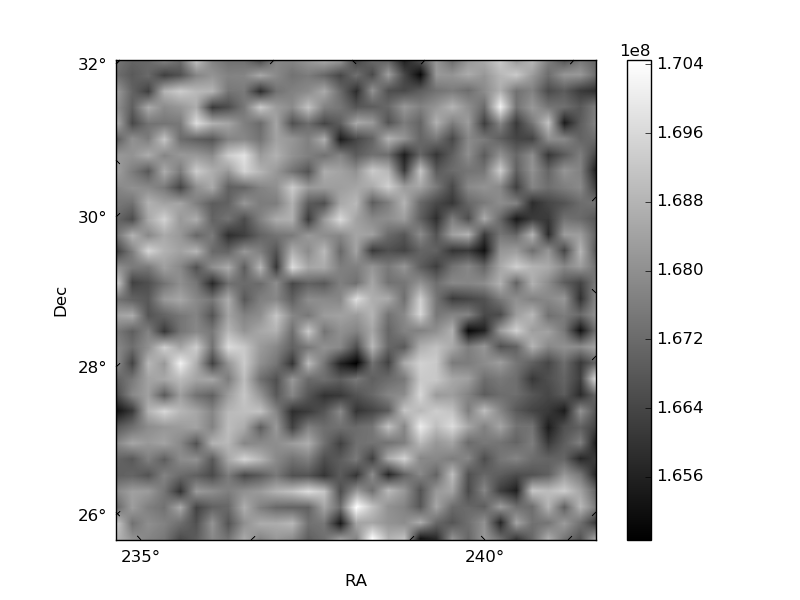
Quadrant B |
|---|---|---|---|
| Quadrant D |  |
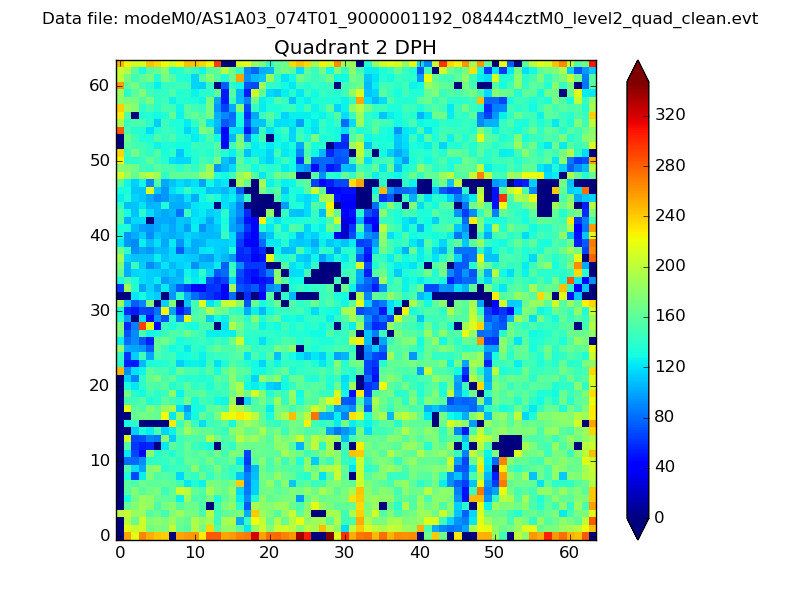 |
Quadrant C |
| Plot type | Count rate plots | Images |
|---|---|---|
| Comparison with Poisson distribution Blue bars denote a histogram of data divided into 1 sec bins. Red curve is a Poisson curve with rate = median count rate of data. |
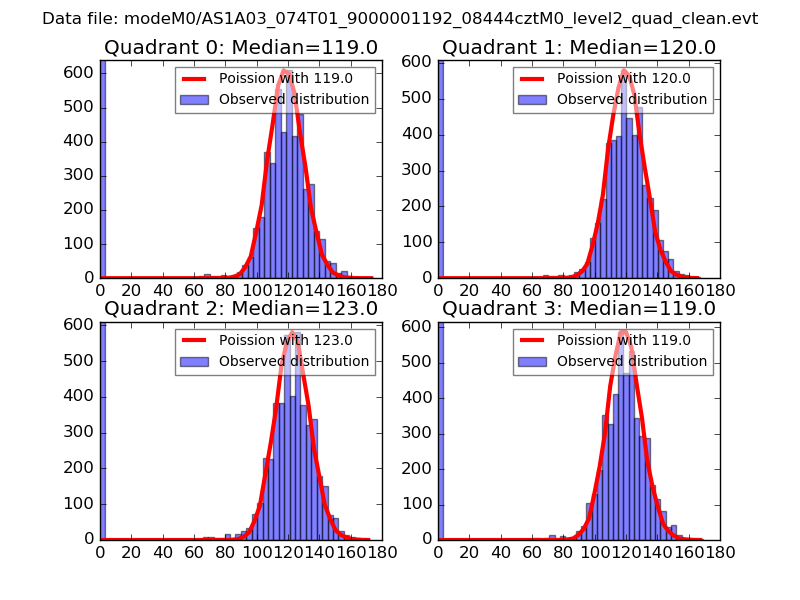 |
 |
| Quadrant-wise count rates Data is divided into 100 sec bins |
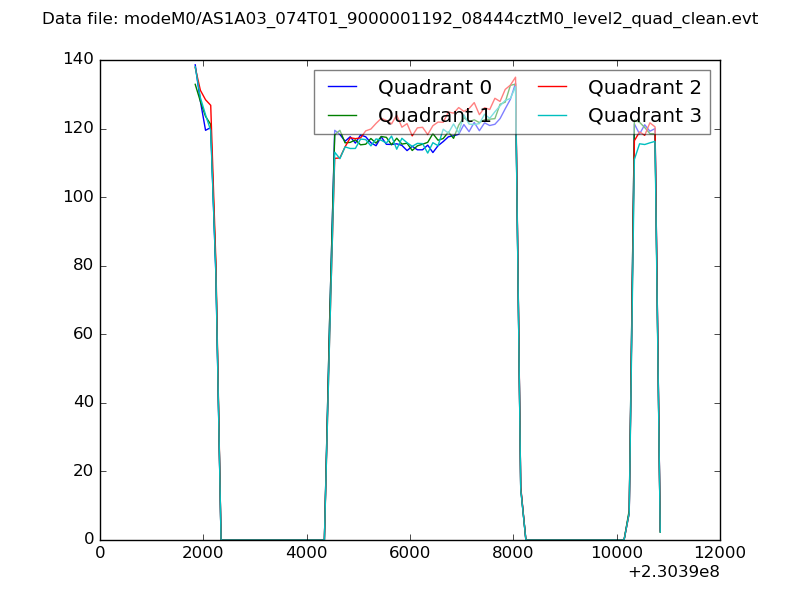 |
|
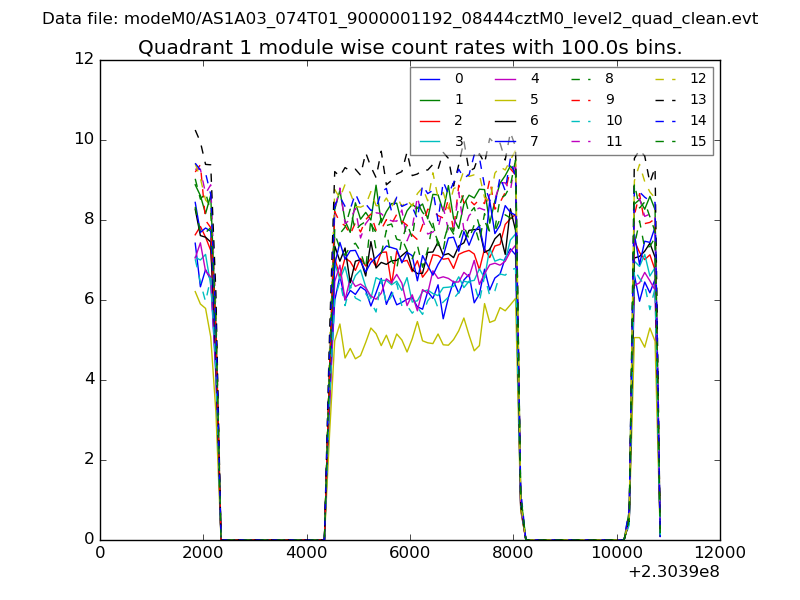
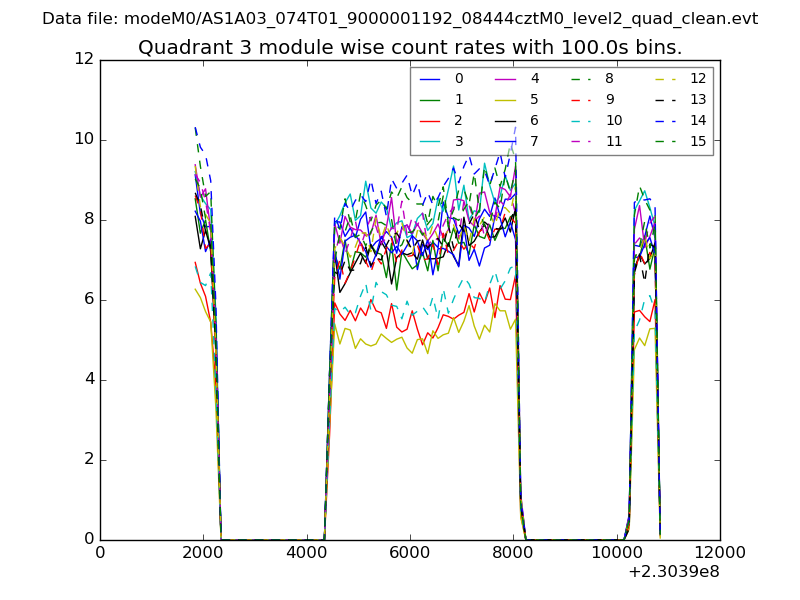
| Module-wise count rates for Quadrant A Data is divided into 100 sec bins |
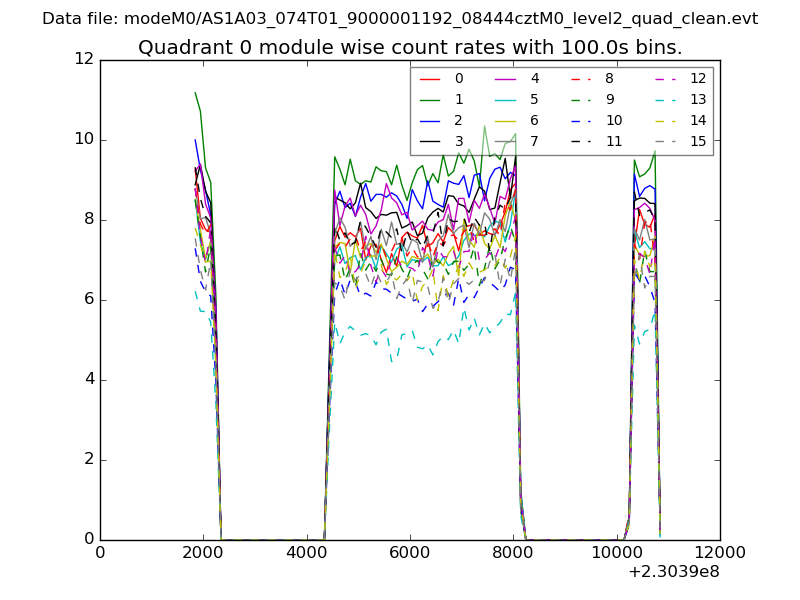 |
 |
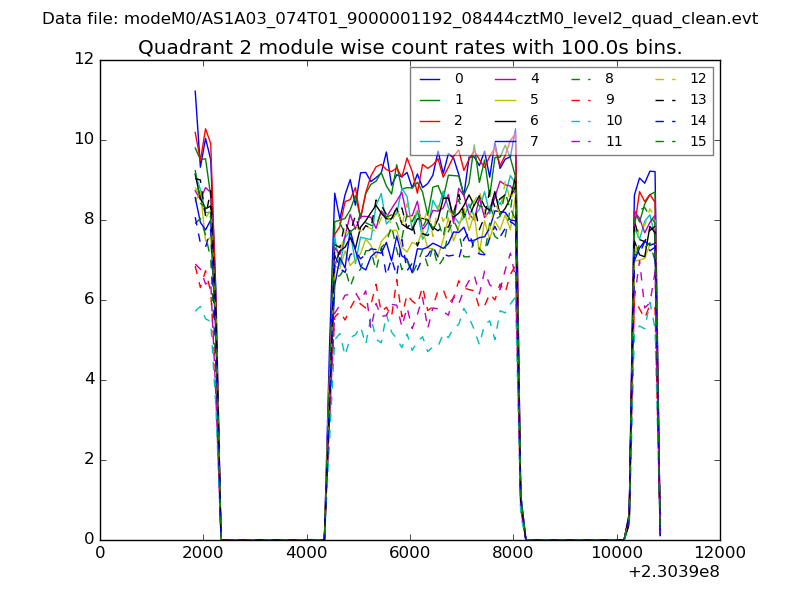
| Module-wise count rates for Quadrant B Data is divided into 100 sec bins |
 |
 |
| Module-wise count rates for Quadrant C Data is divided into 100 sec bins |
 |
 |
| Module-wise count rates for Quadrant D Data is divided into 100 sec bins |
 |
 |
| Parameter | Plot |
|---|---|
| CZT HV Monitor | 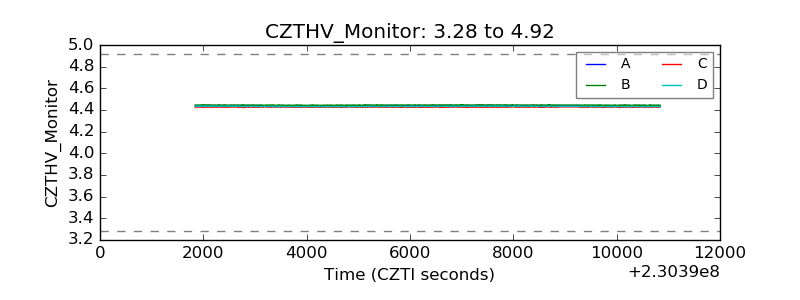 |
| D_VDD | 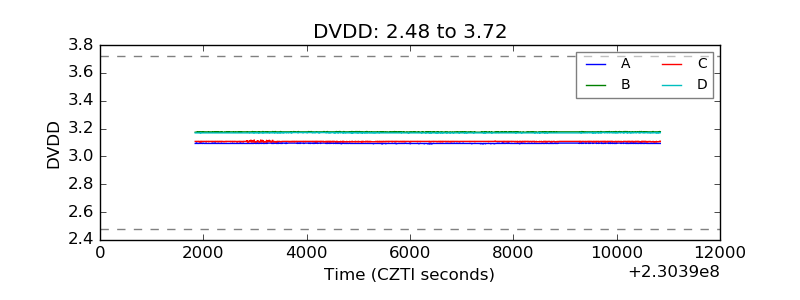 |
| Temperature 1 | 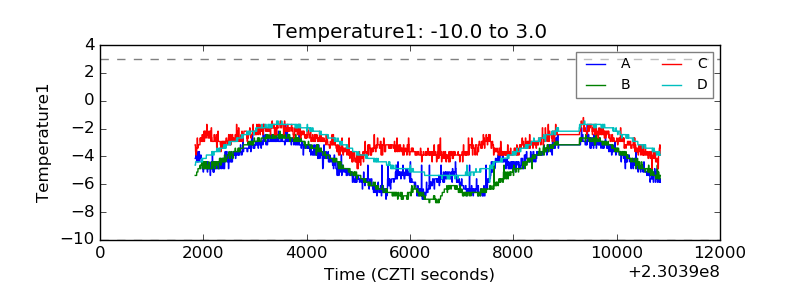 |
| Veto HV Monitor | 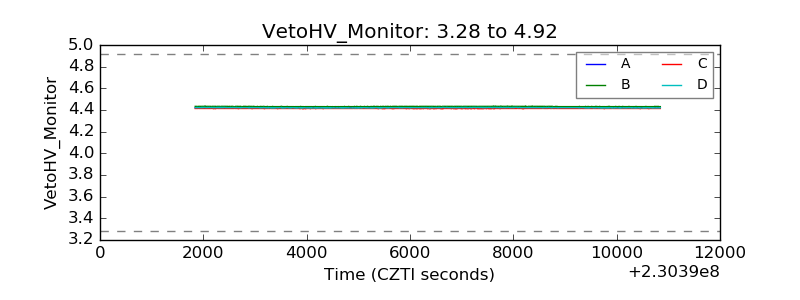 |
| Veto LLD | 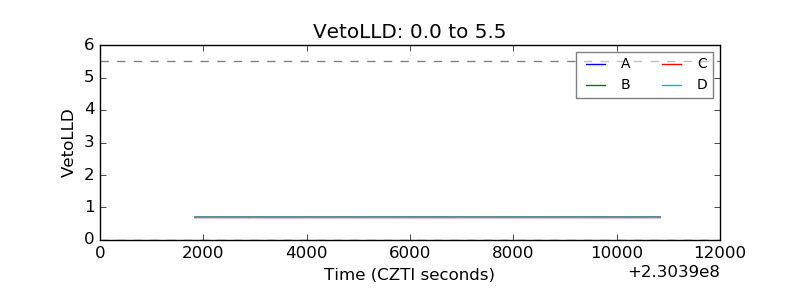 |
| Alpha Counter | 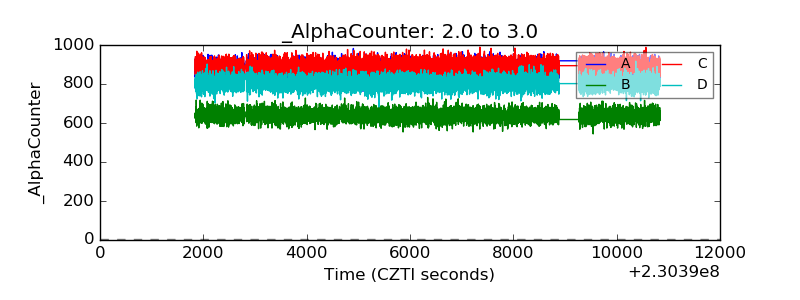 |
| _CPM_Rate | 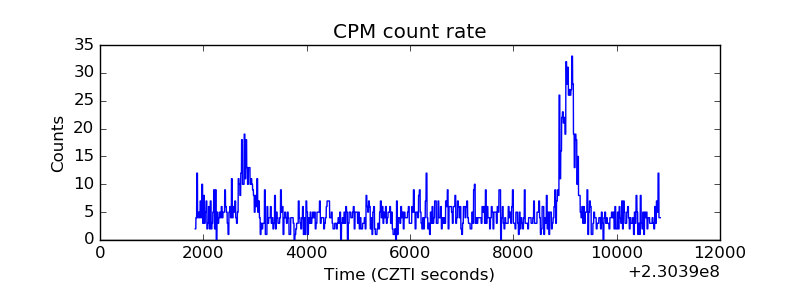 |
| CZT Counter | 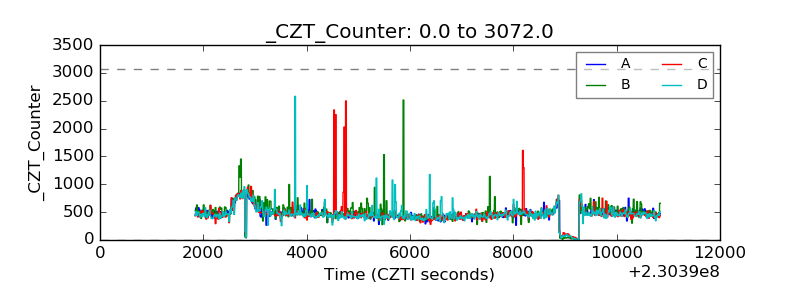 |
| +2.5 Volts monitor |  |
| +5 Volts monitor |  |
| _ROLL_ROT | 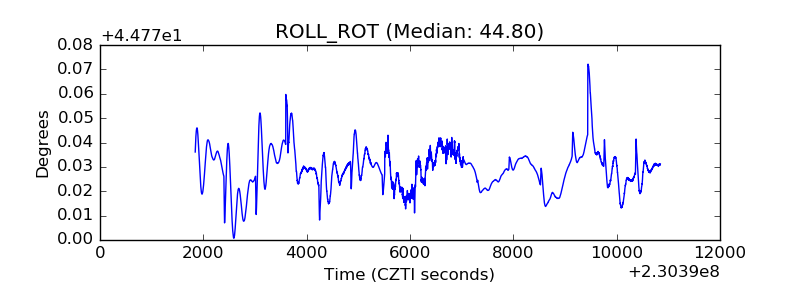 |
| _Roll_DEC | 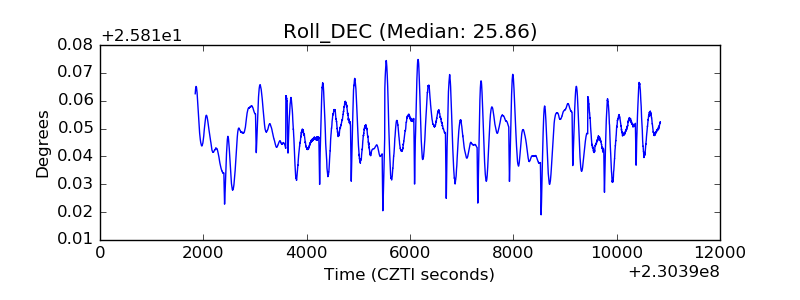 |
| _Roll_RA | 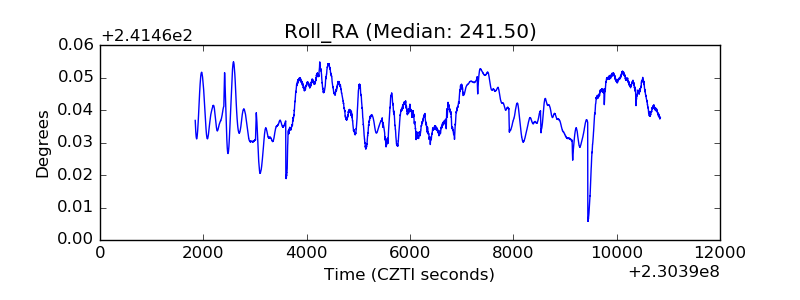 |
| Veto Counter | 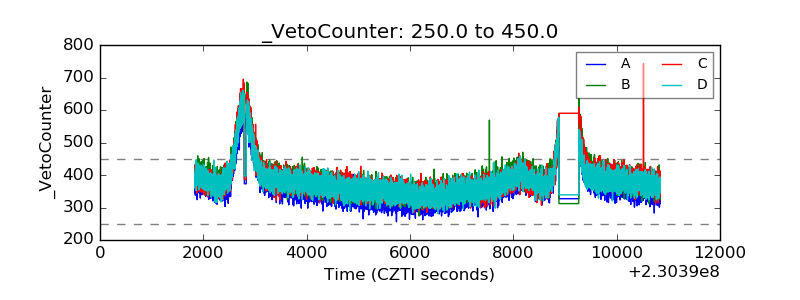 |