| Param | Original file | Final file |
|---|---|---|
| Filename | modeM0/AS1A03_074T01_9000001192_08446cztM0_level2.evt | modeM0/AS1A03_074T01_9000001192_08446cztM0_level2_quad_clean.evt |
| Size (bytes) | 826,113,600 | 159,857,280 |
| Size | 787.8 MB | 152.5 MB |
| Events in quadrant A | 5,830,912 | 976,246 |
| Events in quadrant B | 6,331,796 | 985,667 |
| Events in quadrant C | 5,807,440 | 1,020,502 |
| Events in quadrant D | 6,184,510 | 978,596 |
| Mode SS | |||
|---|---|---|---|
| Quadrant | BADHDUFLAG | Total packets | Discarded packets |
| A | 0 | 284 | 30 |
| B | 0 | 284 | 22 |
| C | 0 | 284 | 32 |
| D | 0 | 284 | 26 |
| Mode M9 | |||
|---|---|---|---|
| Quadrant | BADHDUFLAG | Total packets | Discarded packets |
| A | 0 | 16 | 0 |
| B | 0 | 16 | 0 |
| C | 0 | 16 | 1 |
| D | 0 | 16 | 2 |
| Mode M0 | |||
|---|---|---|---|
| Quadrant | BADHDUFLAG | Total packets | Discarded packets |
| A | 0 | 28576 | 2575 |
| B | 0 | 30101 | 2799 |
| C | 0 | 28459 | 2513 |
| D | 0 | 29874 | 2787 |
| Quadrant | Total seconds | Saturated seconds | Saturation percentage |
|---|---|---|---|
| A | 12743 | 72 | 0.565016% |
| B | 12719 | 131 | 1.029955% |
| C | 12779 | 50 | 0.391267% |
| D | 12698 | 68 | 0.535517% |
Noise dominated data is calculated using 1-second bins in cleaned event files. If a bin has >2000 counts, and if more than 50% of those come from <1% of pixels, then it is considered to be noise-dominated and hence unusable.
| Quadrant | # 1 sec bins | Bins with >0 counts | Bins with >2000 counts | High rate bins dominated by noise | Noise dominated (total time) | Noise dominated (detector-on time) | Marked lightcurve |
|---|---|---|---|---|---|---|---|
| A | 15597 | 13484 | 0 | 0 | 0.00% | 0.00% | 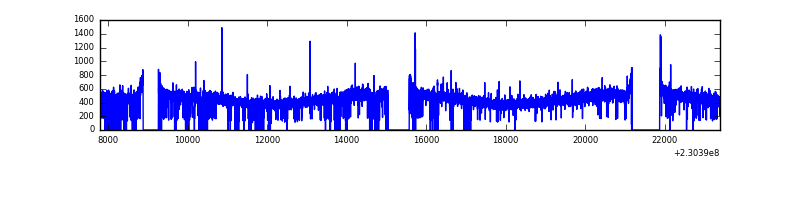 |
| B | 15596 | 13490 | 14 | 14 | 0.09% | 0.10% | 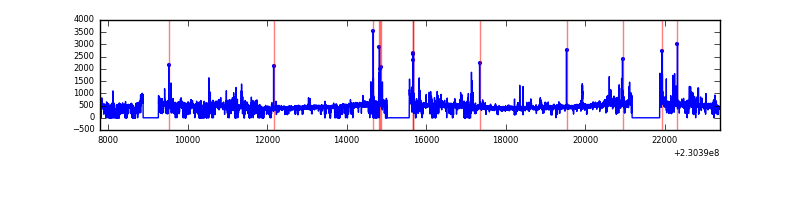 |
| C | 15596 | 13510 | 0 | 0 | 0.00% | 0.00% | 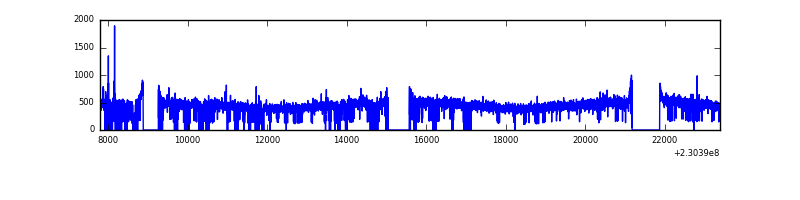 |
| D | 15596 | 13478 | 21 | 21 | 0.13% | 0.16% | 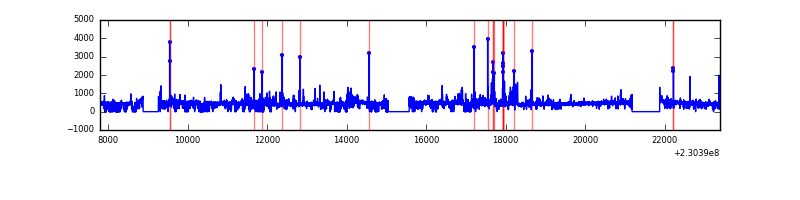 |
Top three noisy pixels from each quadrant. If the there are fewer than three noisy pixels in the level2.evt file, extra rows are filled as -1
| Pixel properties | Quadrant properties | ||||||
|---|---|---|---|---|---|---|---|
| Quadrant | DetID | PixID | Counts | Sigma | Mean | Median | Sigma |
| A | 0 | 128 | 14845 | 43.67 | 1503 | 1468 | 306.3 |
| A | 0 | 226 | 13871 | 40.49 | 1503 | 1468 | 306.3 |
| A | 12 | 194 | 13649 | 39.76 | 1503 | 1468 | 306.3 |
| B | 10 | 245 | 195872 | 671.36 | 1507 | 1466 | 289.6 |
| B | 0 | 214 | 137050 | 468.22 | 1507 | 1466 | 289.6 |
| B | 4 | 81 | 70360 | 237.92 | 1507 | 1466 | 289.6 |
| C | 8 | 128 | 15223 | 40.23 | 1478 | 1485 | 341.5 |
| C | 12 | 4 | 13087 | 33.97 | 1478 | 1485 | 341.5 |
| C | 13 | 61 | 11215 | 28.49 | 1478 | 1485 | 341.5 |
| D | 2 | 152 | 253011 | 642.86 | 1457 | 1419 | 391.4 |
| D | 12 | 227 | 169544 | 429.59 | 1457 | 1419 | 391.4 |
| D | 2 | 14 | 137638 | 348.06 | 1457 | 1419 | 391.4 |
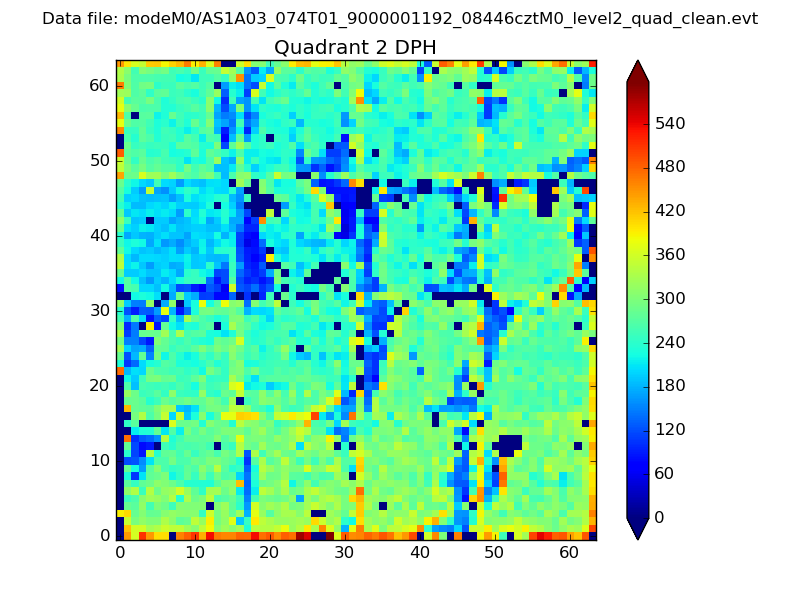
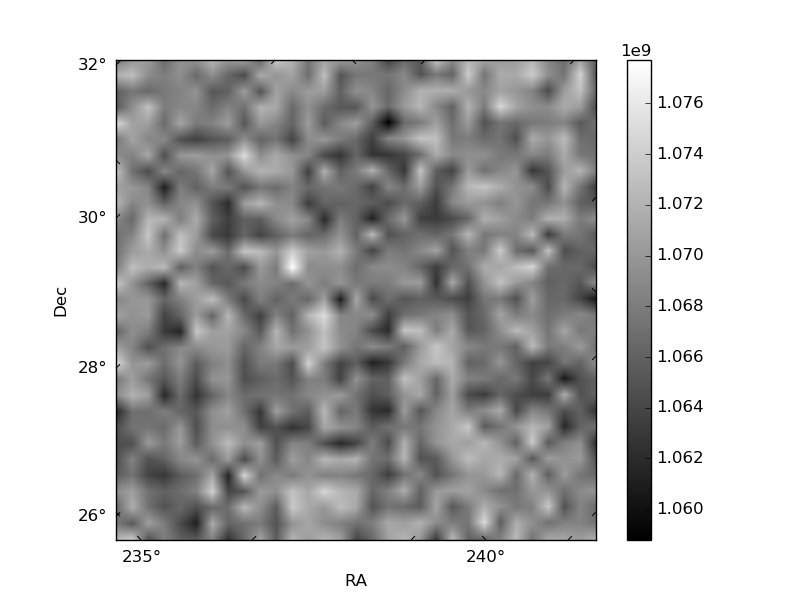
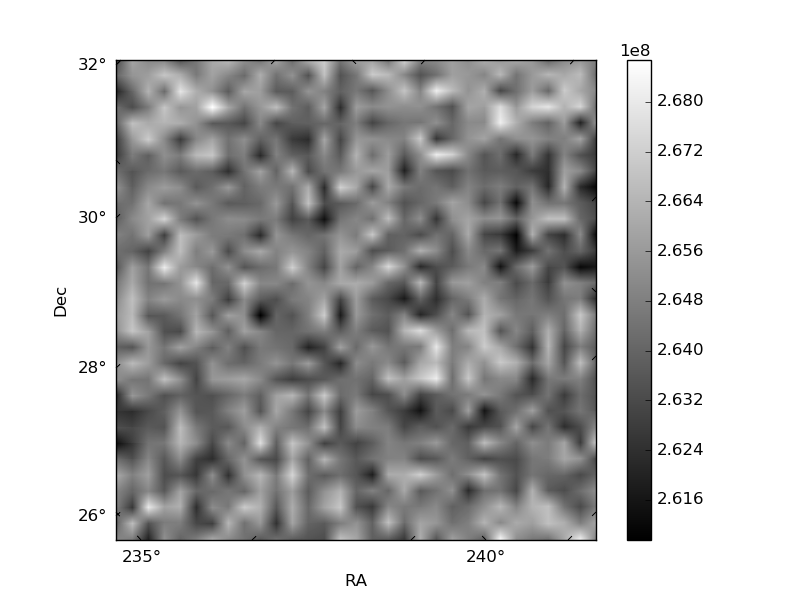
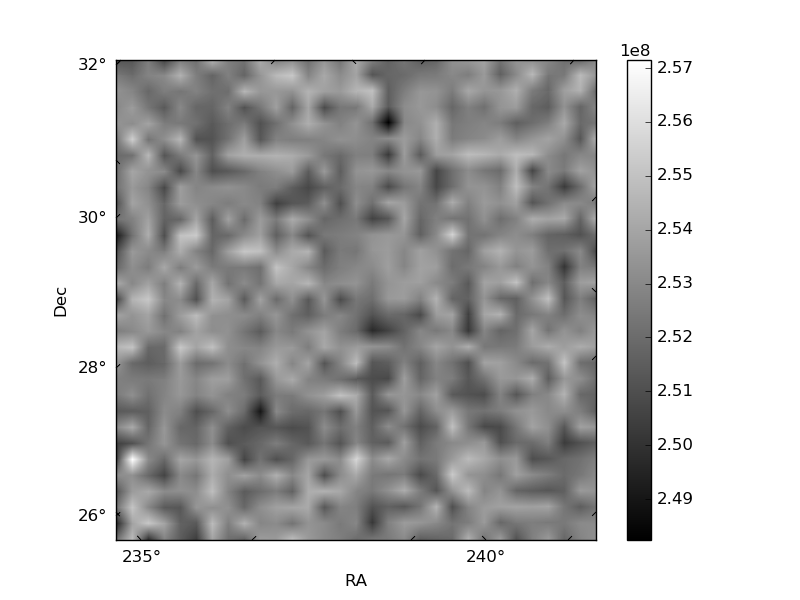
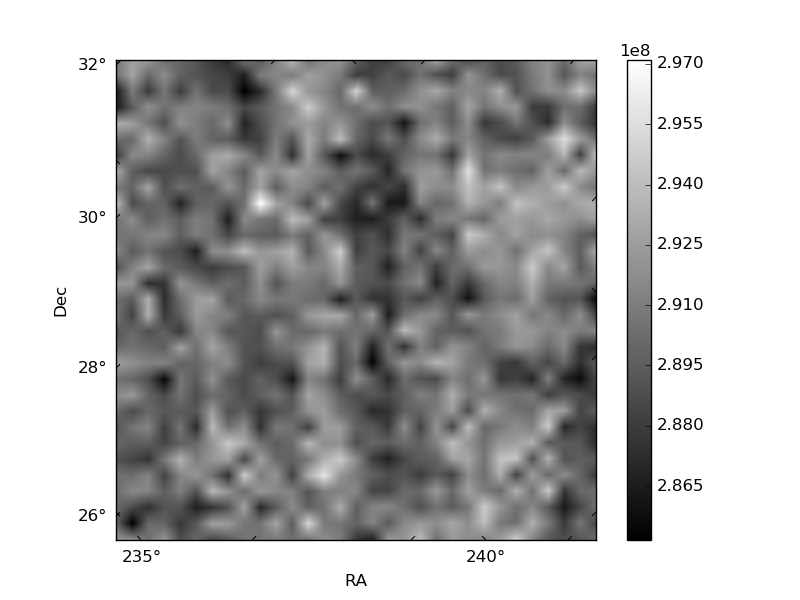
Histogram calculated using DETX and DETY for each event in the final _common_clean file
| Quadrant A | 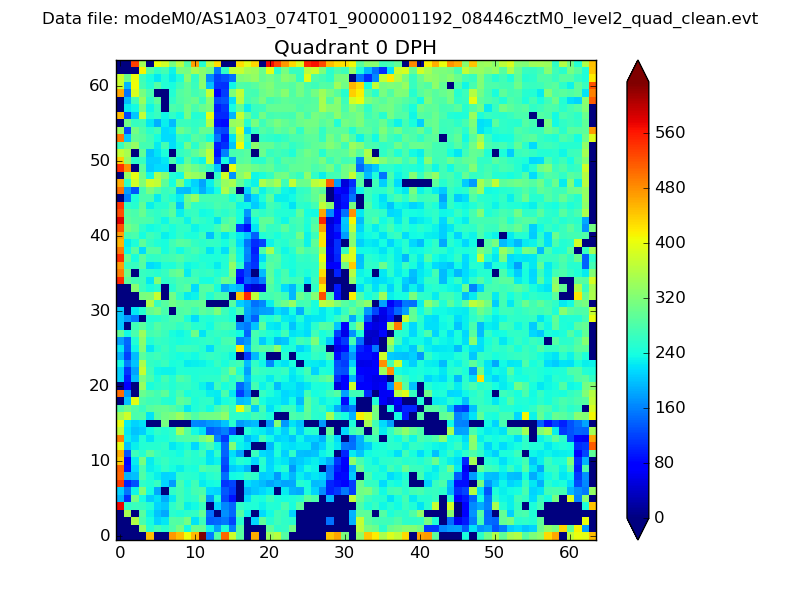 |
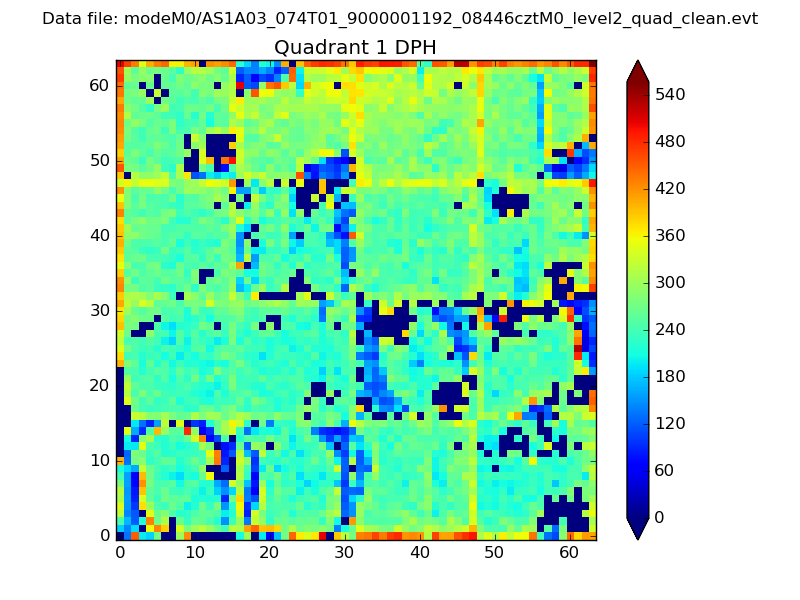 |
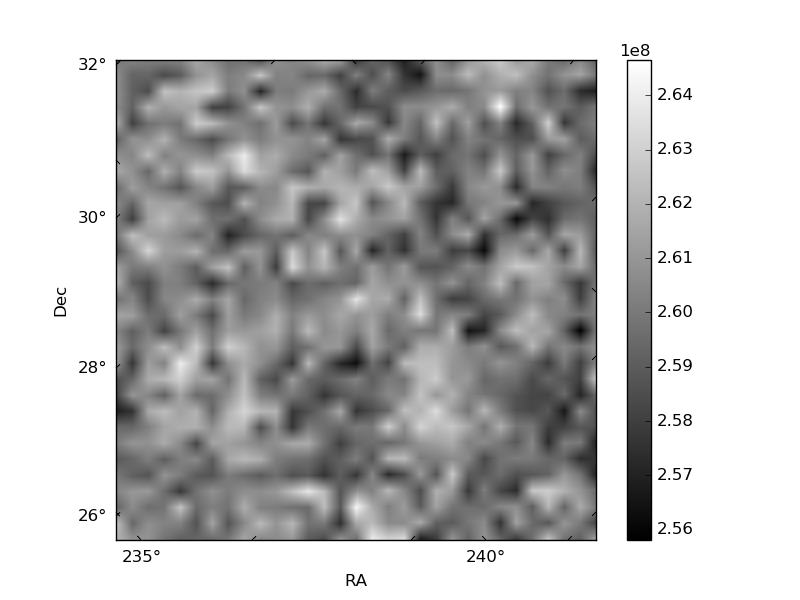
Quadrant B |
|---|---|---|---|
| Quadrant D | 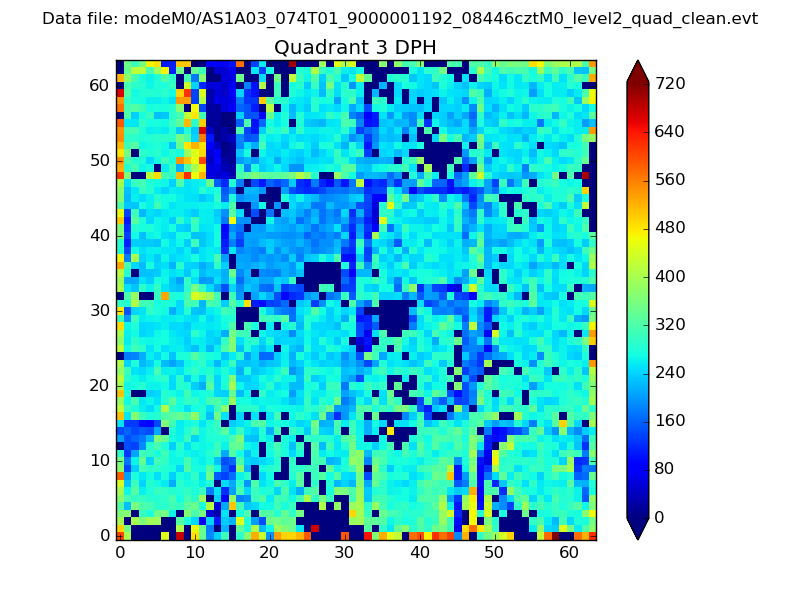 |
 |
Quadrant C |
| Plot type | Count rate plots | Images |
|---|---|---|
| Comparison with Poisson distribution Blue bars denote a histogram of data divided into 1 sec bins. Red curve is a Poisson curve with rate = median count rate of data. |
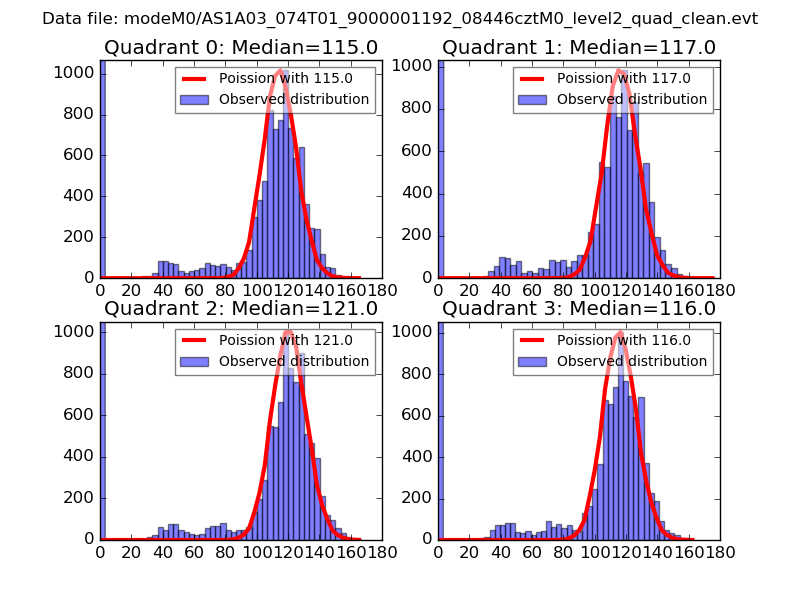 |
 |
| Quadrant-wise count rates Data is divided into 100 sec bins |
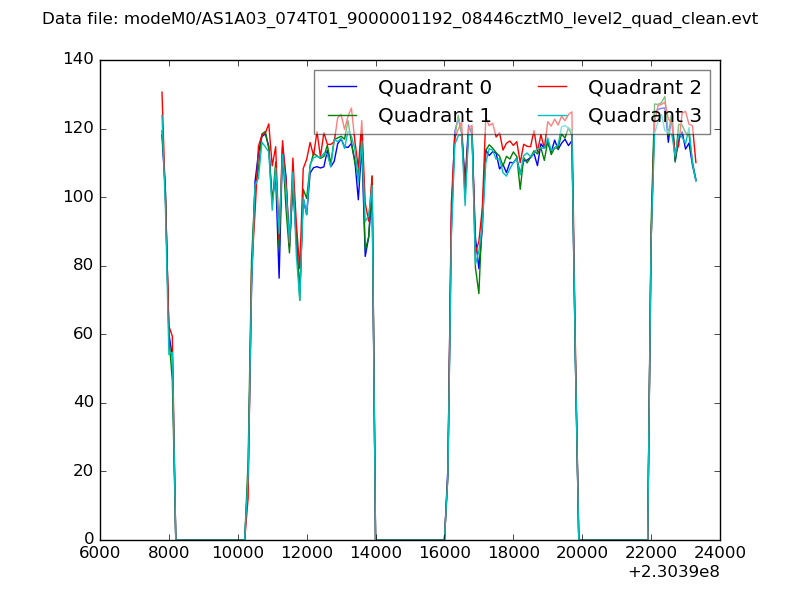 |
|
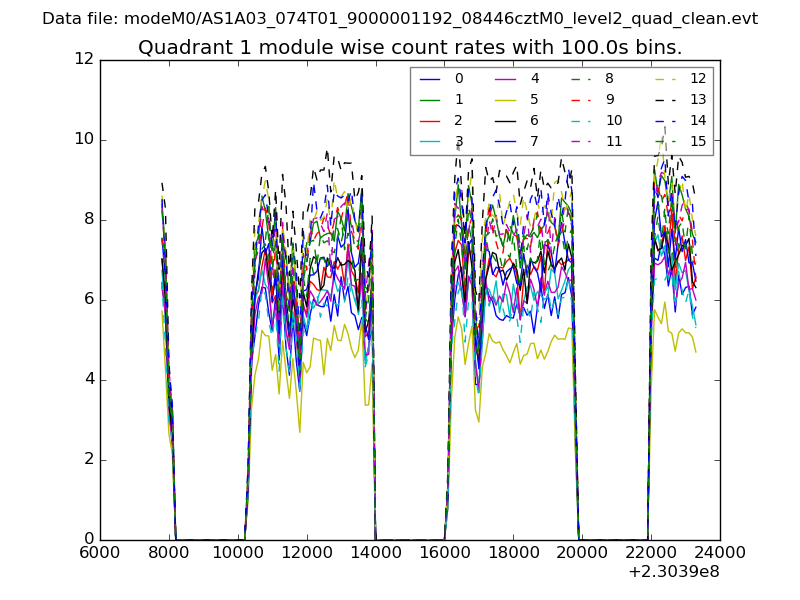
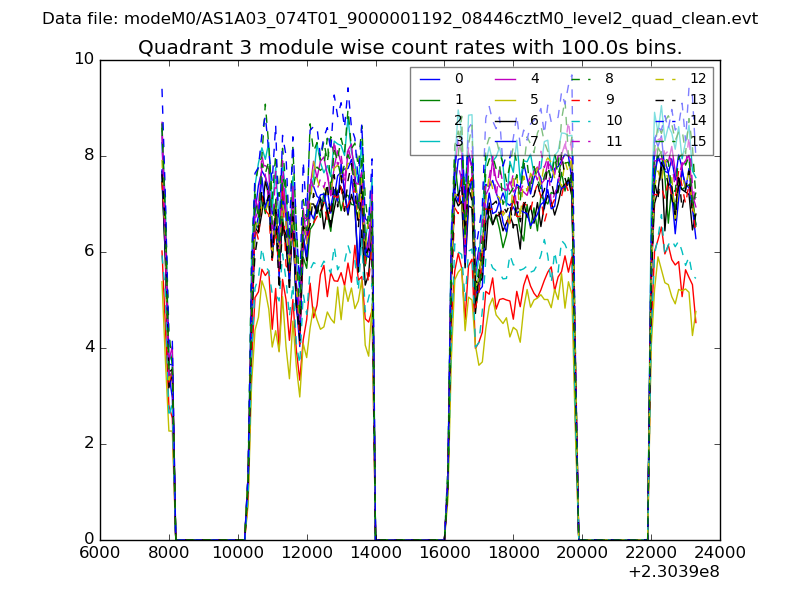
| Module-wise count rates for Quadrant A Data is divided into 100 sec bins |
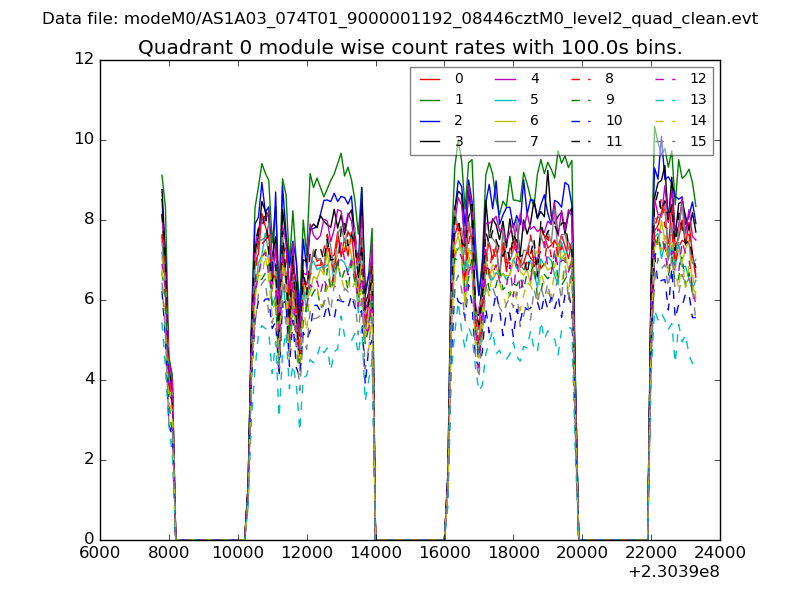 |
 |
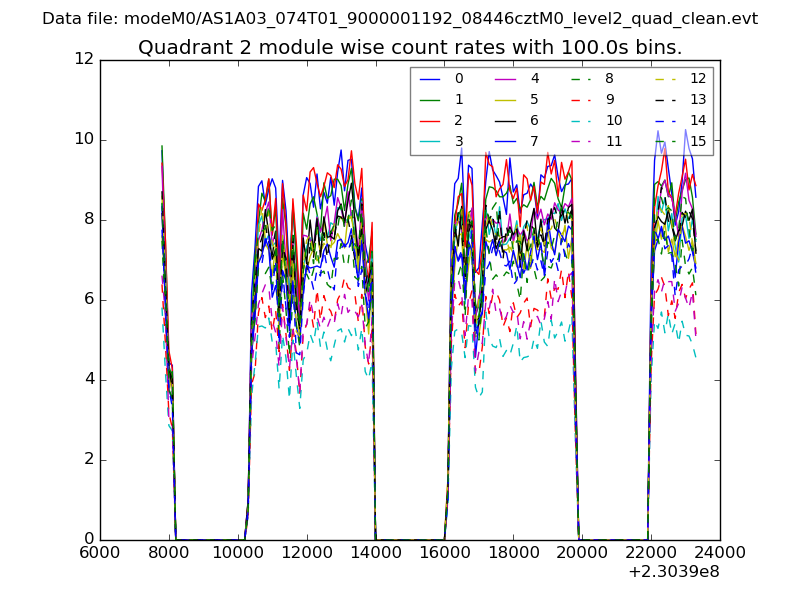
| Module-wise count rates for Quadrant B Data is divided into 100 sec bins |
 |
 |
| Module-wise count rates for Quadrant C Data is divided into 100 sec bins |
 |
 |
| Module-wise count rates for Quadrant D Data is divided into 100 sec bins |
 |
 |
| Parameter | Plot |
|---|---|
| CZT HV Monitor | 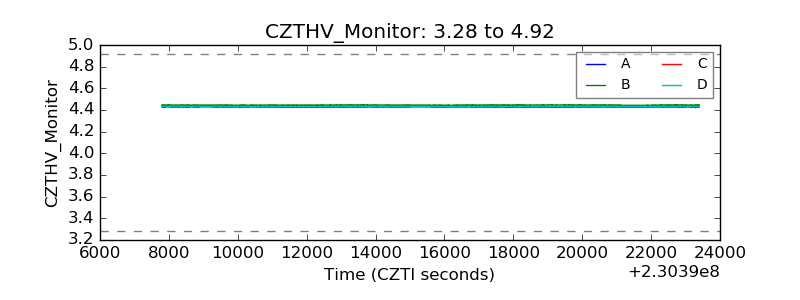 |
| D_VDD | 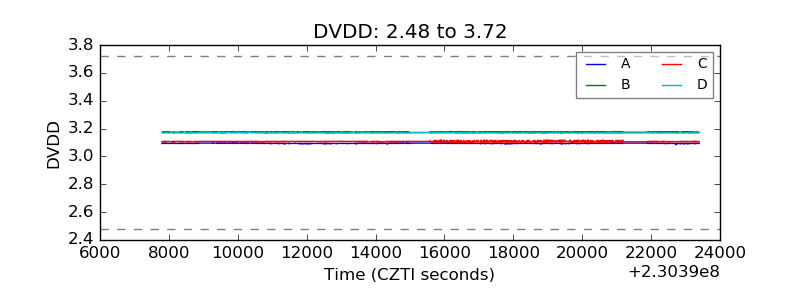 |
| Temperature 1 | 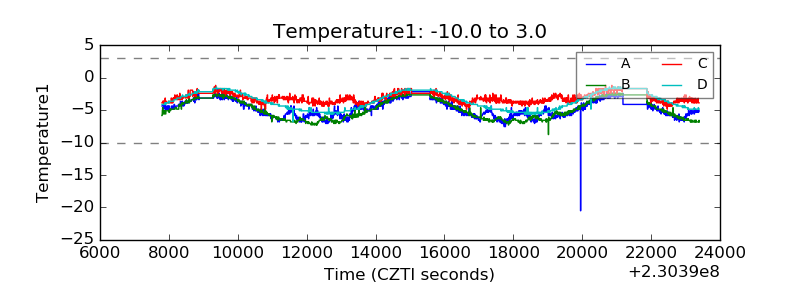 |
| Veto HV Monitor |  |
| Veto LLD | 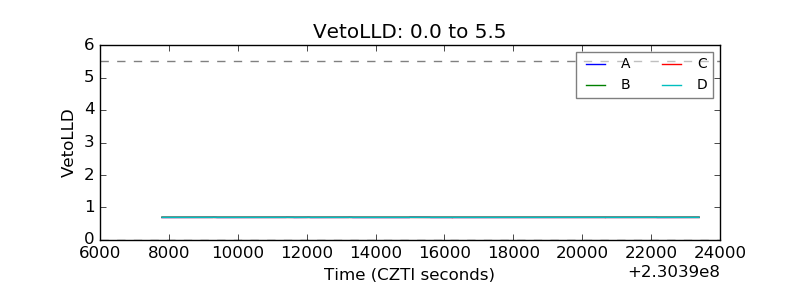 |
| Alpha Counter | 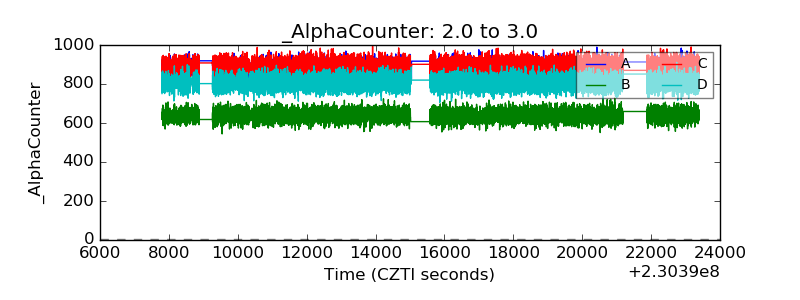 |
| _CPM_Rate | 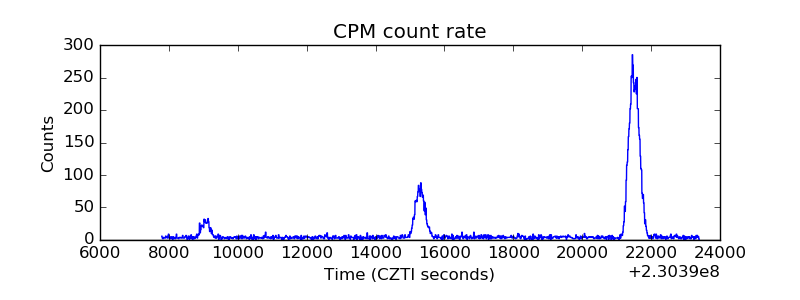 |
| CZT Counter | 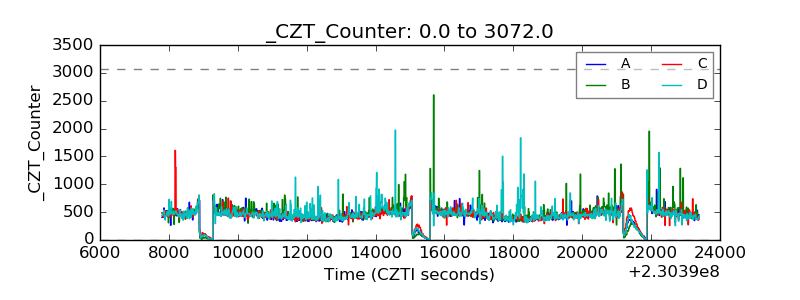 |
| +2.5 Volts monitor |  |
| +5 Volts monitor |  |
| _ROLL_ROT | 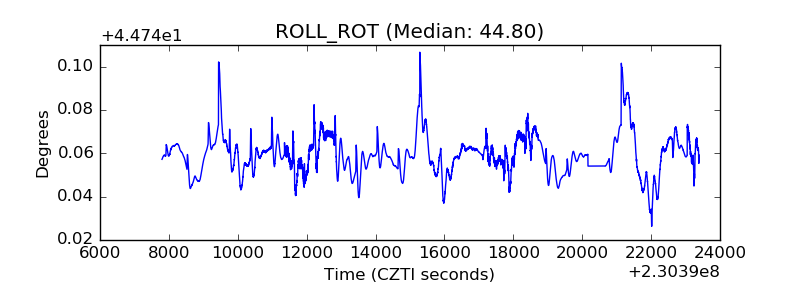 |
| _Roll_DEC | 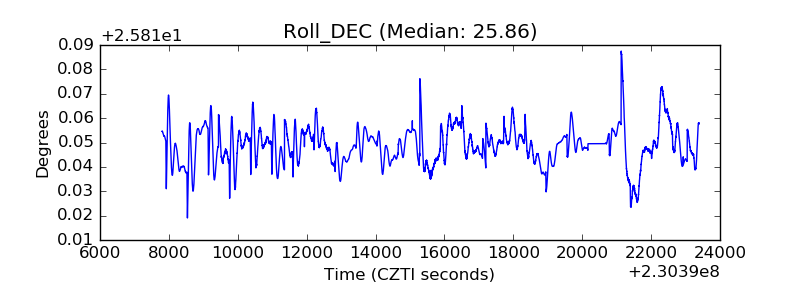 |
| _Roll_RA | 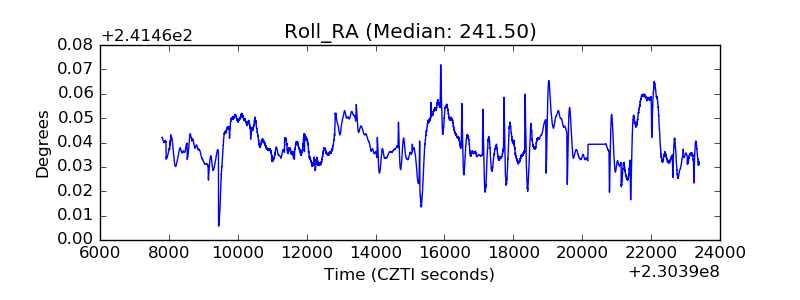 |
| Veto Counter | 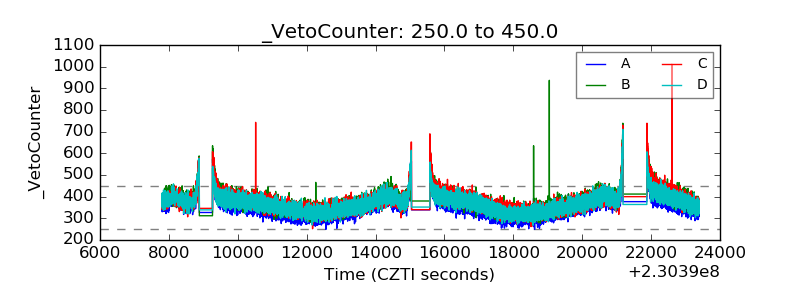 |