| Param | Original file | Final file |
|---|---|---|
| Filename | modeM0/AS1A03_074T01_9000001192_08447cztM0_level2.evt | modeM0/AS1A03_074T01_9000001192_08447cztM0_level2_quad_clean.evt |
| Size (bytes) | 454,248,000 | 97,467,840 |
| Size | 433.2 MB | 93.0 MB |
| Events in quadrant A | 3,224,821 | 607,474 |
| Events in quadrant B | 3,517,727 | 619,797 |
| Events in quadrant C | 3,125,616 | 637,610 |
| Events in quadrant D | 3,422,882 | 609,590 |
| Mode SS | |||
|---|---|---|---|
| Quadrant | BADHDUFLAG | Total packets | Discarded packets |
| A | 0 | 140 | 2 |
| B | 0 | 140 | 0 |
| C | 0 | 140 | 0 |
| D | 0 | 140 | 0 |
| Mode M9 | |||
|---|---|---|---|
| Quadrant | BADHDUFLAG | Total packets | Discarded packets |
| A | 0 | 10 | 0 |
| B | 0 | 10 | 0 |
| C | 0 | 10 | 0 |
| D | 0 | 11 | 0 |
| Mode M0 | |||
|---|---|---|---|
| Quadrant | BADHDUFLAG | Total packets | Discarded packets |
| A | 0 | 14337 | 12 |
| B | 0 | 15294 | 30 |
| C | 0 | 14028 | 16 |
| D | 0 | 14940 | 9 |
| Quadrant | Total seconds | Saturated seconds | Saturation percentage |
|---|---|---|---|
| A | 6852 | 30 | 0.437828% |
| B | 6846 | 106 | 1.548349% |
| C | 6850 | 20 | 0.291971% |
| D | 6853 | 55 | 0.802568% |
Noise dominated data is calculated using 1-second bins in cleaned event files. If a bin has >2000 counts, and if more than 50% of those come from <1% of pixels, then it is considered to be noise-dominated and hence unusable.
| Quadrant | # 1 sec bins | Bins with >0 counts | Bins with >2000 counts | High rate bins dominated by noise | Noise dominated (total time) | Noise dominated (detector-on time) | Marked lightcurve |
|---|---|---|---|---|---|---|---|
| A | 7716 | 6857 | 0 | 0 | 0.00% | 0.00% | 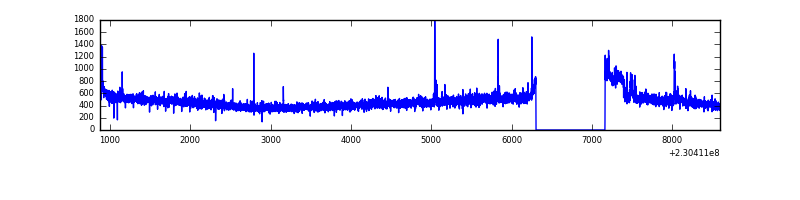 |
| B | 7716 | 6857 | 26 | 26 | 0.34% | 0.38% | 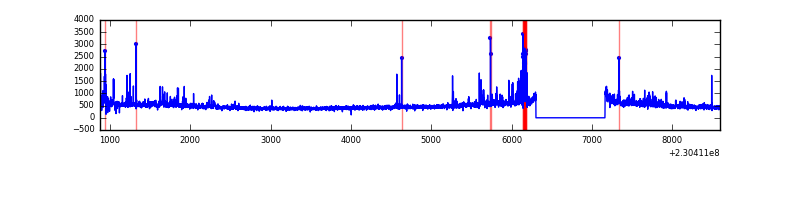 |
| C | 7716 | 6857 | 0 | 0 | 0.00% | 0.00% | 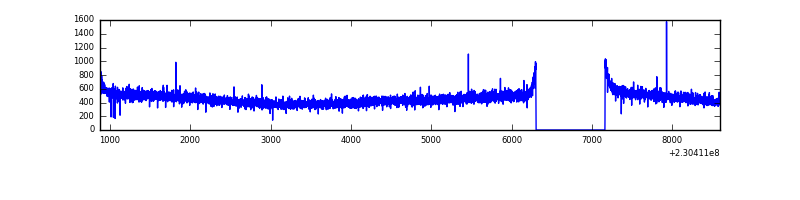 |
| D | 7716 | 6857 | 24 | 24 | 0.31% | 0.35% | 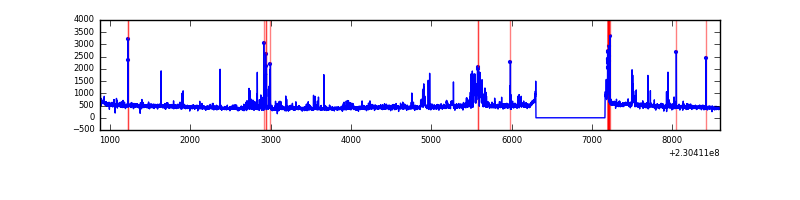 |
Top three noisy pixels from each quadrant. If the there are fewer than three noisy pixels in the level2.evt file, extra rows are filled as -1
| Pixel properties | Quadrant properties | ||||||
|---|---|---|---|---|---|---|---|
| Quadrant | DetID | PixID | Counts | Sigma | Mean | Median | Sigma |
| A | 14 | 111 | 79725 | 470.14 | 804 | 785 | 167.9 |
| A | 15 | 223 | 25332 | 146.19 | 804 | 785 | 167.9 |
| A | 13 | 14 | 9429 | 51.48 | 804 | 785 | 167.9 |
| B | 10 | 245 | 173009 | 1106.83 | 809 | 788 | 155.6 |
| B | 0 | 214 | 91734 | 584.49 | 809 | 788 | 155.6 |
| B | 4 | 81 | 70499 | 448.02 | 809 | 788 | 155.6 |
| C | 13 | 61 | 6046 | 28.01 | 800 | 803 | 187.2 |
| C | 14 | 67 | 2777 | 10.55 | 800 | 803 | 187.2 |
| C | 8 | 222 | 2620 | 9.71 | 800 | 803 | 187.2 |
| D | 1 | 52 | 170851 | 812.84 | 786 | 767 | 209.2 |
| D | 2 | 152 | 117430 | 557.54 | 786 | 767 | 209.2 |
| D | 2 | 14 | 75702 | 358.12 | 786 | 767 | 209.2 |
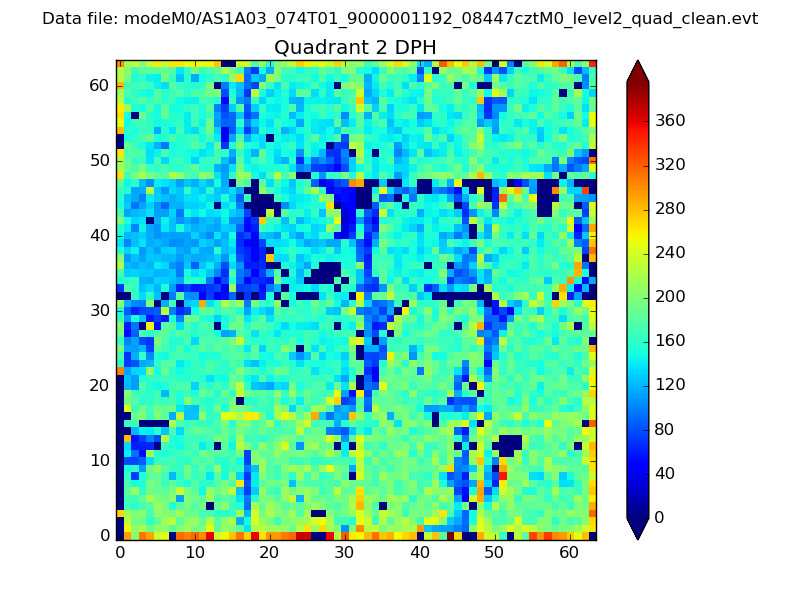
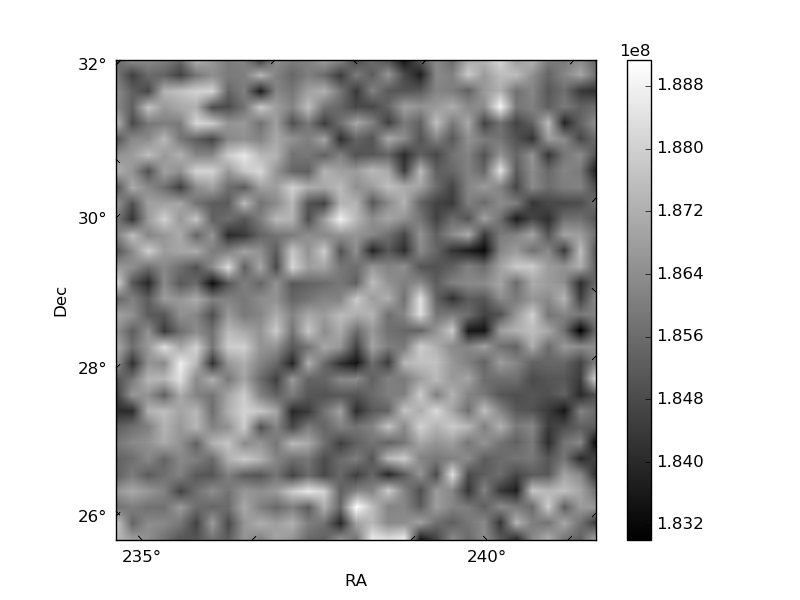
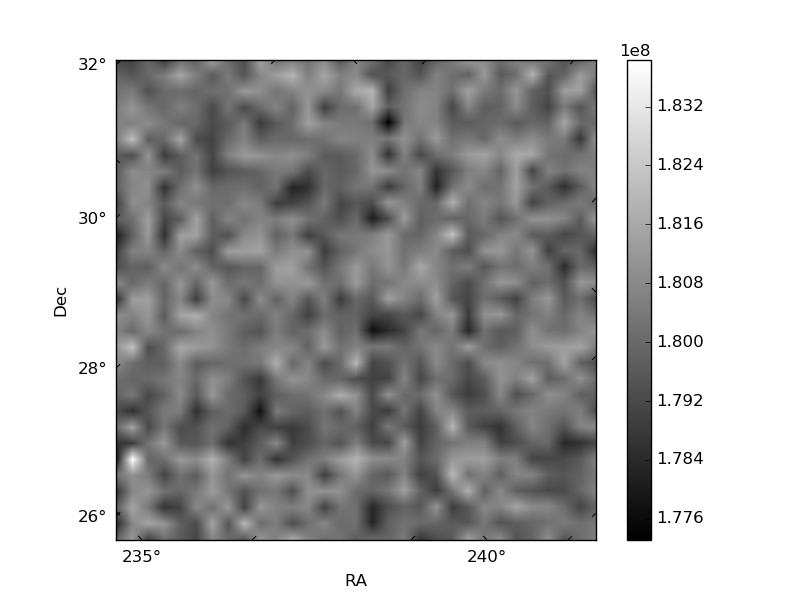
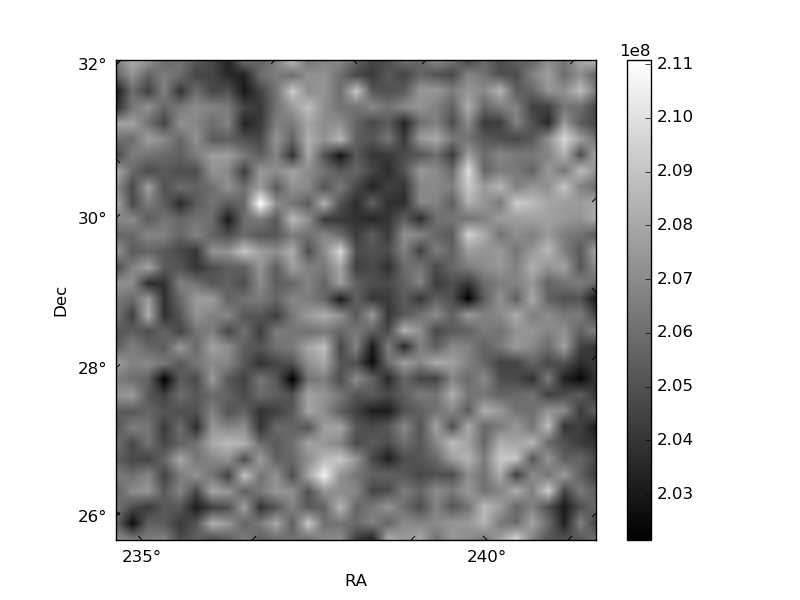
Histogram calculated using DETX and DETY for each event in the final _common_clean file
| Quadrant A |  |
 |
Quadrant B |
|---|---|---|---|
| Quadrant D | 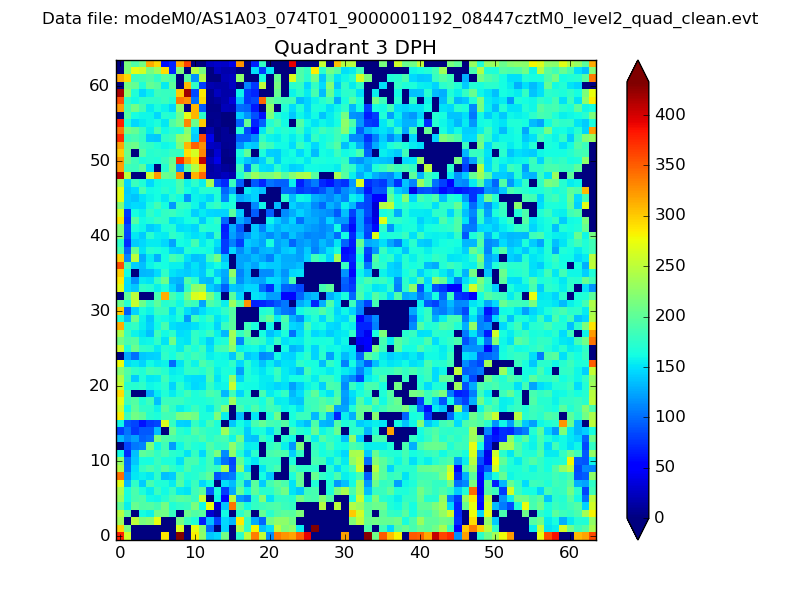 |
 |
Quadrant C |
| Plot type | Count rate plots | Images |
|---|---|---|
| Comparison with Poisson distribution Blue bars denote a histogram of data divided into 1 sec bins. Red curve is a Poisson curve with rate = median count rate of data. |
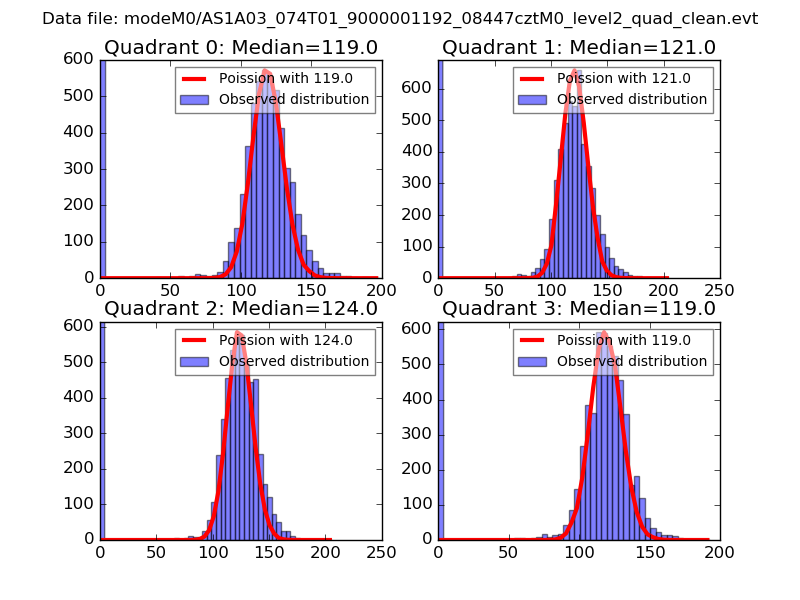 |
 |
| Quadrant-wise count rates Data is divided into 100 sec bins |
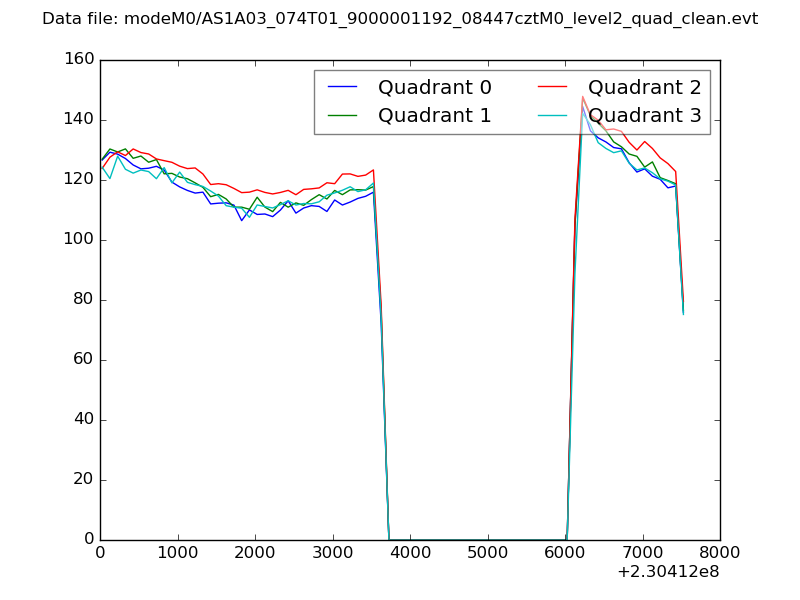 |
|
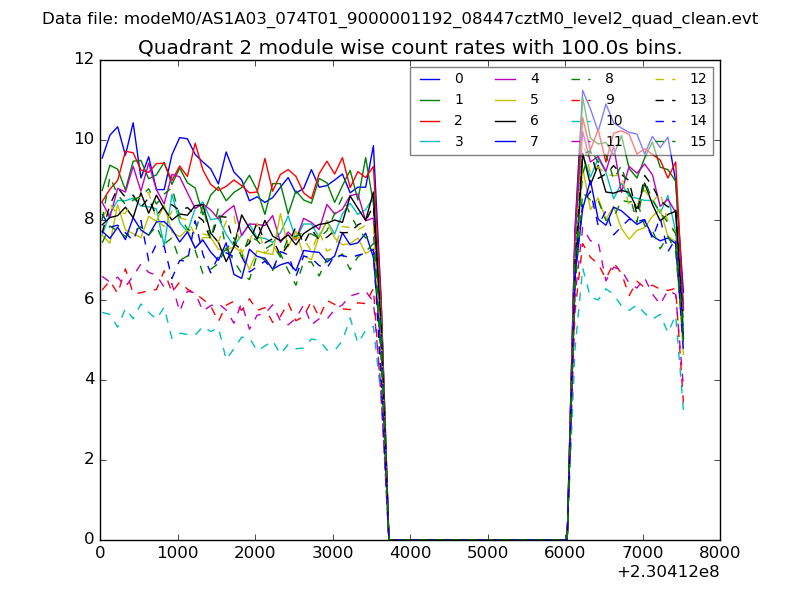
| Module-wise count rates for Quadrant A Data is divided into 100 sec bins |
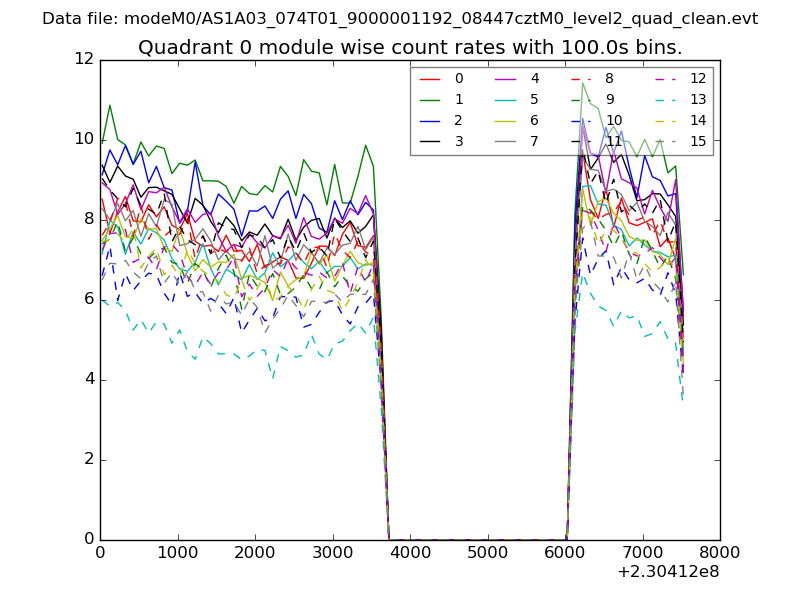 |
 |
| Module-wise count rates for Quadrant B Data is divided into 100 sec bins |
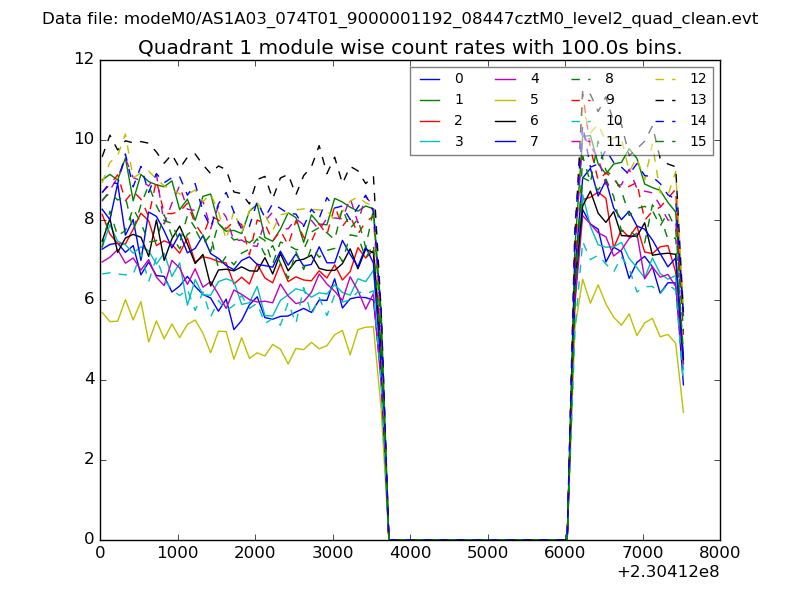 |
 |
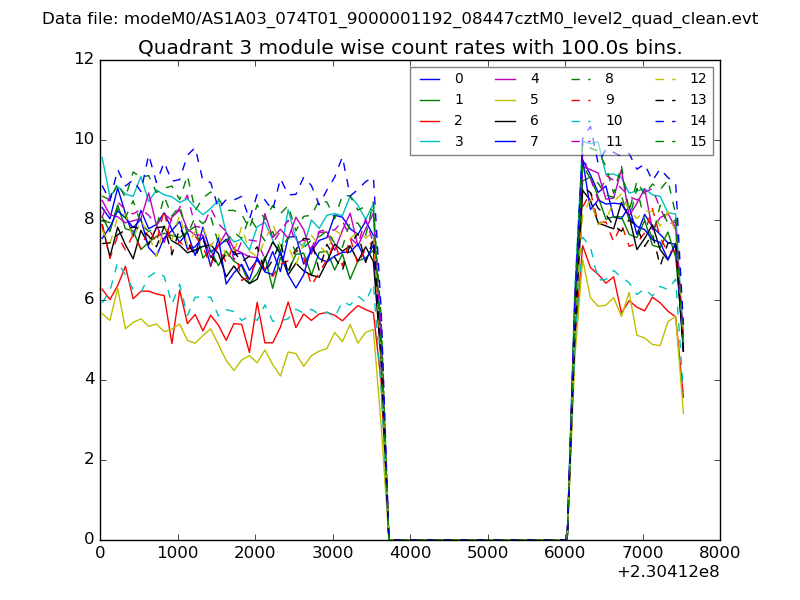
| Module-wise count rates for Quadrant C Data is divided into 100 sec bins |
 |
 |
| Module-wise count rates for Quadrant D Data is divided into 100 sec bins |
 |
 |
| Parameter | Plot |
|---|---|
| CZT HV Monitor | 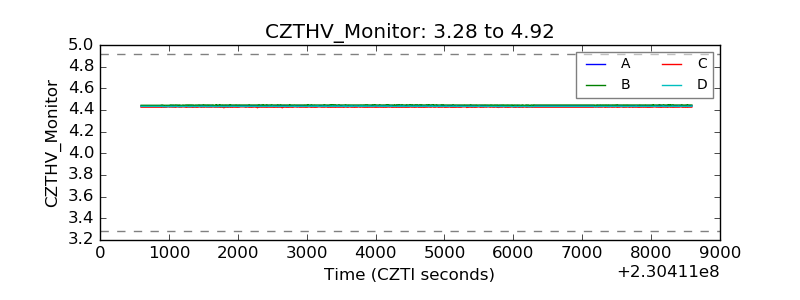 |
| D_VDD | 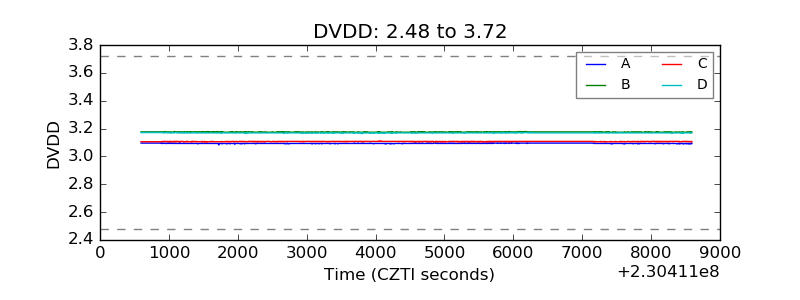 |
| Temperature 1 | 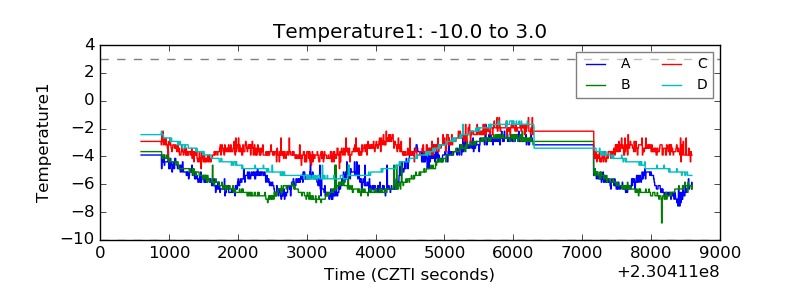 |
| Veto HV Monitor | 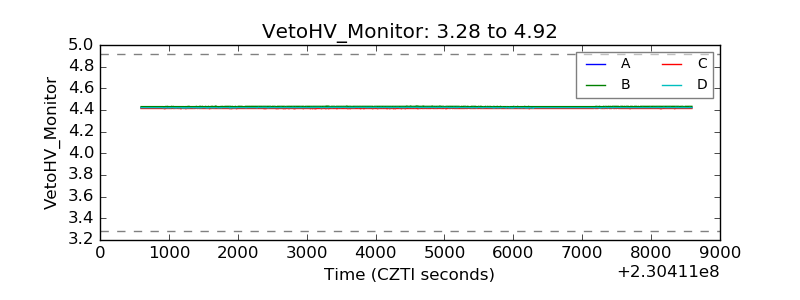 |
| Veto LLD | 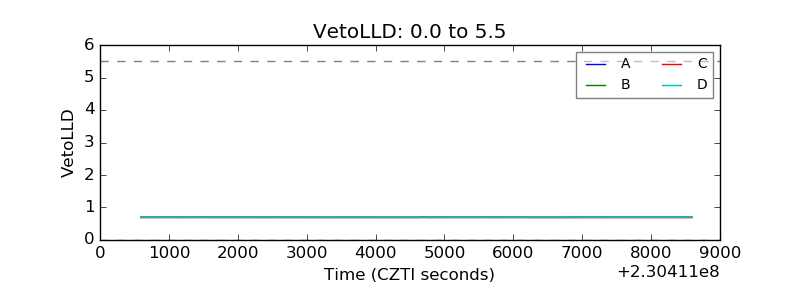 |
| Alpha Counter | 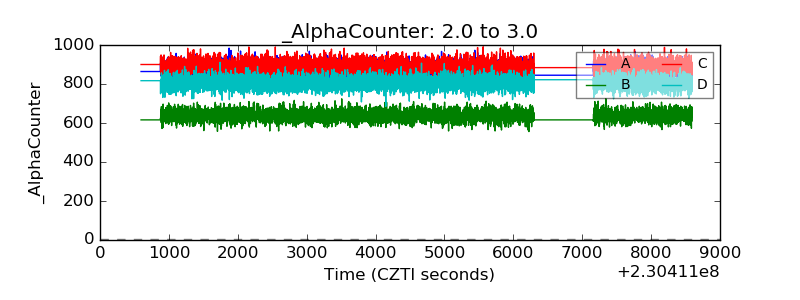 |
| _CPM_Rate | 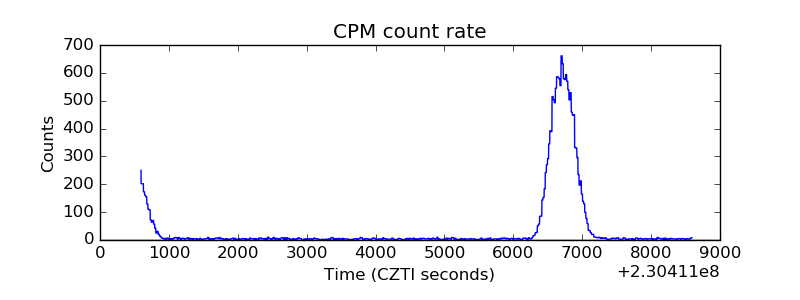 |
| CZT Counter | 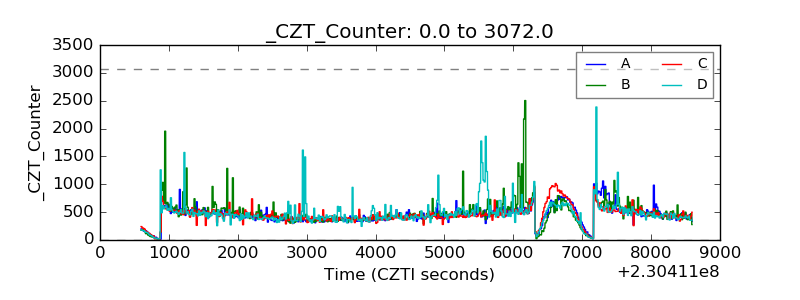 |
| +2.5 Volts monitor |  |
| +5 Volts monitor |  |
| _ROLL_ROT | 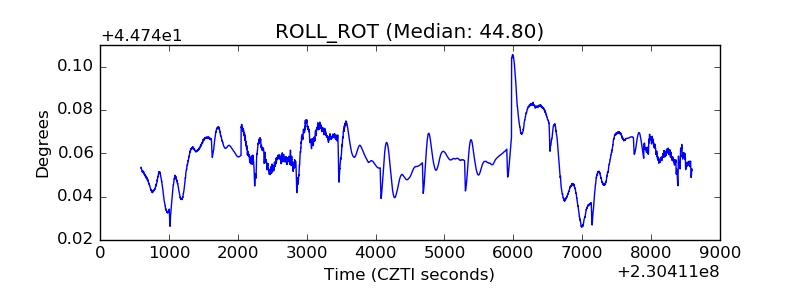 |
| _Roll_DEC | 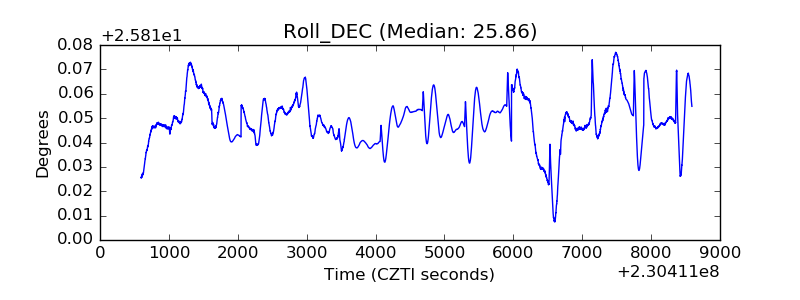 |
| _Roll_RA | 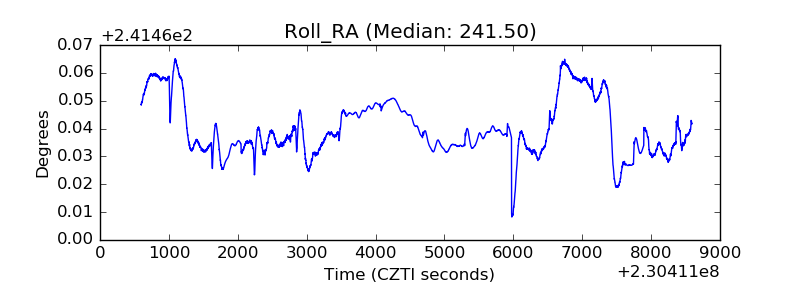 |
| Veto Counter | 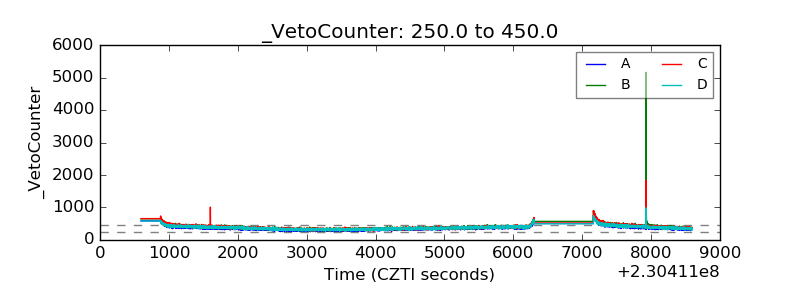 |