| Param | Original file | Final file |
|---|---|---|
| Filename | modeM0/AS1A03_074T01_9000001192_08450cztM0_level2.evt | modeM0/AS1A03_074T01_9000001192_08450cztM0_level2_quad_clean.evt |
| Size (bytes) | 406,146,240 | 88,032,960 |
| Size | 387.3 MB | 84.0 MB |
| Events in quadrant A | 2,927,483 | 546,218 |
| Events in quadrant B | 3,118,781 | 560,412 |
| Events in quadrant C | 2,930,345 | 568,760 |
| Events in quadrant D | 2,887,829 | 543,854 |
| Mode SS | |||
|---|---|---|---|
| Quadrant | BADHDUFLAG | Total packets | Discarded packets |
| A | 0 | 132 | 0 |
| B | 0 | 132 | 0 |
| C | 0 | 132 | 0 |
| D | 0 | 132 | 0 |
| Mode M9 | |||
|---|---|---|---|
| Quadrant | BADHDUFLAG | Total packets | Discarded packets |
| A | 0 | 14 | 0 |
| B | 0 | 14 | 0 |
| C | 0 | 14 | 0 |
| D | 0 | 15 | 0 |
| Mode M0 | |||
|---|---|---|---|
| Quadrant | BADHDUFLAG | Total packets | Discarded packets |
| A | 0 | 13101 | 3 |
| B | 0 | 13534 | 2 |
| C | 0 | 13137 | 5 |
| D | 0 | 13224 | 2 |
| Quadrant | Total seconds | Saturated seconds | Saturation percentage |
|---|---|---|---|
| A | 6395 | 24 | 0.375293% |
| B | 6395 | 34 | 0.531665% |
| C | 6394 | 14 | 0.218955% |
| D | 6395 | 14 | 0.218921% |
Noise dominated data is calculated using 1-second bins in cleaned event files. If a bin has >2000 counts, and if more than 50% of those come from <1% of pixels, then it is considered to be noise-dominated and hence unusable.
| Quadrant | # 1 sec bins | Bins with >0 counts | Bins with >2000 counts | High rate bins dominated by noise | Noise dominated (total time) | Noise dominated (detector-on time) | Marked lightcurve |
|---|---|---|---|---|---|---|---|
| A | 7545 | 6396 | 0 | 0 | 0.00% | 0.00% |  |
| B | 7545 | 6396 | 0 | 0 | 0.00% | 0.00% |  |
| C | 7545 | 6396 | 0 | 0 | 0.00% | 0.00% | 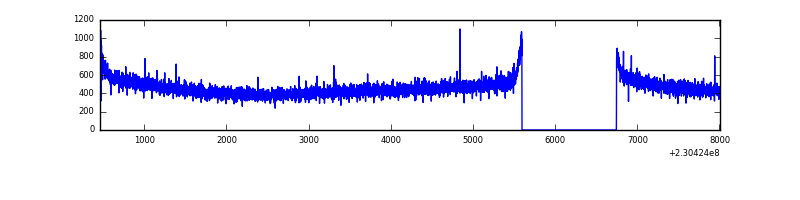 |
| D | 7545 | 6396 | 6 | 6 | 0.08% | 0.09% |  |
Top three noisy pixels from each quadrant. If the there are fewer than three noisy pixels in the level2.evt file, extra rows are filled as -1
| Pixel properties | Quadrant properties | ||||||
|---|---|---|---|---|---|---|---|
| Quadrant | DetID | PixID | Counts | Sigma | Mean | Median | Sigma |
| A | 0 | 226 | 7239 | 41.89 | 761 | 746 | 155.0 |
| A | 12 | 194 | 6742 | 38.69 | 761 | 746 | 155.0 |
| A | 3 | 137 | 3016 | 14.65 | 761 | 746 | 155.0 |
| B | 4 | 81 | 51752 | 351.21 | 768 | 750 | 145.2 |
| B | 0 | 214 | 28553 | 191.46 | 768 | 750 | 145.2 |
| B | 4 | 48 | 22166 | 147.48 | 768 | 750 | 145.2 |
| C | 13 | 61 | 5690 | 28.33 | 751 | 757 | 174.1 |
| C | 8 | 222 | 2224 | 8.43 | 751 | 757 | 174.1 |
| C | 3 | 202 | 1929 | 6.73 | 751 | 757 | 174.1 |
| D | 7 | 71 | 45213 | 244.81 | 739 | 719 | 181.7 |
| D | 2 | 234 | 19334 | 102.42 | 739 | 719 | 181.7 |
| D | 2 | 14 | 15269 | 80.06 | 739 | 719 | 181.7 |
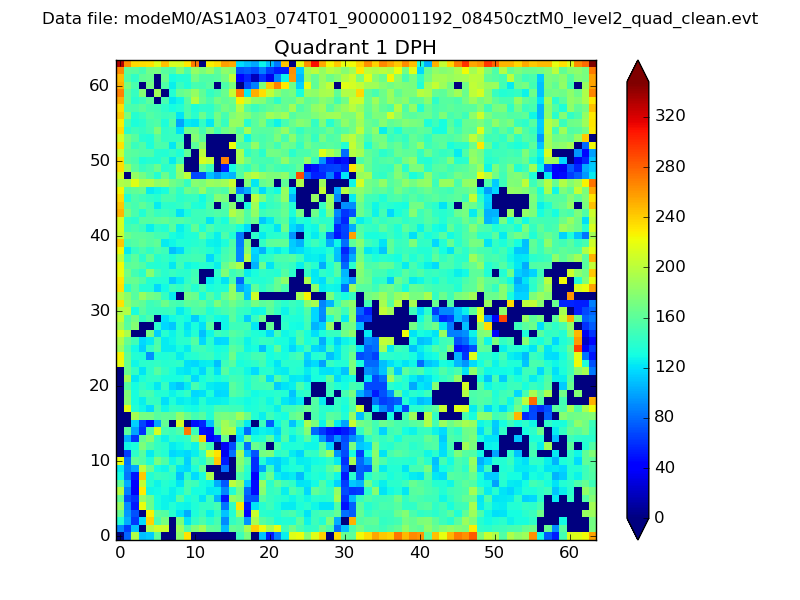
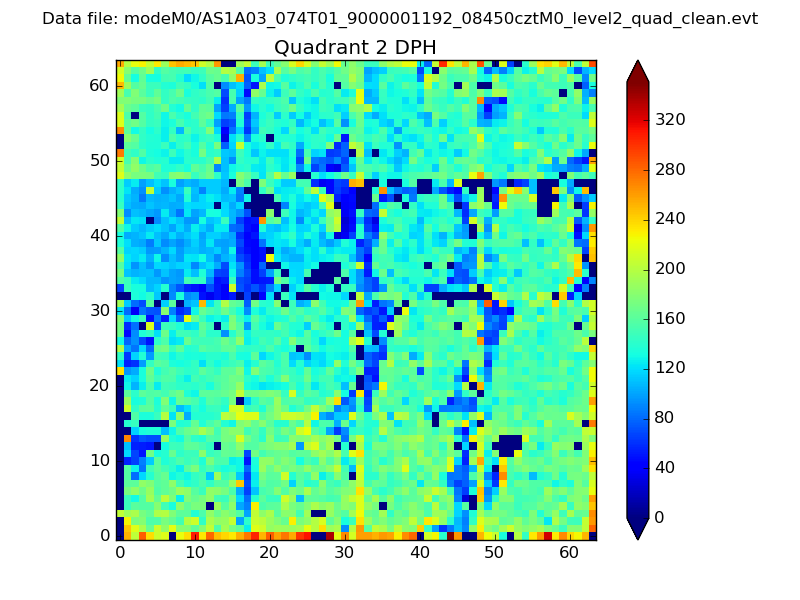
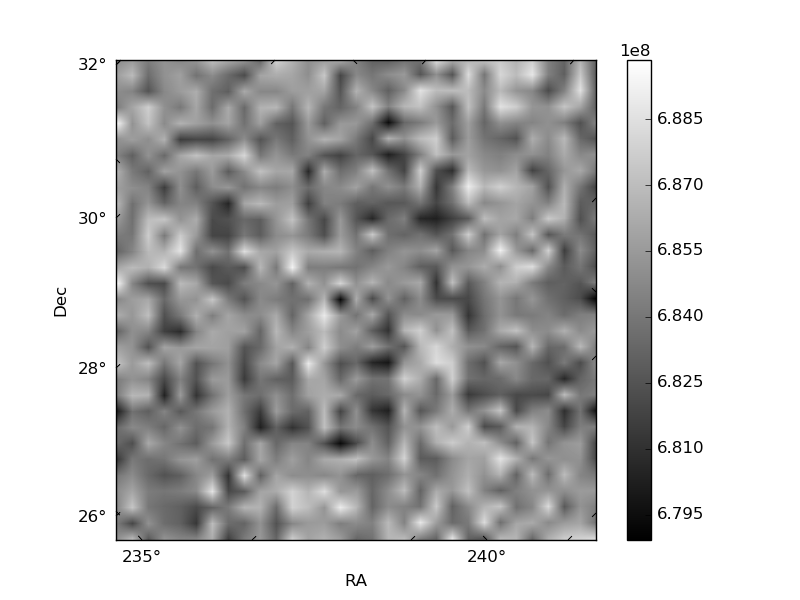
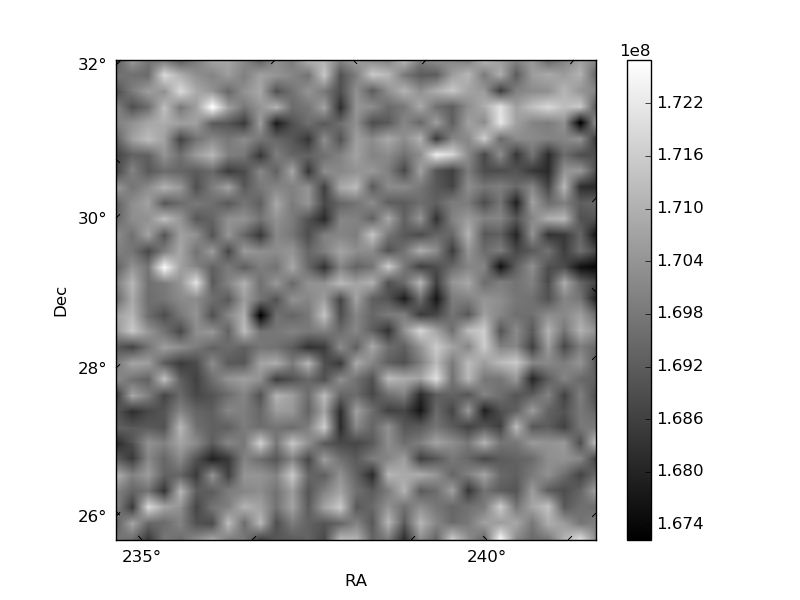
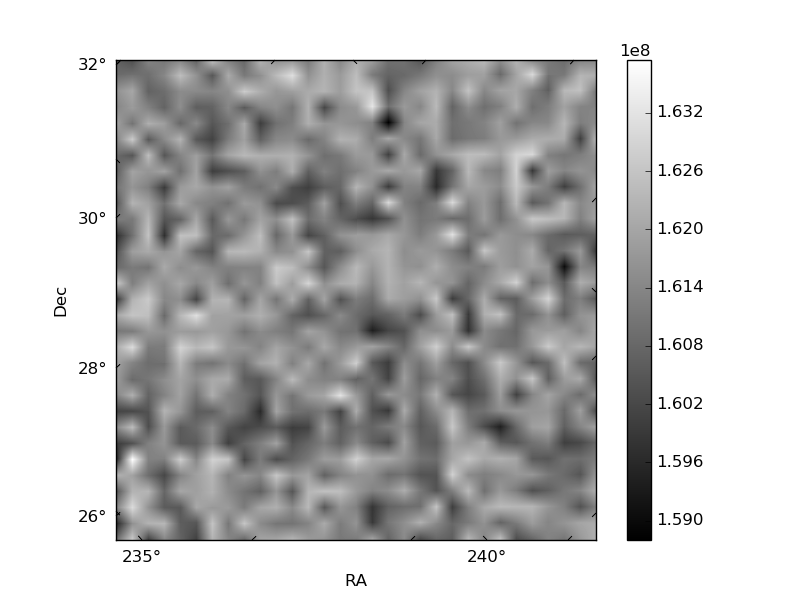
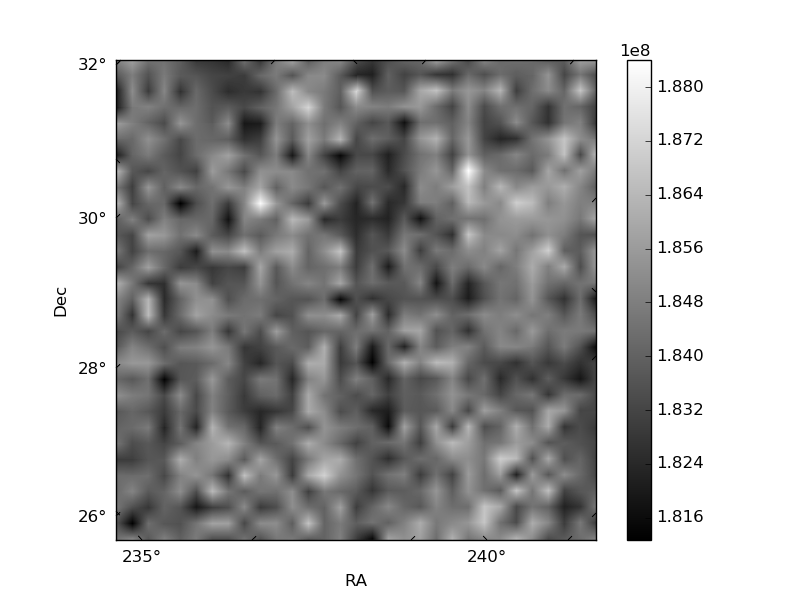
Histogram calculated using DETX and DETY for each event in the final _common_clean file
| Quadrant A |  |
 |
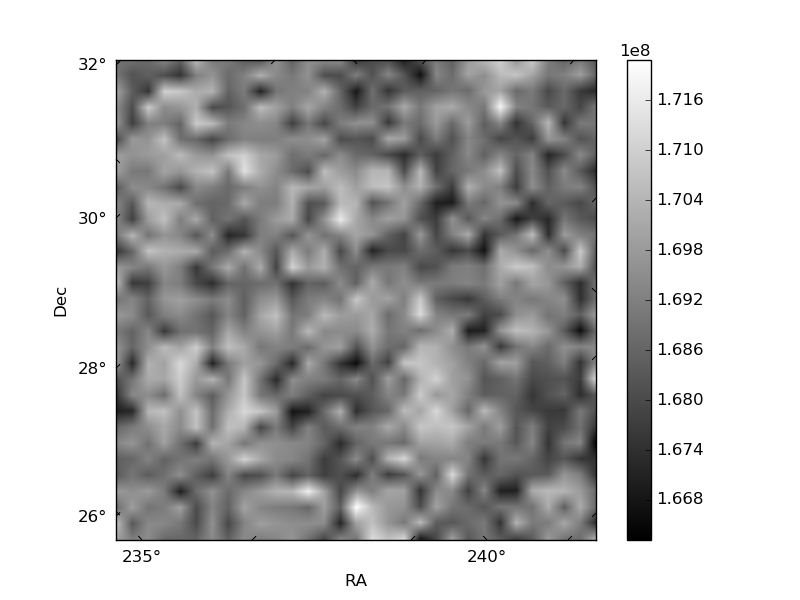
Quadrant B |
|---|---|---|---|
| Quadrant D | 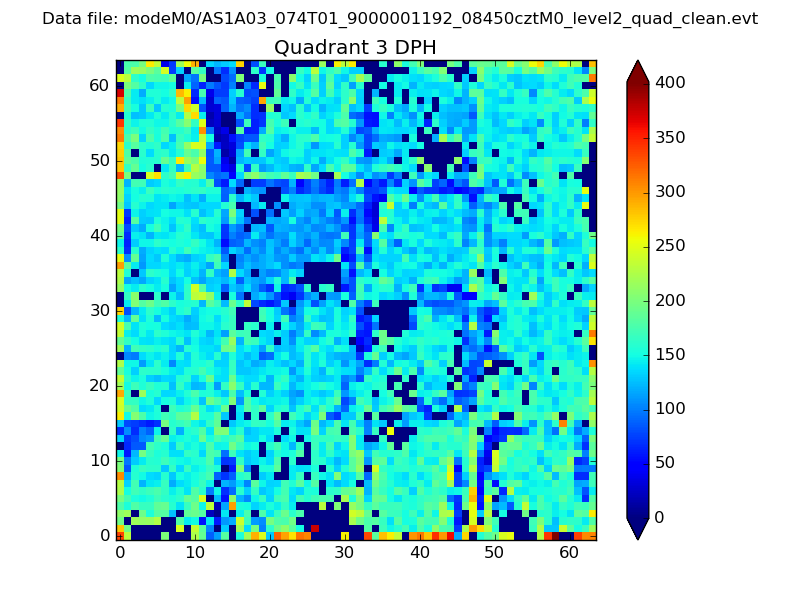 |
 |
Quadrant C |
| Plot type | Count rate plots | Images |
|---|---|---|
| Comparison with Poisson distribution Blue bars denote a histogram of data divided into 1 sec bins. Red curve is a Poisson curve with rate = median count rate of data. |
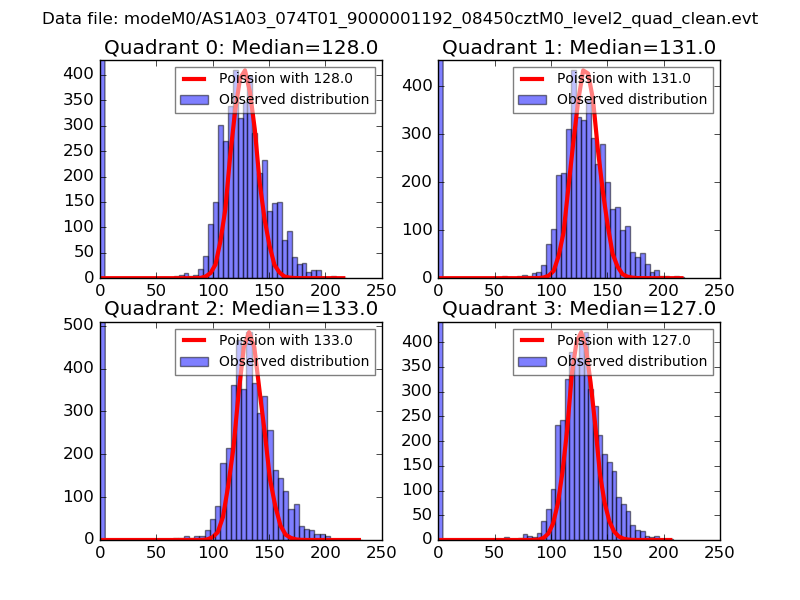 |
 |
| Quadrant-wise count rates Data is divided into 100 sec bins |
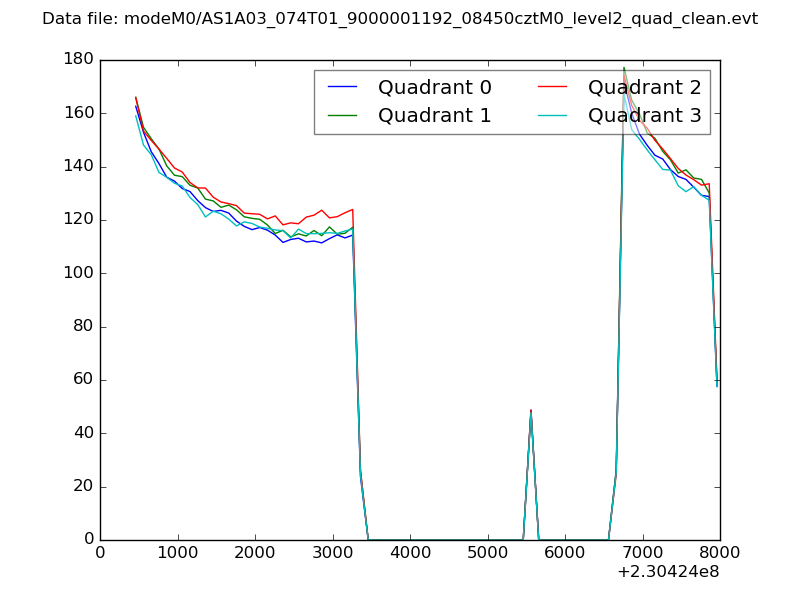 |
|
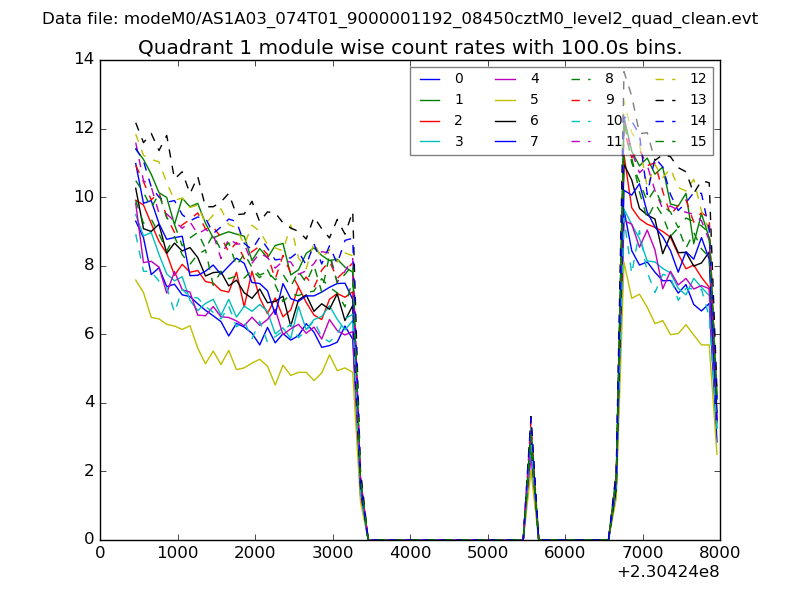
| Module-wise count rates for Quadrant A Data is divided into 100 sec bins |
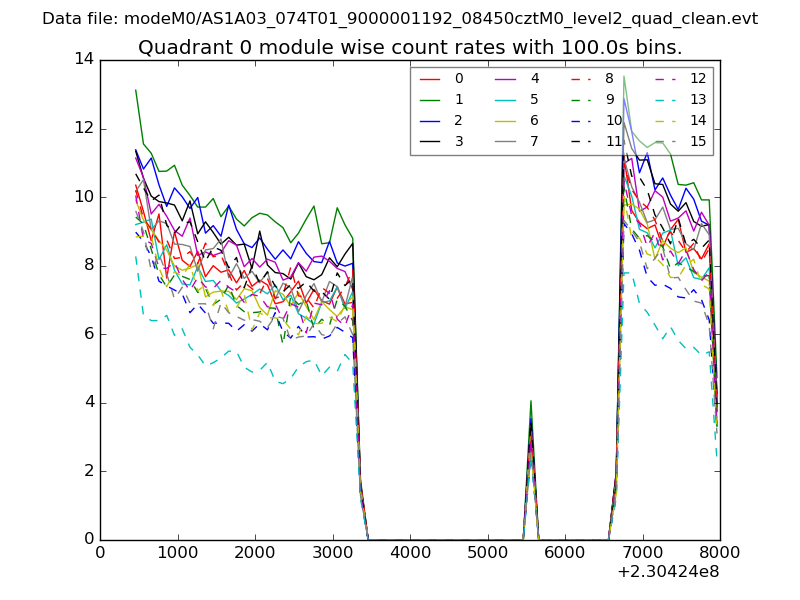 |
 |
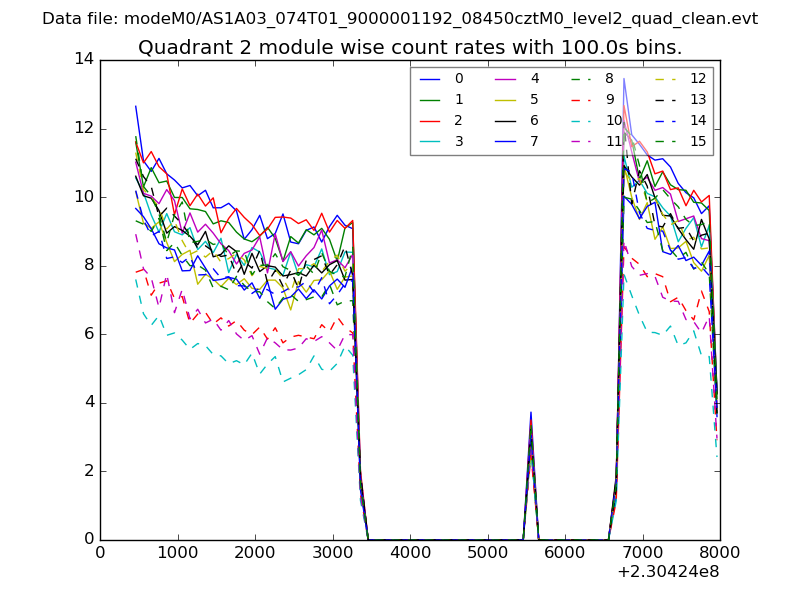
| Module-wise count rates for Quadrant B Data is divided into 100 sec bins |
 |
 |
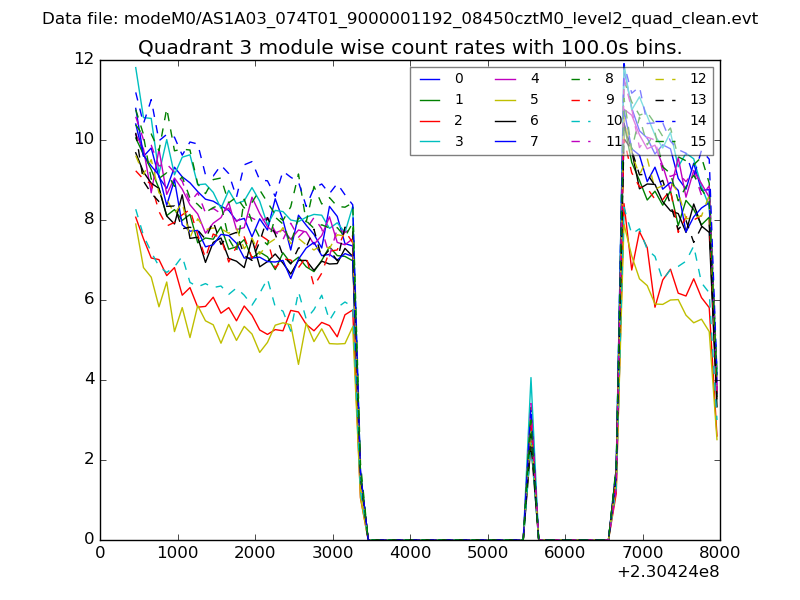
| Module-wise count rates for Quadrant C Data is divided into 100 sec bins |
 |
 |
| Module-wise count rates for Quadrant D Data is divided into 100 sec bins |
 |
 |
| Parameter | Plot |
|---|---|
| CZT HV Monitor | 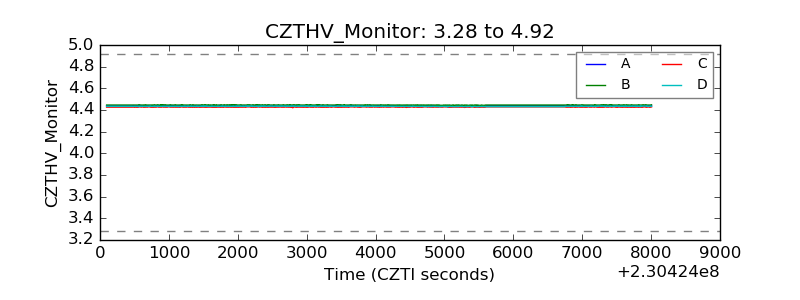 |
| D_VDD | 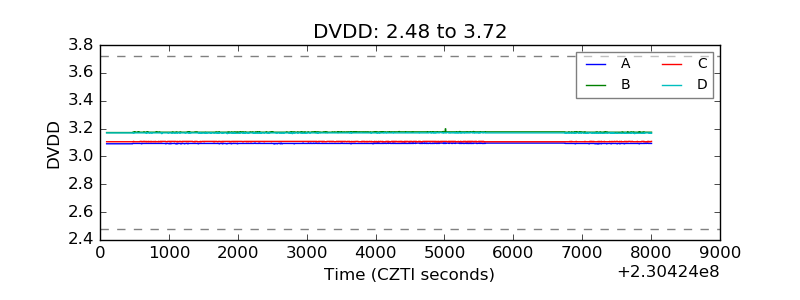 |
| Temperature 1 | 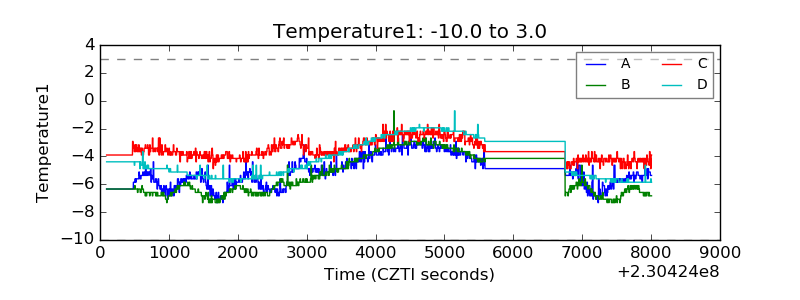 |
| Veto HV Monitor | 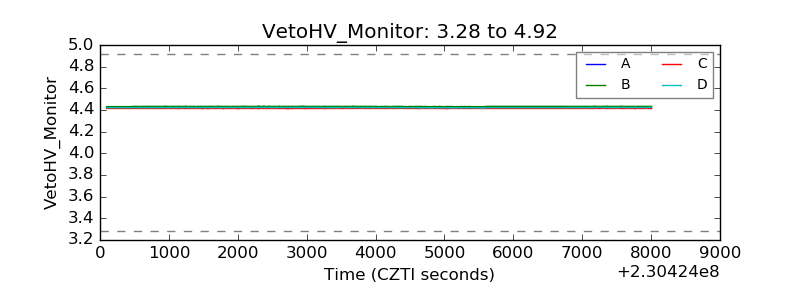 |
| Veto LLD | 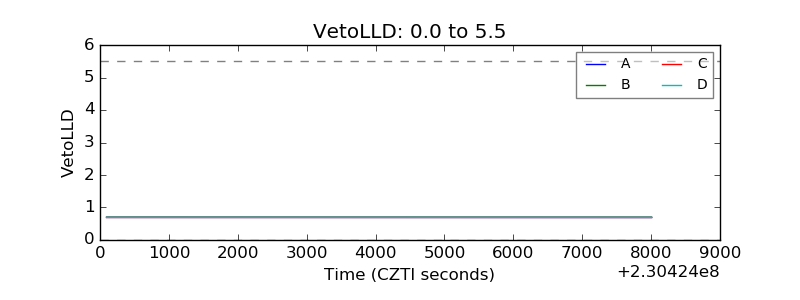 |
| Alpha Counter | 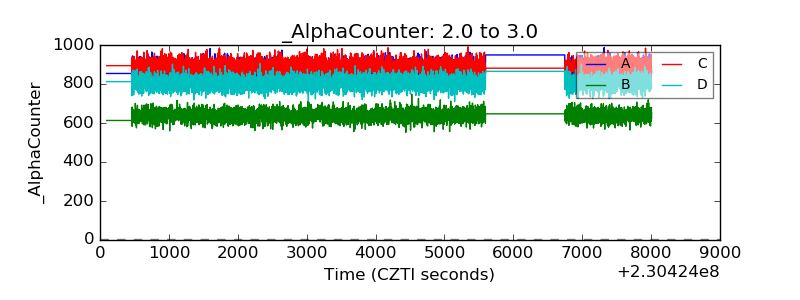 |
| _CPM_Rate | 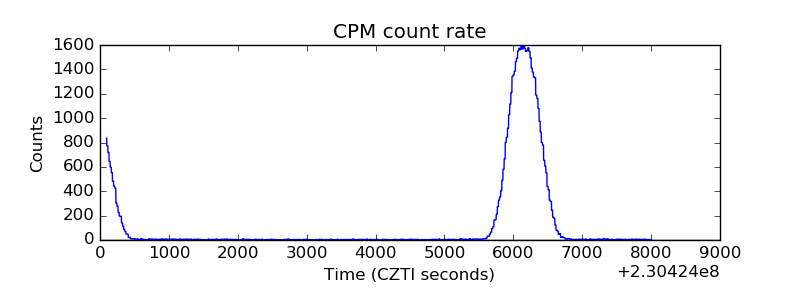 |
| CZT Counter | 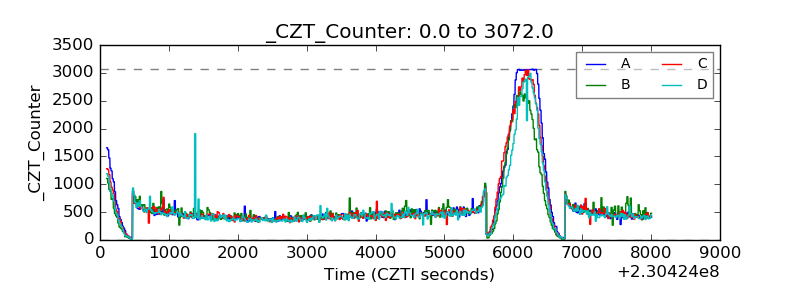 |
| +2.5 Volts monitor |  |
| +5 Volts monitor |  |
| _ROLL_ROT | 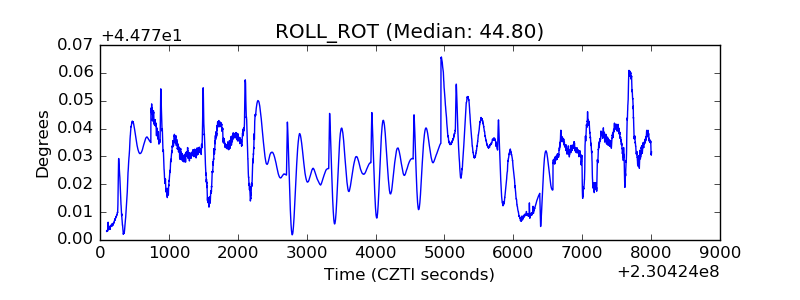 |
| _Roll_DEC | 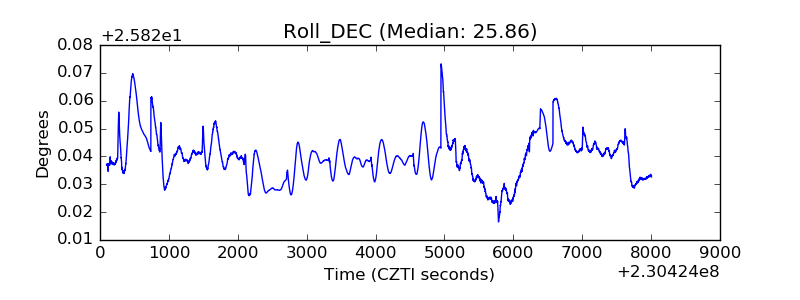 |
| _Roll_RA | 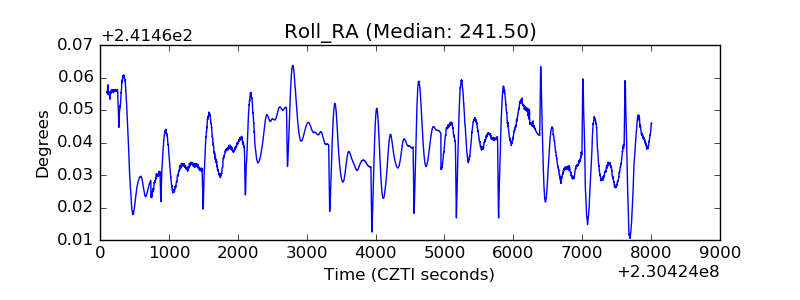 |
| Veto Counter | 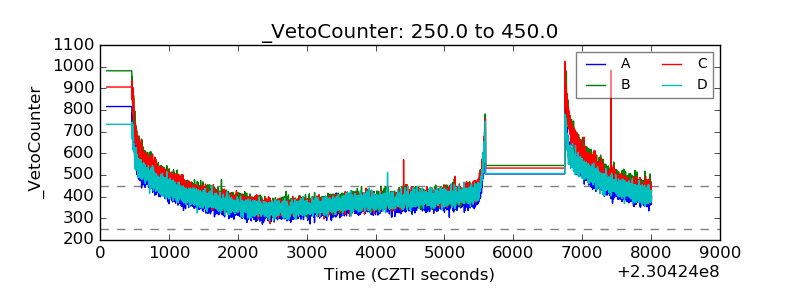 |