| Param | Original file | Final file |
|---|---|---|
| Filename | modeM0/AS1A03_074T01_9000001192_08453cztM0_level2.evt | modeM0/AS1A03_074T01_9000001192_08453cztM0_level2_quad_clean.evt |
| Size (bytes) | 686,888,640 | 127,071,360 |
| Size | 655.1 MB | 121.2 MB |
| Events in quadrant A | 4,935,565 | 780,908 |
| Events in quadrant B | 5,431,927 | 790,518 |
| Events in quadrant C | 4,805,499 | 796,459 |
| Events in quadrant D | 4,934,422 | 770,046 |
| Mode SS | |||
|---|---|---|---|
| Quadrant | BADHDUFLAG | Total packets | Discarded packets |
| A | 0 | 208 | 0 |
| B | 0 | 208 | 0 |
| C | 0 | 208 | 0 |
| D | 0 | 208 | 0 |
| Mode M9 | |||
|---|---|---|---|
| Quadrant | BADHDUFLAG | Total packets | Discarded packets |
| A | 0 | 26 | 0 |
| B | 0 | 26 | 0 |
| C | 0 | 26 | 0 |
| D | 0 | 26 | 0 |
| Mode M0 | |||
|---|---|---|---|
| Quadrant | BADHDUFLAG | Total packets | Discarded packets |
| A | 0 | 21074 | 3 |
| B | 0 | 22441 | 2 |
| C | 0 | 21064 | 2 |
| D | 0 | 21546 | 2 |
| Quadrant | Total seconds | Saturated seconds | Saturation percentage |
|---|---|---|---|
| A | 10258 | 60 | 0.584909% |
| B | 10258 | 130 | 1.267304% |
| C | 10258 | 28 | 0.272958% |
| D | 10258 | 39 | 0.380191% |
Noise dominated data is calculated using 1-second bins in cleaned event files. If a bin has >2000 counts, and if more than 50% of those come from <1% of pixels, then it is considered to be noise-dominated and hence unusable.
| Quadrant | # 1 sec bins | Bins with >0 counts | Bins with >2000 counts | High rate bins dominated by noise | Noise dominated (total time) | Noise dominated (detector-on time) | Marked lightcurve |
|---|---|---|---|---|---|---|---|
| A | 12873 | 10260 | 0 | 0 | 0.00% | 0.00% | 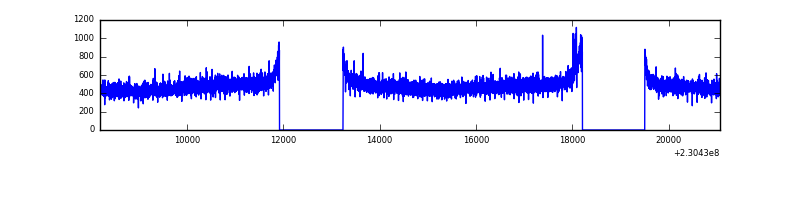 |
| B | 12873 | 10259 | 18 | 18 | 0.14% | 0.18% | 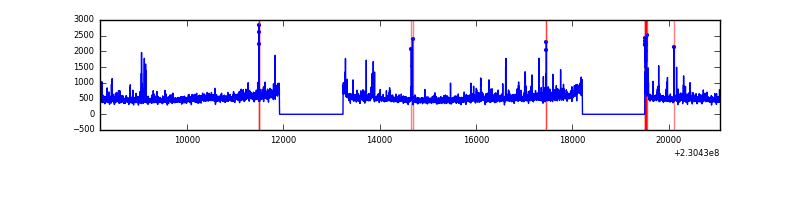 |
| C | 12873 | 10260 | 0 | 0 | 0.00% | 0.00% | 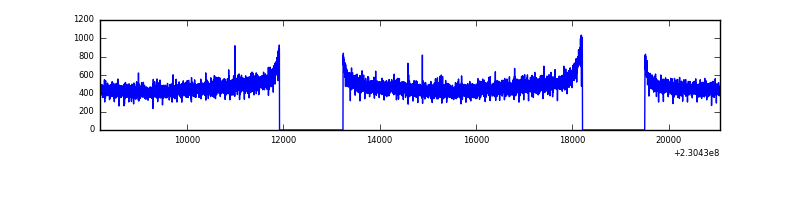 |
| D | 12873 | 10260 | 6 | 6 | 0.05% | 0.06% | 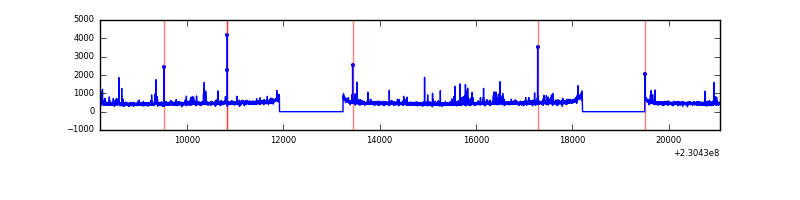 |
Top three noisy pixels from each quadrant. If the there are fewer than three noisy pixels in the level2.evt file, extra rows are filled as -1
| Pixel properties | Quadrant properties | ||||||
|---|---|---|---|---|---|---|---|
| Quadrant | DetID | PixID | Counts | Sigma | Mean | Median | Sigma |
| A | 0 | 226 | 12028 | 42.07 | 1279 | 1252 | 256.1 |
| A | 13 | 251 | 11612 | 40.45 | 1279 | 1252 | 256.1 |
| A | 12 | 194 | 11599 | 40.39 | 1279 | 1252 | 256.1 |
| B | 11 | 51 | 123198 | 502.09 | 1274 | 1247 | 242.9 |
| B | 0 | 214 | 98992 | 402.43 | 1274 | 1247 | 242.9 |
| B | 5 | 255 | 98161 | 399.01 | 1274 | 1247 | 242.9 |
| C | 13 | 61 | 9248 | 28.39 | 1231 | 1239 | 282.1 |
| C | 8 | 222 | 7363 | 21.71 | 1231 | 1239 | 282.1 |
| C | 3 | 202 | 3066 | 6.48 | 1231 | 1239 | 282.1 |
| D | 1 | 52 | 71583 | 238.36 | 1234 | 1204 | 295.3 |
| D | 2 | 152 | 65122 | 216.48 | 1234 | 1204 | 295.3 |
| D | 14 | 34 | 43063 | 141.77 | 1234 | 1204 | 295.3 |
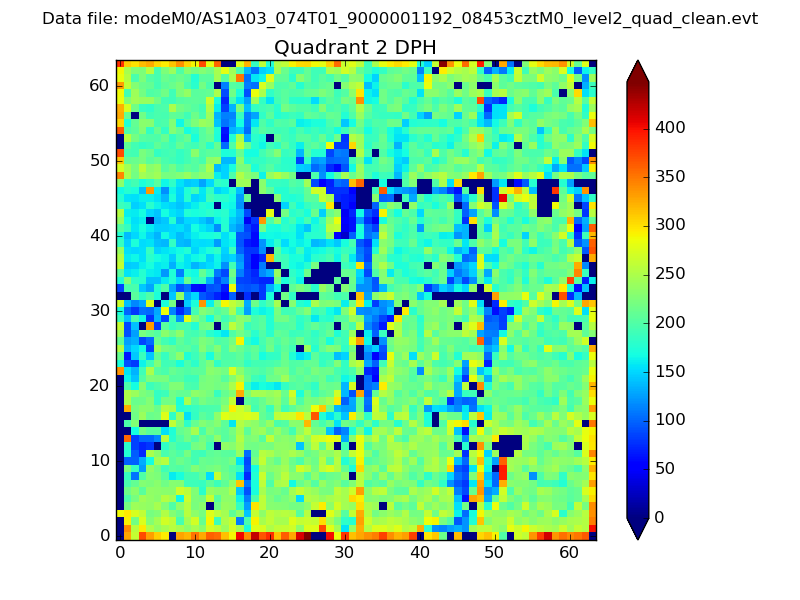
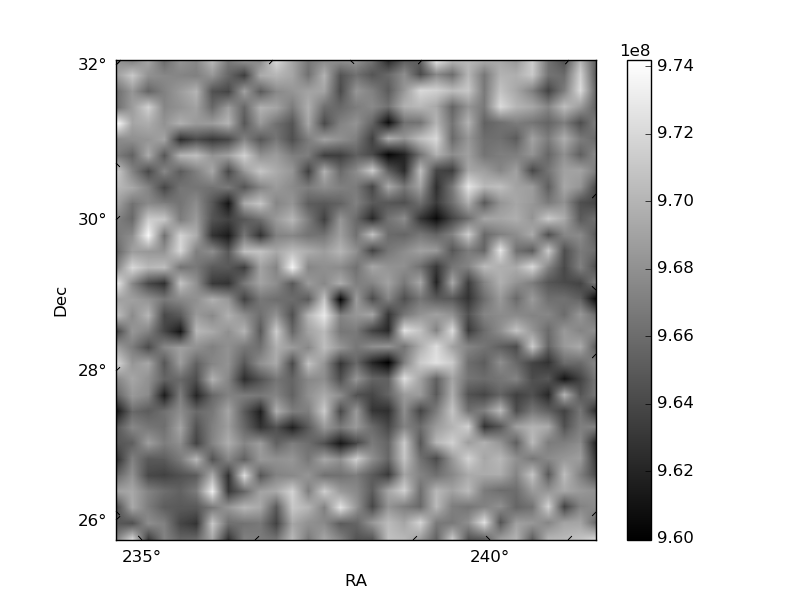
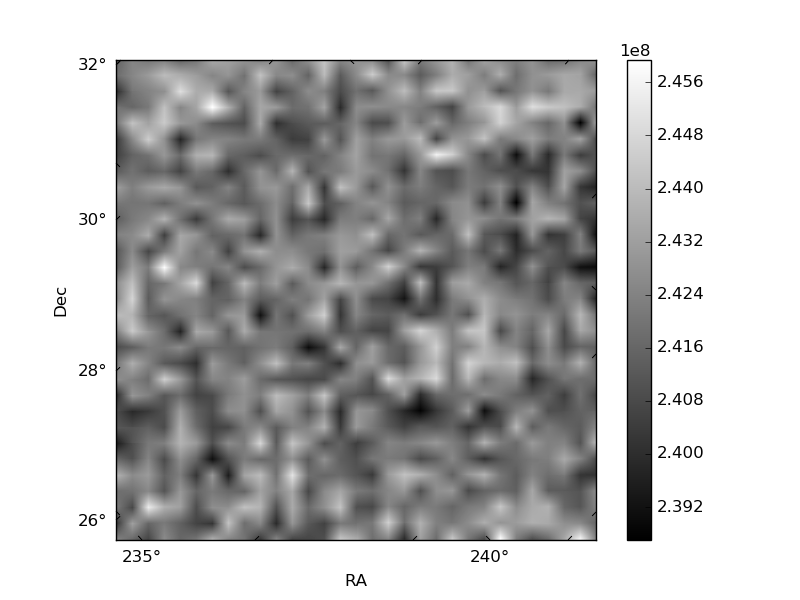
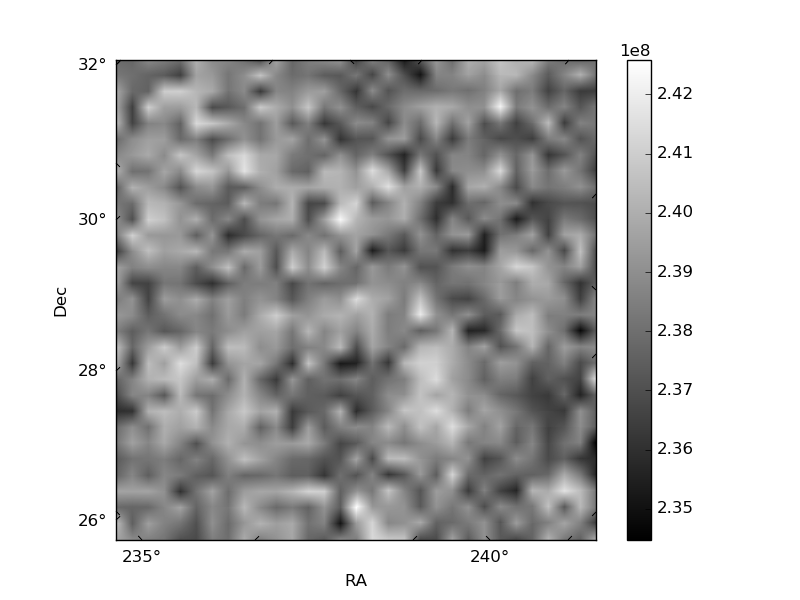
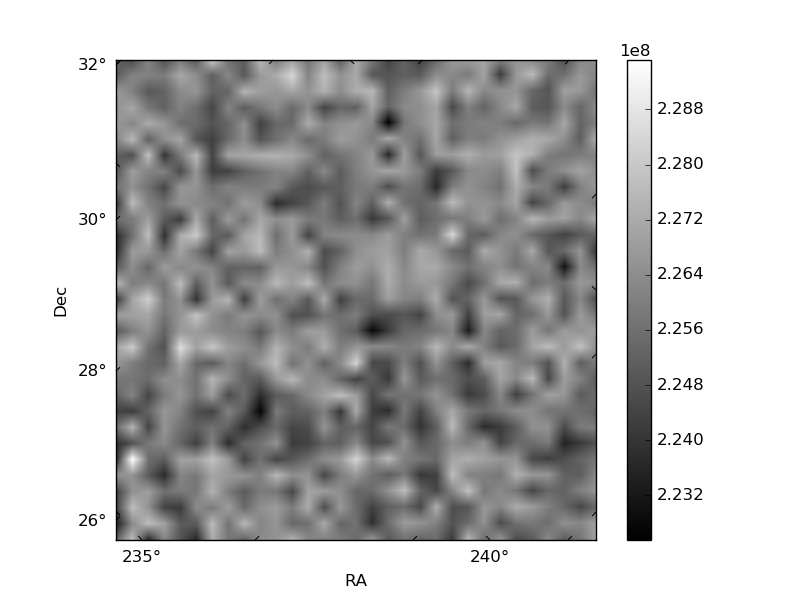
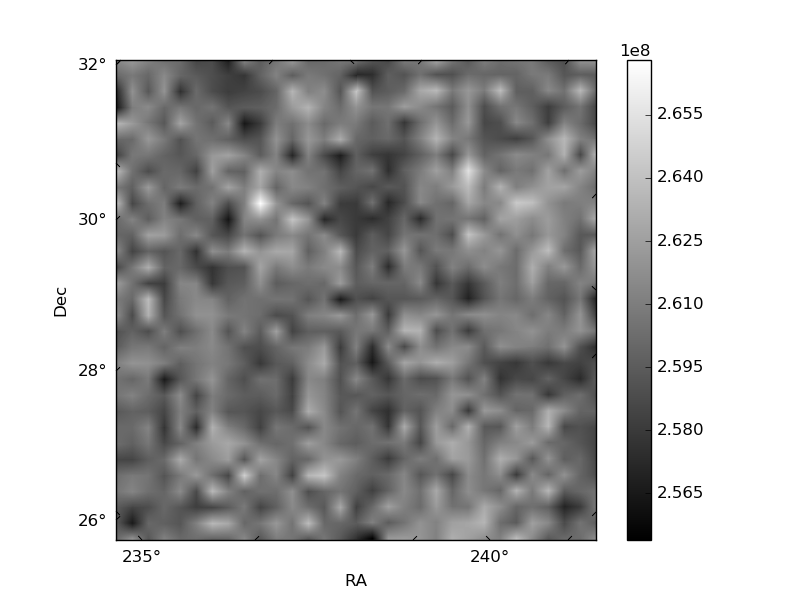
Histogram calculated using DETX and DETY for each event in the final _common_clean file
| Quadrant A | 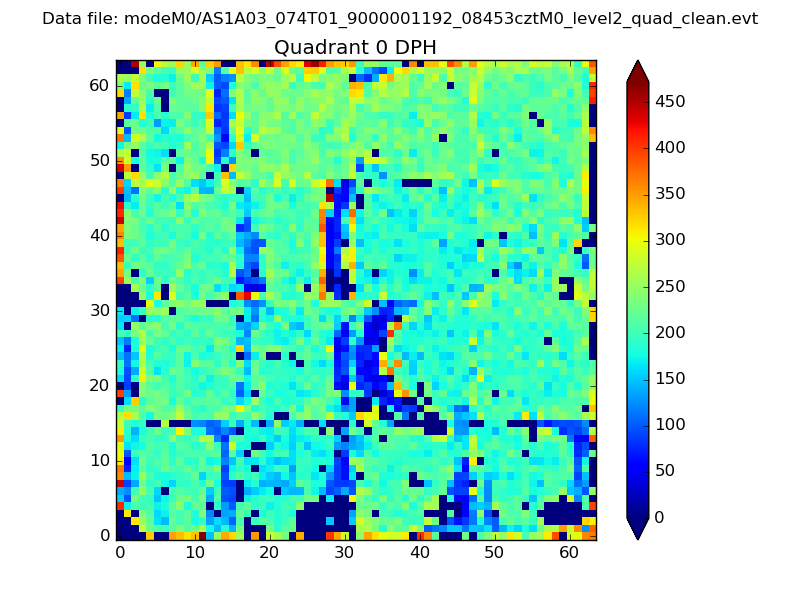 |
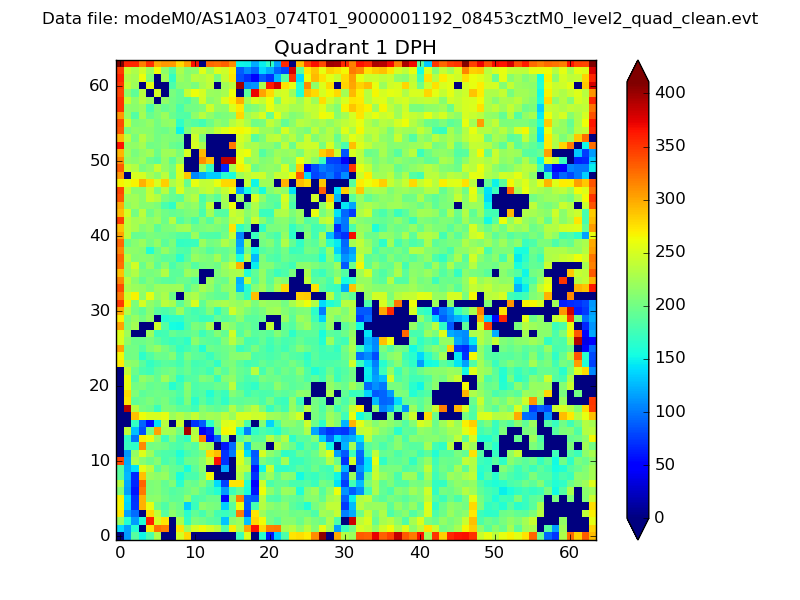 |
Quadrant B |
|---|---|---|---|
| Quadrant D | 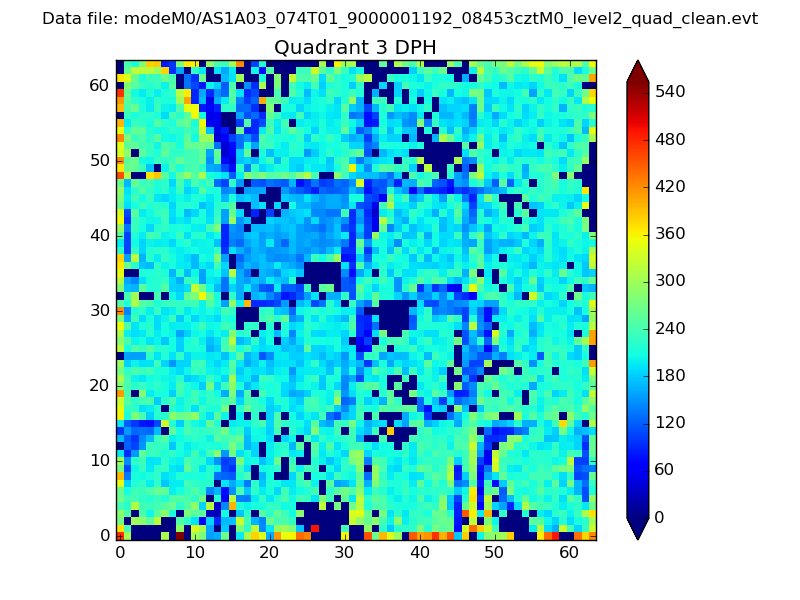 |
 |
Quadrant C |
| Plot type | Count rate plots | Images |
|---|---|---|
| Comparison with Poisson distribution Blue bars denote a histogram of data divided into 1 sec bins. Red curve is a Poisson curve with rate = median count rate of data. |
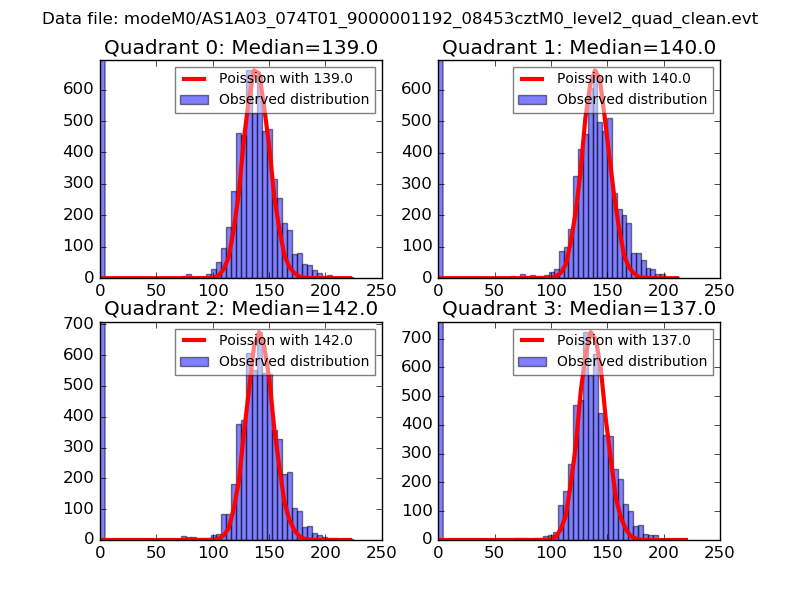 |
 |
| Quadrant-wise count rates Data is divided into 100 sec bins |
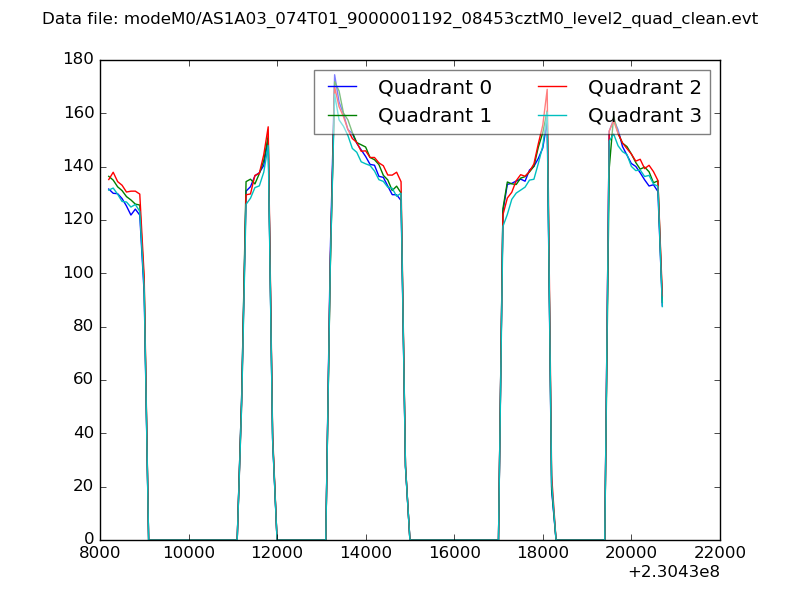 |
|
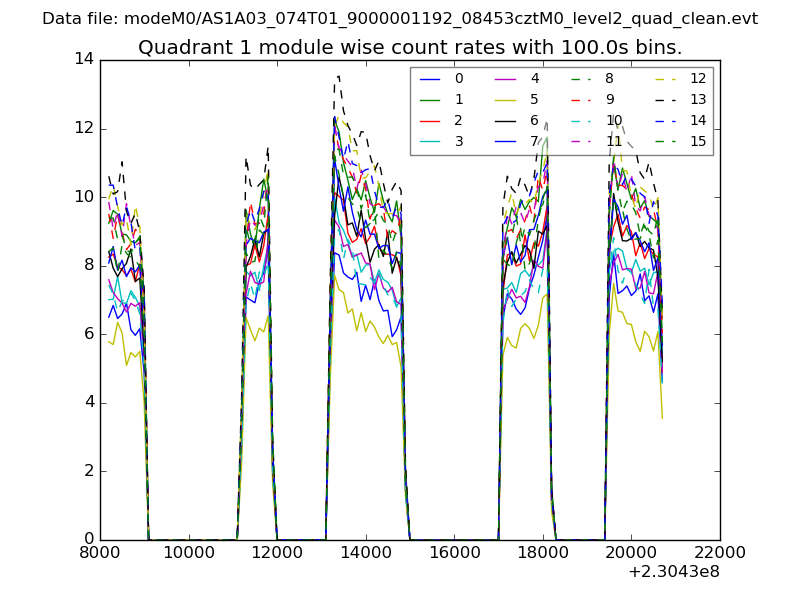
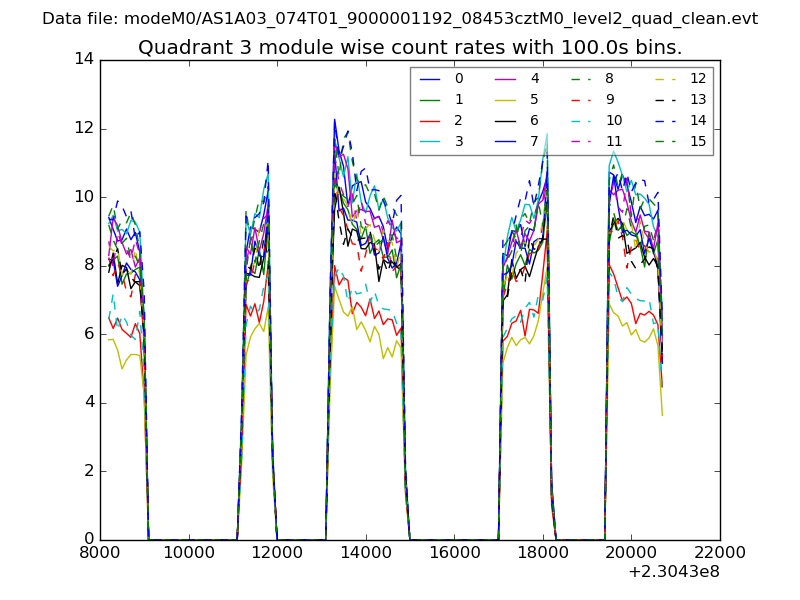
| Module-wise count rates for Quadrant A Data is divided into 100 sec bins |
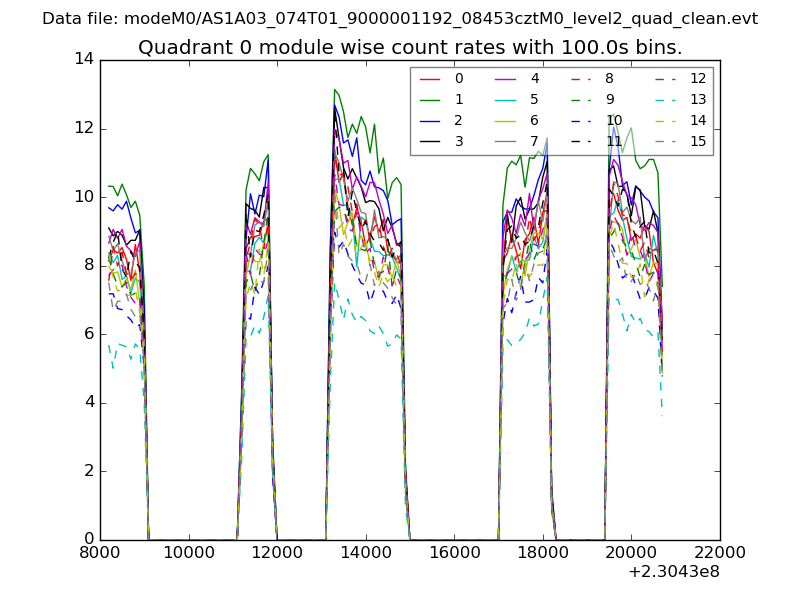 |
 |
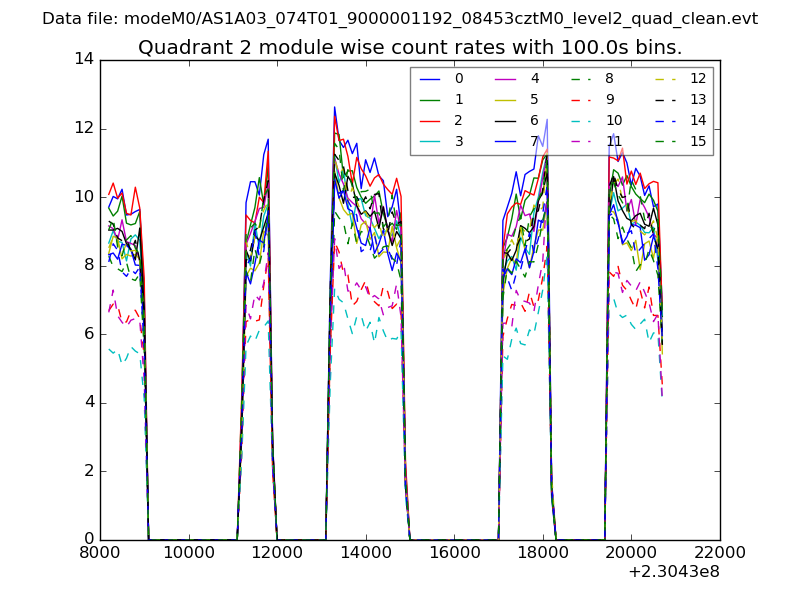
| Module-wise count rates for Quadrant B Data is divided into 100 sec bins |
 |
 |
| Module-wise count rates for Quadrant C Data is divided into 100 sec bins |
 |
 |
| Module-wise count rates for Quadrant D Data is divided into 100 sec bins |
 |
 |
| Parameter | Plot |
|---|---|
| CZT HV Monitor | 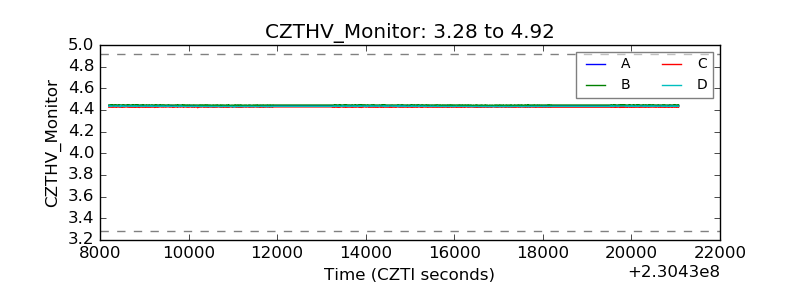 |
| D_VDD | 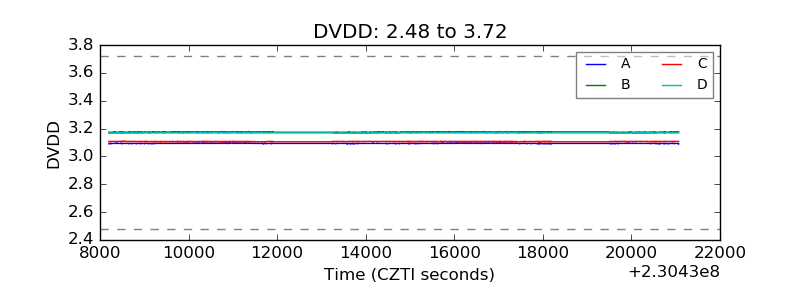 |
| Temperature 1 | 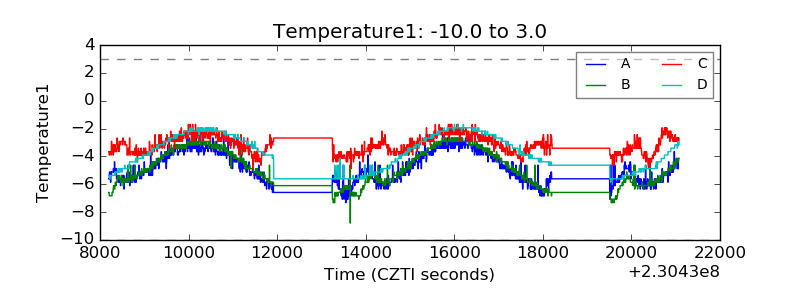 |
| Veto HV Monitor | 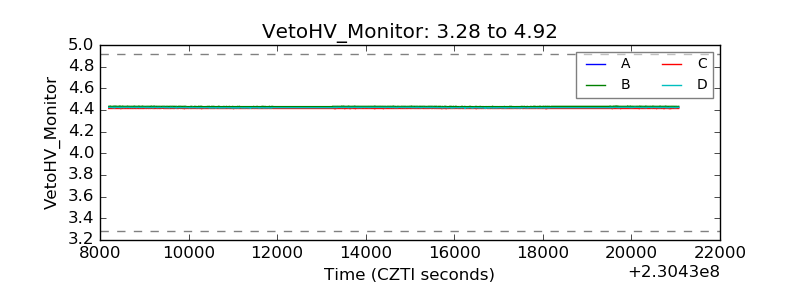 |
| Veto LLD | 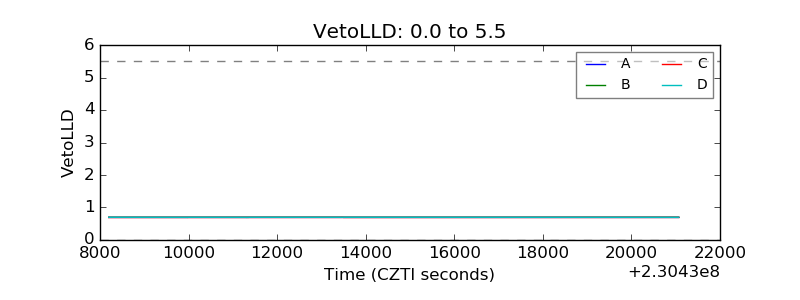 |
| Alpha Counter | 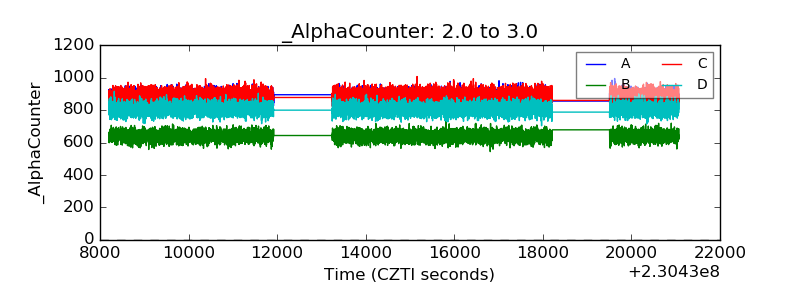 |
| _CPM_Rate | 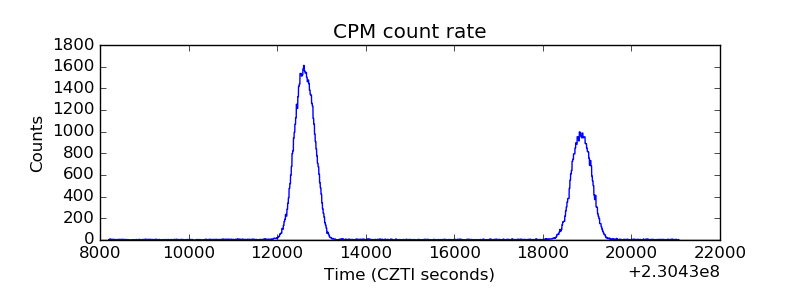 |
| CZT Counter | 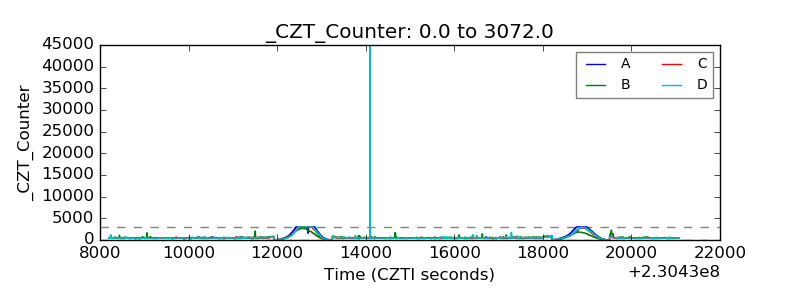 |
| +2.5 Volts monitor |  |
| +5 Volts monitor |  |
| _ROLL_ROT | 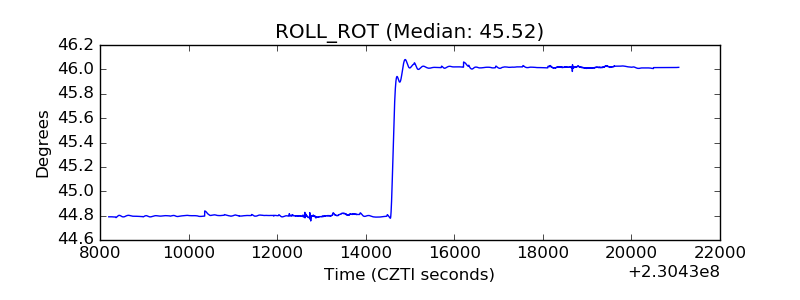 |
| _Roll_DEC | 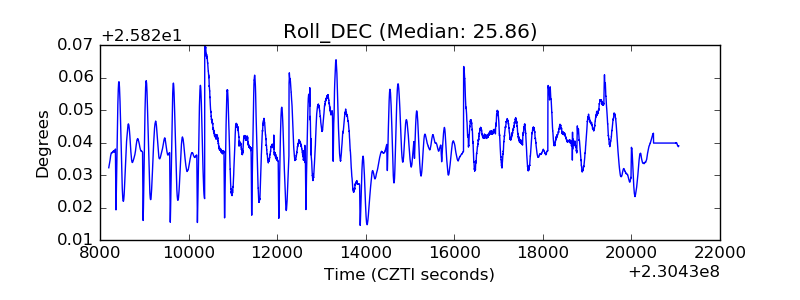 |
| _Roll_RA | 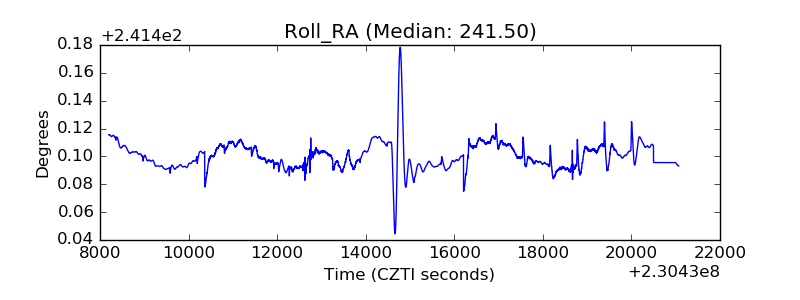 |
| Veto Counter | 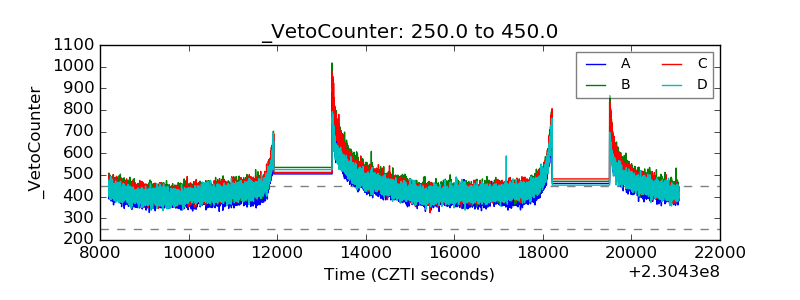 |