| Param | Original file | Final file |
|---|---|---|
| Filename | modeM0/AS1A03_074T01_9000001192_08454cztM0_level2.evt | modeM0/AS1A03_074T01_9000001192_08454cztM0_level2_quad_clean.evt |
| Size (bytes) | 457,076,160 | 83,977,920 |
| Size | 435.9 MB | 80.1 MB |
| Events in quadrant A | 3,226,048 | 515,701 |
| Events in quadrant B | 3,628,999 | 518,872 |
| Events in quadrant C | 3,140,618 | 527,903 |
| Events in quadrant D | 3,390,373 | 512,313 |
| Mode SS | |||
|---|---|---|---|
| Quadrant | BADHDUFLAG | Total packets | Discarded packets |
| A | 0 | 134 | 0 |
| B | 0 | 134 | 0 |
| C | 0 | 134 | 0 |
| D | 0 | 134 | 0 |
| Mode M9 | |||
|---|---|---|---|
| Quadrant | BADHDUFLAG | Total packets | Discarded packets |
| A | 0 | 14 | 0 |
| B | 0 | 14 | 0 |
| C | 0 | 14 | 0 |
| D | 0 | 15 | 0 |
| Mode M0 | |||
|---|---|---|---|
| Quadrant | BADHDUFLAG | Total packets | Discarded packets |
| A | 0 | 13815 | 3 |
| B | 0 | 14950 | 2 |
| C | 0 | 13816 | 2 |
| D | 0 | 14617 | 2 |
| Quadrant | Total seconds | Saturated seconds | Saturation percentage |
|---|---|---|---|
| A | 6723 | 85 | 1.264317% |
| B | 6723 | 156 | 2.320393% |
| C | 6723 | 38 | 0.565224% |
| D | 6723 | 68 | 1.011453% |
Noise dominated data is calculated using 1-second bins in cleaned event files. If a bin has >2000 counts, and if more than 50% of those come from <1% of pixels, then it is considered to be noise-dominated and hence unusable.
| Quadrant | # 1 sec bins | Bins with >0 counts | Bins with >2000 counts | High rate bins dominated by noise | Noise dominated (total time) | Noise dominated (detector-on time) | Marked lightcurve |
|---|---|---|---|---|---|---|---|
| A | 7878 | 6724 | 0 | 0 | 0.00% | 0.00% | 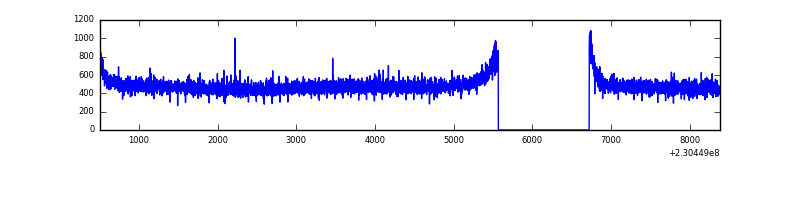 |
| B | 7878 | 6723 | 38 | 38 | 0.48% | 0.57% |  |
| C | 7878 | 6724 | 0 | 0 | 0.00% | 0.00% | 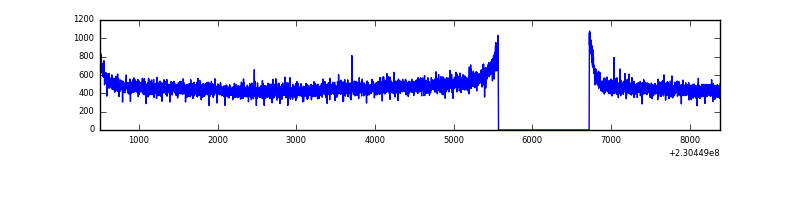 |
| D | 7878 | 6724 | 12 | 12 | 0.15% | 0.18% |  |
Top three noisy pixels from each quadrant. If the there are fewer than three noisy pixels in the level2.evt file, extra rows are filled as -1
| Pixel properties | Quadrant properties | ||||||
|---|---|---|---|---|---|---|---|
| Quadrant | DetID | PixID | Counts | Sigma | Mean | Median | Sigma |
| A | 0 | 226 | 7832 | 41.38 | 837 | 819 | 169.5 |
| A | 12 | 194 | 7479 | 39.3 | 837 | 819 | 169.5 |
| A | 13 | 251 | 5972 | 30.41 | 837 | 819 | 169.5 |
| B | 5 | 255 | 178496 | 1113.28 | 832 | 812 | 159.6 |
| B | 4 | 48 | 57158 | 353.04 | 832 | 812 | 159.6 |
| B | 11 | 51 | 52736 | 325.33 | 832 | 812 | 159.6 |
| C | 13 | 61 | 6124 | 28.6 | 805 | 809 | 185.8 |
| C | 8 | 222 | 3243 | 13.1 | 805 | 809 | 185.8 |
| C | 3 | 202 | 2020 | 6.52 | 805 | 809 | 185.8 |
| D | 1 | 52 | 227832 | 1176.1 | 809 | 788 | 193.0 |
| D | 7 | 71 | 33414 | 169.0 | 809 | 788 | 193.0 |
| D | 14 | 34 | 21709 | 108.37 | 809 | 788 | 193.0 |
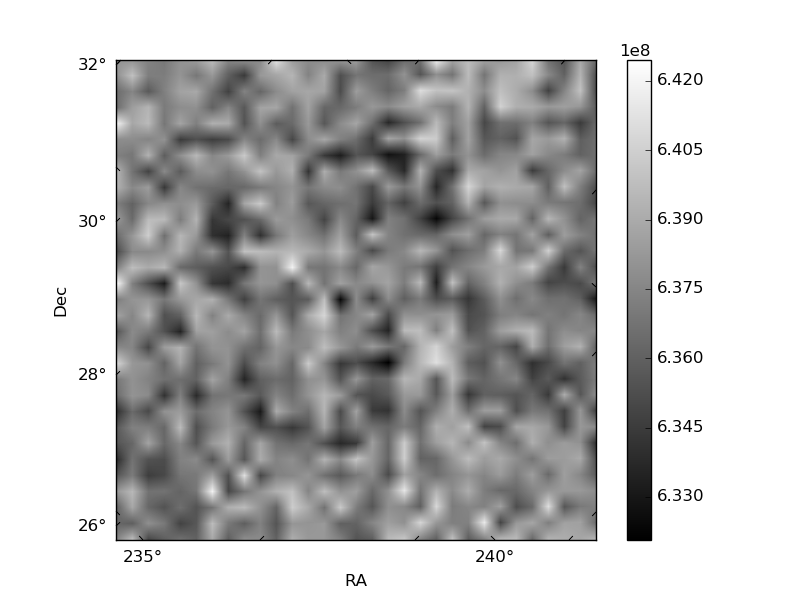
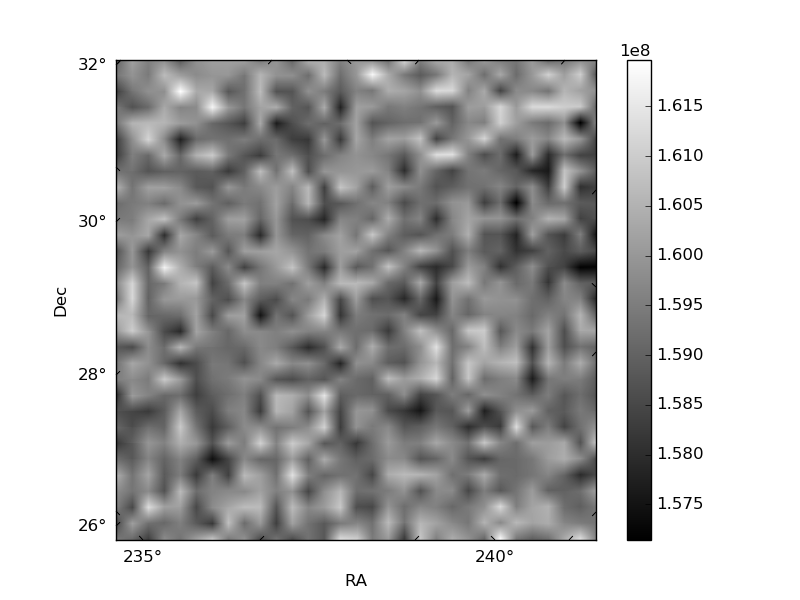
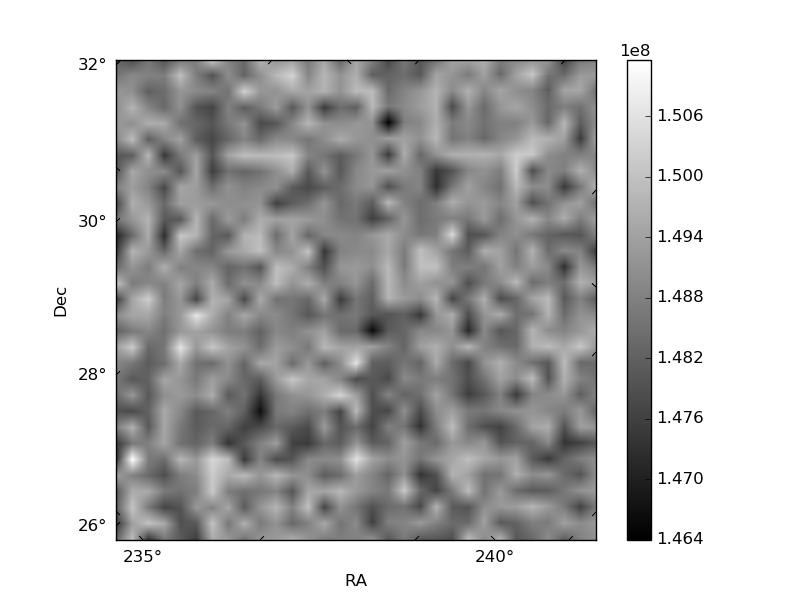
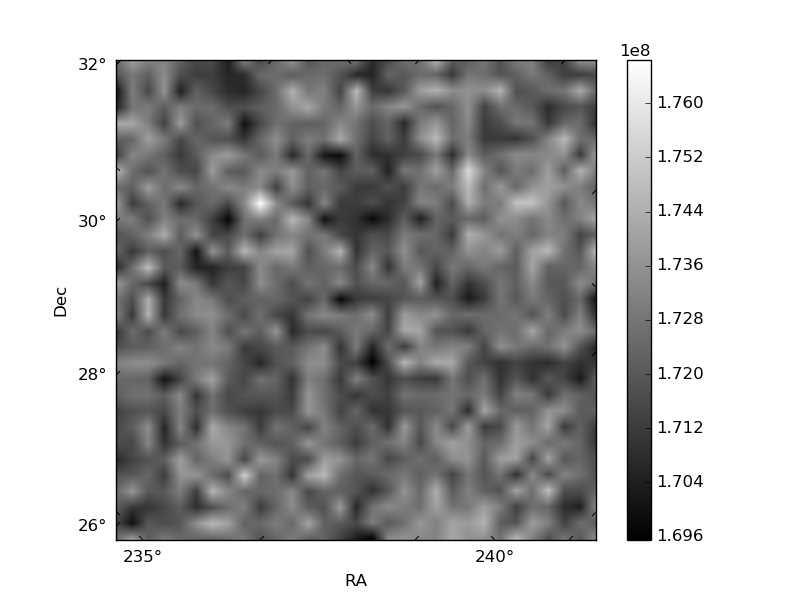
Histogram calculated using DETX and DETY for each event in the final _common_clean file
| Quadrant A | 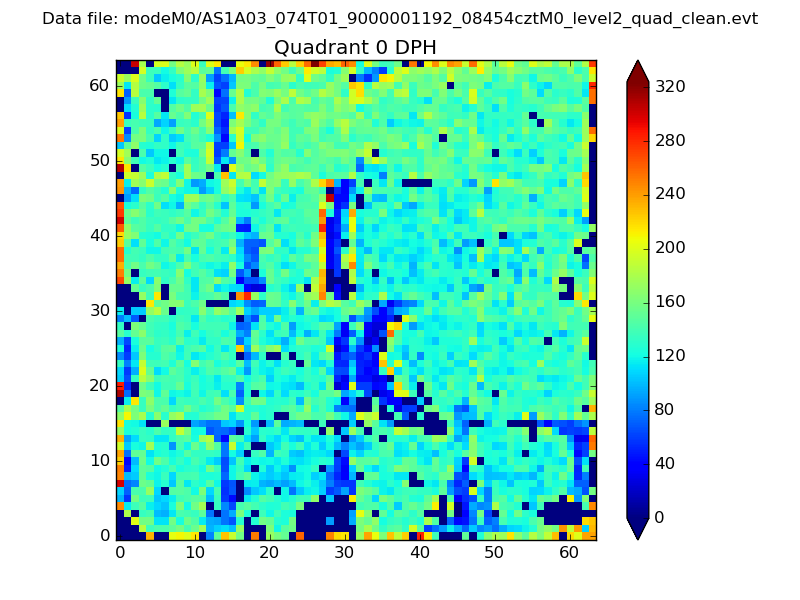 |
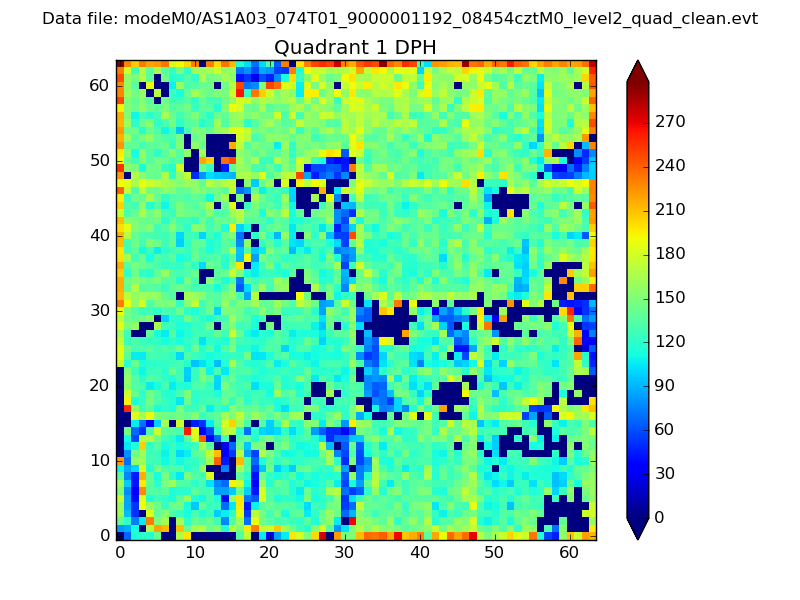 |
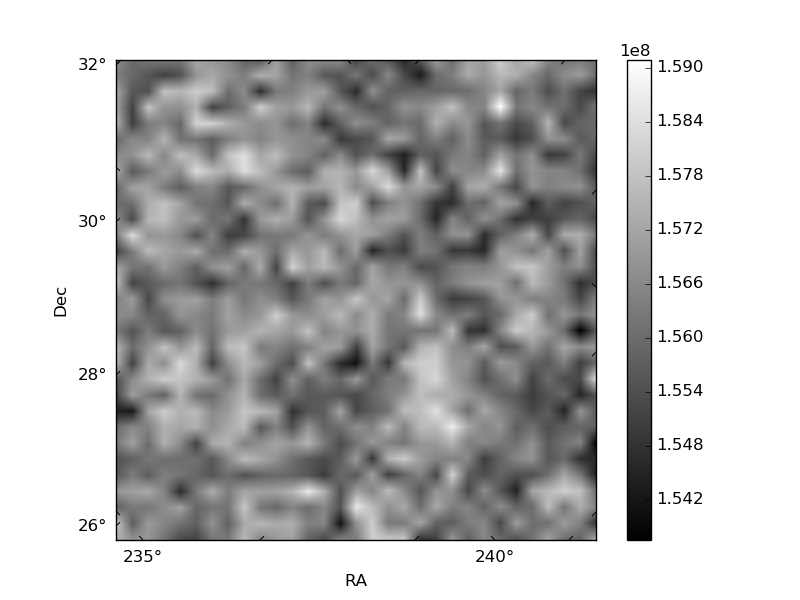
Quadrant B |
|---|---|---|---|
| Quadrant D |  |
 |
Quadrant C |
| Plot type | Count rate plots | Images |
|---|---|---|
| Comparison with Poisson distribution Blue bars denote a histogram of data divided into 1 sec bins. Red curve is a Poisson curve with rate = median count rate of data. |
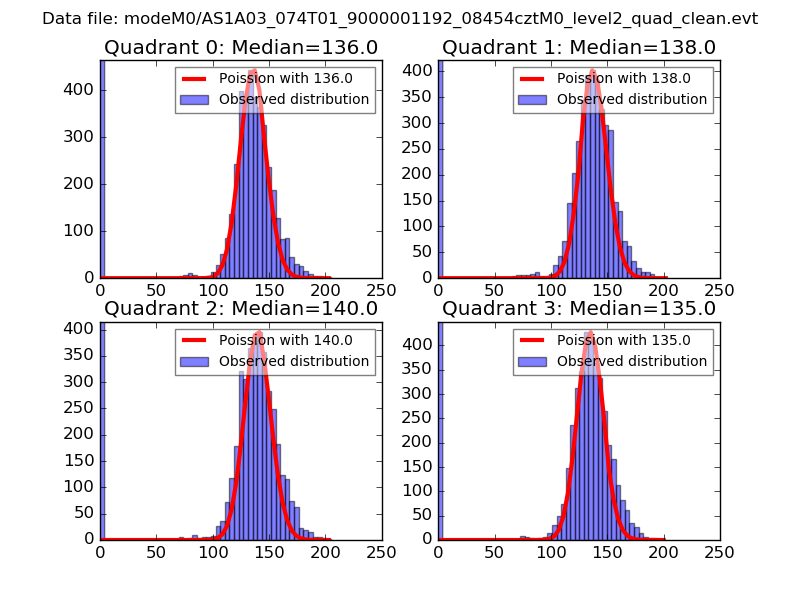 |
 |
| Quadrant-wise count rates Data is divided into 100 sec bins |
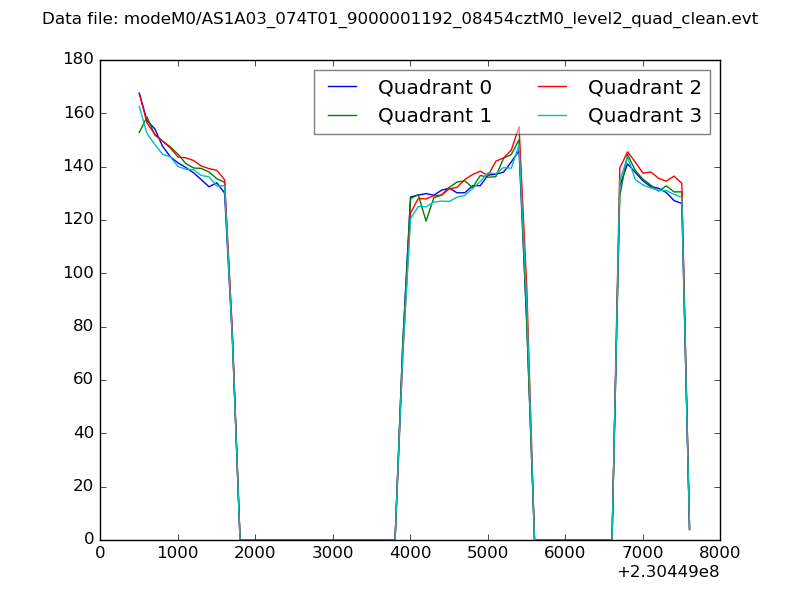 |
|
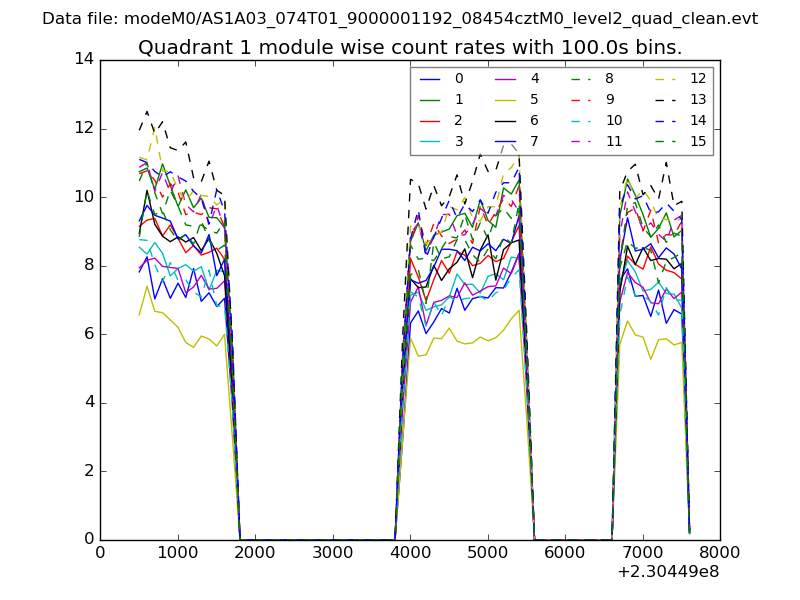
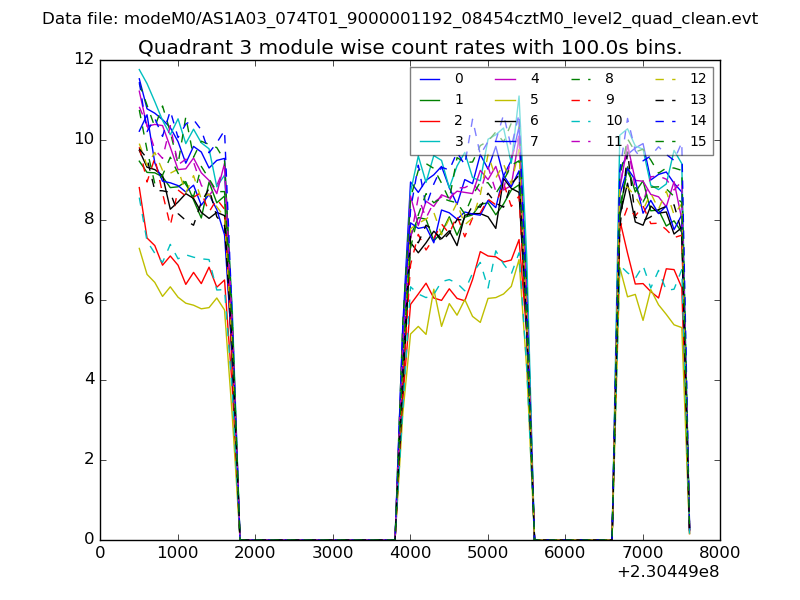
| Module-wise count rates for Quadrant A Data is divided into 100 sec bins |
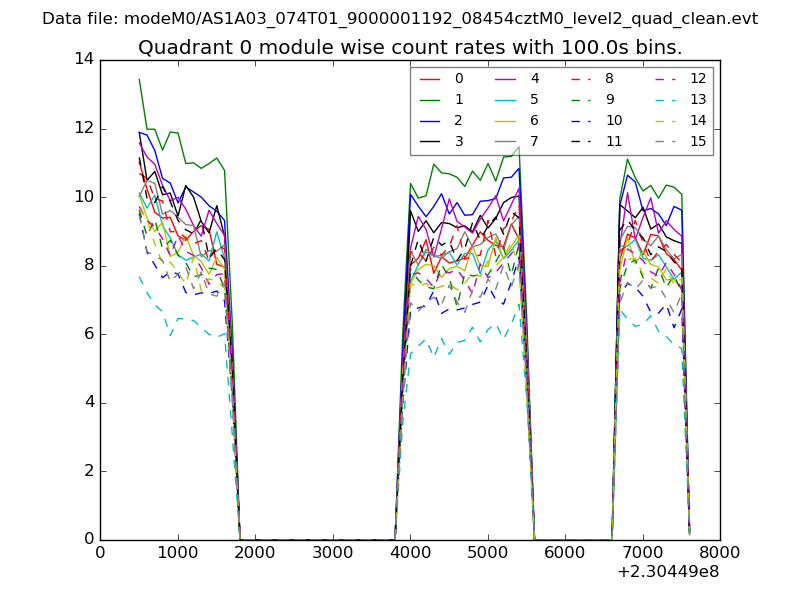 |
 |
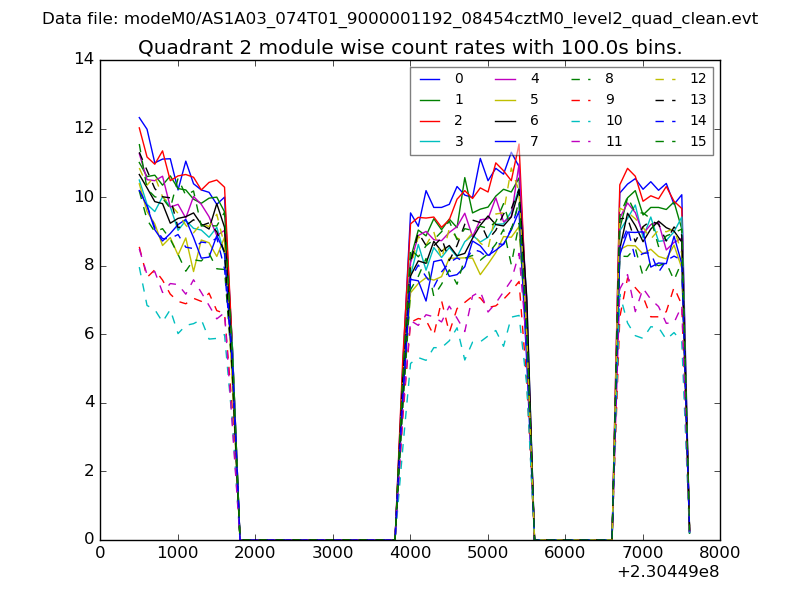
| Module-wise count rates for Quadrant B Data is divided into 100 sec bins |
 |
 |
| Module-wise count rates for Quadrant C Data is divided into 100 sec bins |
 |
 |
| Module-wise count rates for Quadrant D Data is divided into 100 sec bins |
 |
 |
| Parameter | Plot |
|---|---|
| CZT HV Monitor | 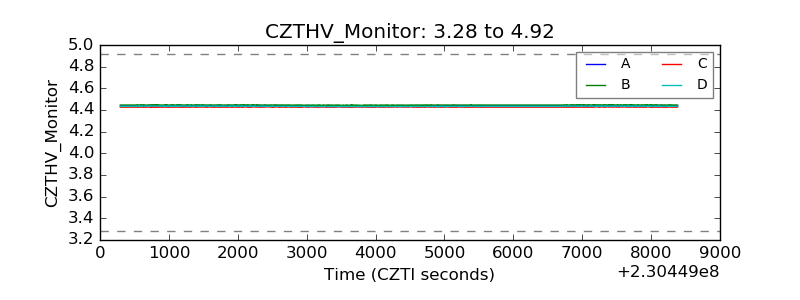 |
| D_VDD | 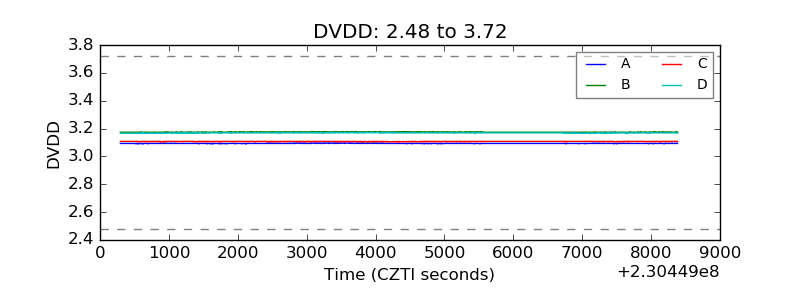 |
| Temperature 1 | 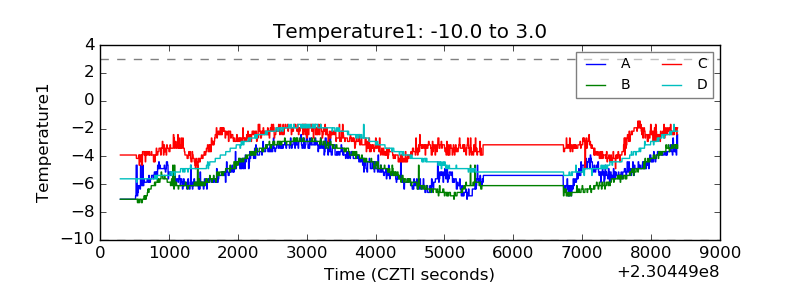 |
| Veto HV Monitor | 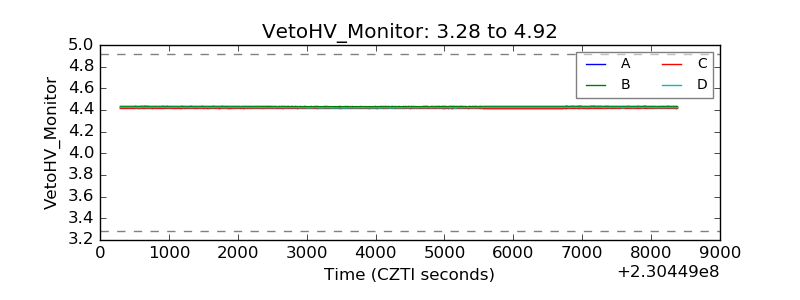 |
| Veto LLD | 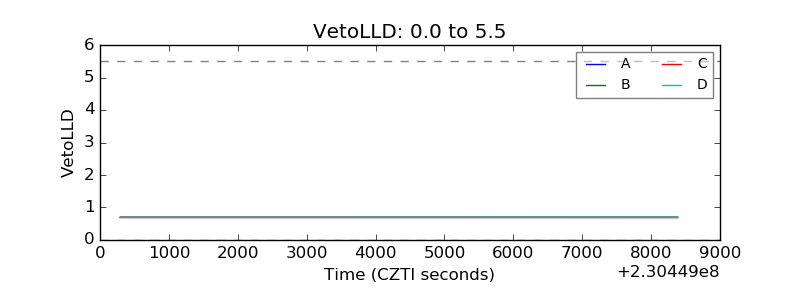 |
| Alpha Counter | 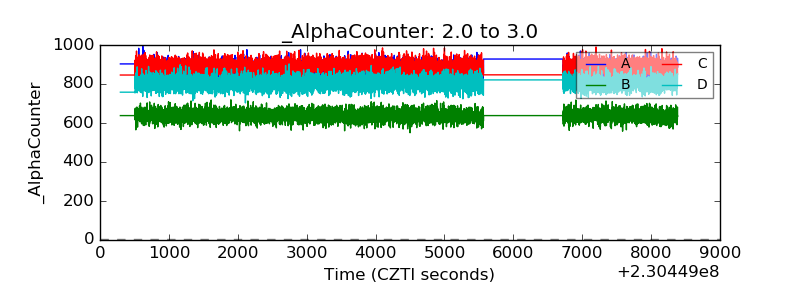 |
| _CPM_Rate | 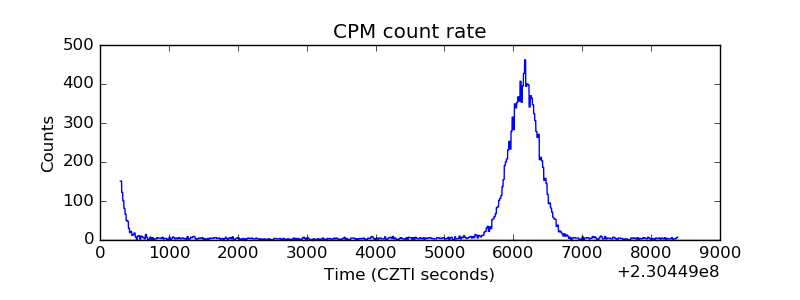 |
| CZT Counter |  |
| +2.5 Volts monitor |  |
| +5 Volts monitor |  |
| _ROLL_ROT | 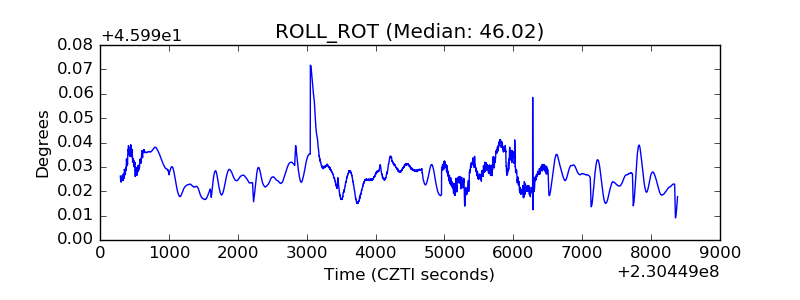 |
| _Roll_DEC | 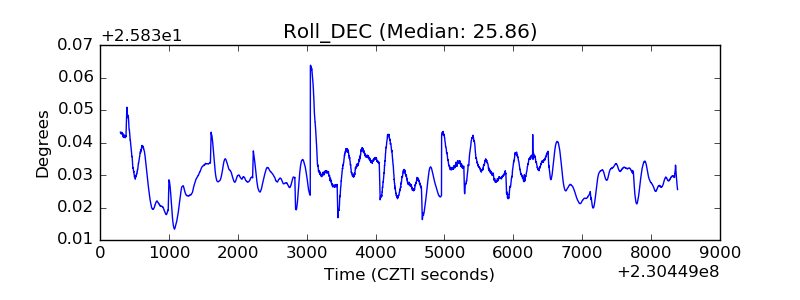 |
| _Roll_RA | 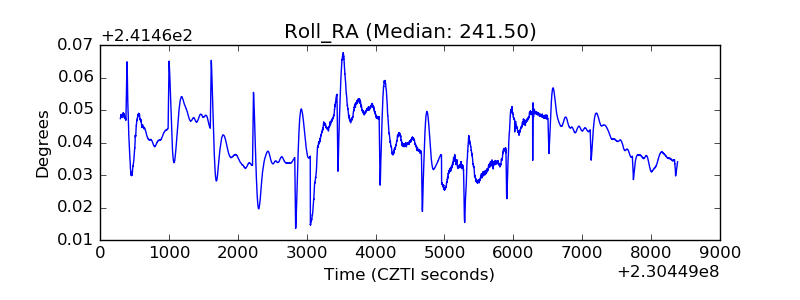 |
| Veto Counter | 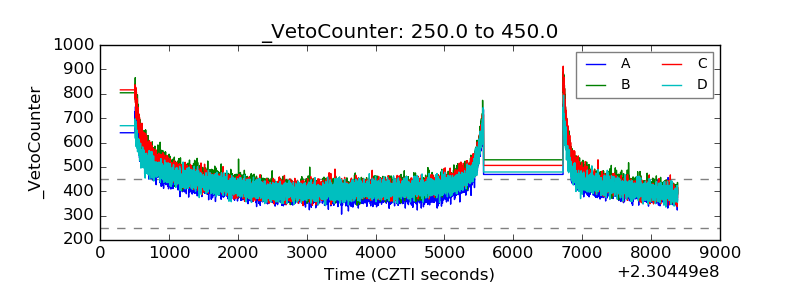 |