| Param | Original file | Final file |
|---|---|---|
| Filename | modeM0/AS1A03_074T01_9000001192_08456cztM0_level2.evt | modeM0/AS1A03_074T01_9000001192_08456cztM0_level2_quad_clean.evt |
| Size (bytes) | 411,163,200 | 68,797,440 |
| Size | 392.1 MB | 65.6 MB |
| Events in quadrant A | 2,916,840 | 409,655 |
| Events in quadrant B | 3,162,629 | 412,893 |
| Events in quadrant C | 2,839,460 | 425,164 |
| Events in quadrant D | 3,113,415 | 405,721 |
| Mode SS | |||
|---|---|---|---|
| Quadrant | BADHDUFLAG | Total packets | Discarded packets |
| A | 0 | 150 | 26 |
| B | 0 | 150 | 14 |
| C | 0 | 150 | 18 |
| D | 0 | 150 | 18 |
| Mode M9 | |||
|---|---|---|---|
| Quadrant | BADHDUFLAG | Total packets | Discarded packets |
| A | 0 | 7 | 2 |
| B | 0 | 7 | 2 |
| C | 0 | 7 | 1 |
| D | 0 | 8 | 0 |
| Mode M0 | |||
|---|---|---|---|
| Quadrant | BADHDUFLAG | Total packets | Discarded packets |
| A | 0 | 15408 | 2619 |
| B | 0 | 16172 | 2848 |
| C | 0 | 15276 | 2524 |
| D | 0 | 16406 | 2991 |
| Quadrant | Total seconds | Saturated seconds | Saturation percentage |
|---|---|---|---|
| A | 6148 | 129 | 2.098243% |
| B | 6097 | 149 | 2.443825% |
| C | 6175 | 85 | 1.376518% |
| D | 6092 | 134 | 2.199606% |
Noise dominated data is calculated using 1-second bins in cleaned event files. If a bin has >2000 counts, and if more than 50% of those come from <1% of pixels, then it is considered to be noise-dominated and hence unusable.
| Quadrant | # 1 sec bins | Bins with >0 counts | Bins with >2000 counts | High rate bins dominated by noise | Noise dominated (total time) | Noise dominated (detector-on time) | Marked lightcurve |
|---|---|---|---|---|---|---|---|
| A | 7692 | 6768 | 4 | 4 | 0.05% | 0.06% | 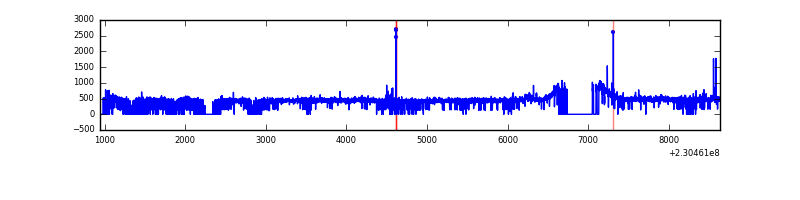 |
| B | 7676 | 6714 | 11 | 11 | 0.14% | 0.16% | 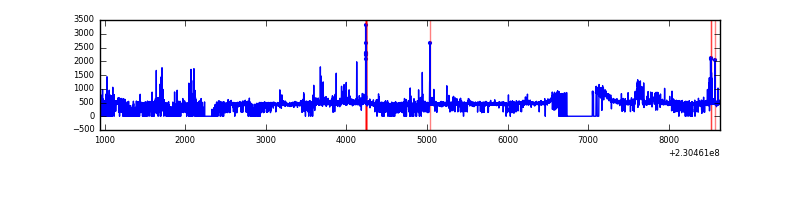 |
| C | 7664 | 6778 | 0 | 0 | 0.00% | 0.00% | 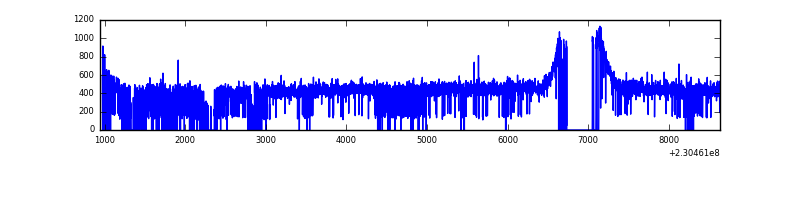 |
| D | 7694 | 6711 | 33 | 33 | 0.43% | 0.49% | 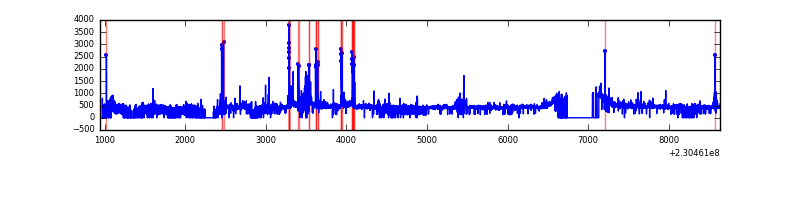 |
Top three noisy pixels from each quadrant. If the there are fewer than three noisy pixels in the level2.evt file, extra rows are filled as -1
| Pixel properties | Quadrant properties | ||||||
|---|---|---|---|---|---|---|---|
| Quadrant | DetID | PixID | Counts | Sigma | Mean | Median | Sigma |
| A | 13 | 251 | 36308 | 232.73 | 742 | 726 | 152.9 |
| A | 15 | 223 | 12437 | 76.6 | 742 | 726 | 152.9 |
| A | 0 | 226 | 7032 | 41.25 | 742 | 726 | 152.9 |
| B | 5 | 255 | 88820 | 613.06 | 734 | 714 | 143.7 |
| B | 11 | 51 | 75131 | 517.81 | 734 | 714 | 143.7 |
| B | 4 | 81 | 56178 | 385.93 | 734 | 714 | 143.7 |
| C | 13 | 61 | 5488 | 28.05 | 727 | 731 | 169.6 |
| C | 8 | 222 | 3053 | 13.69 | 727 | 731 | 169.6 |
| C | 3 | 202 | 1867 | 6.7 | 727 | 731 | 169.6 |
| D | 1 | 52 | 215685 | 1256.58 | 711 | 694 | 171.1 |
| D | 11 | 129 | 67581 | 390.94 | 711 | 694 | 171.1 |
| D | 2 | 152 | 64856 | 375.01 | 711 | 694 | 171.1 |
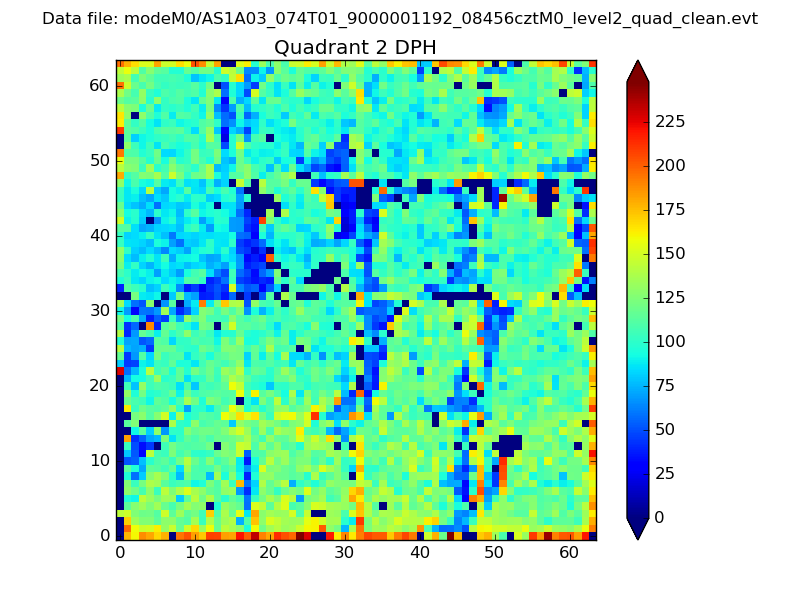
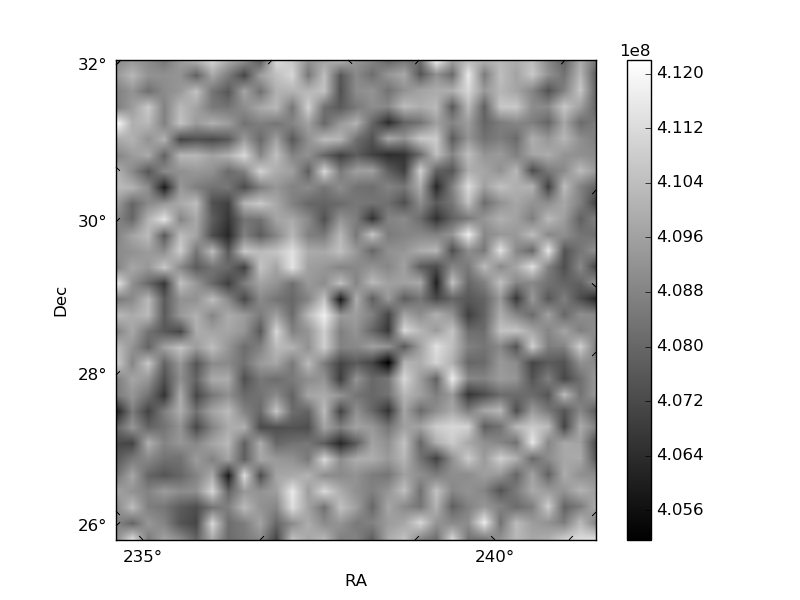
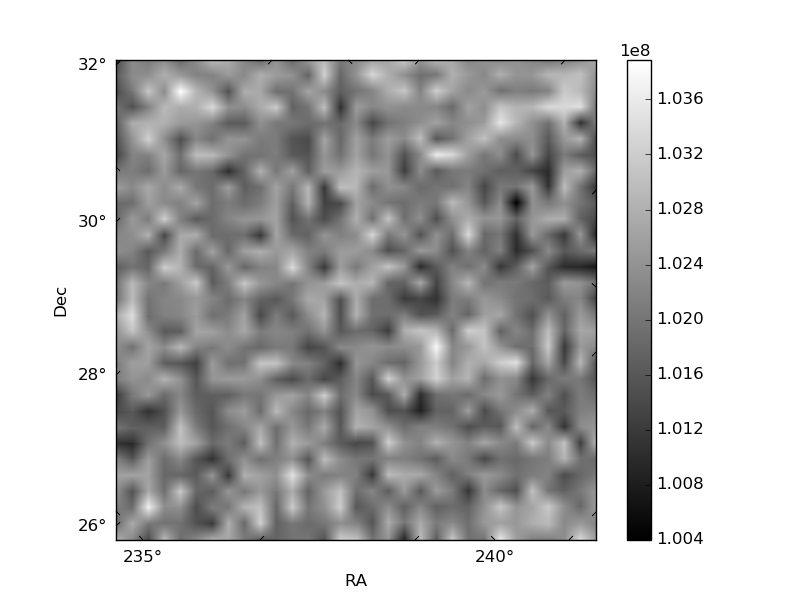
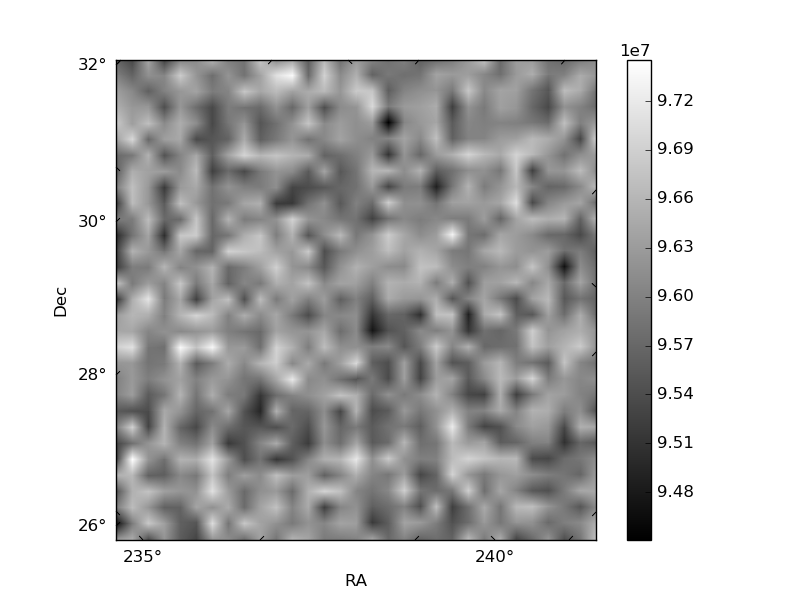
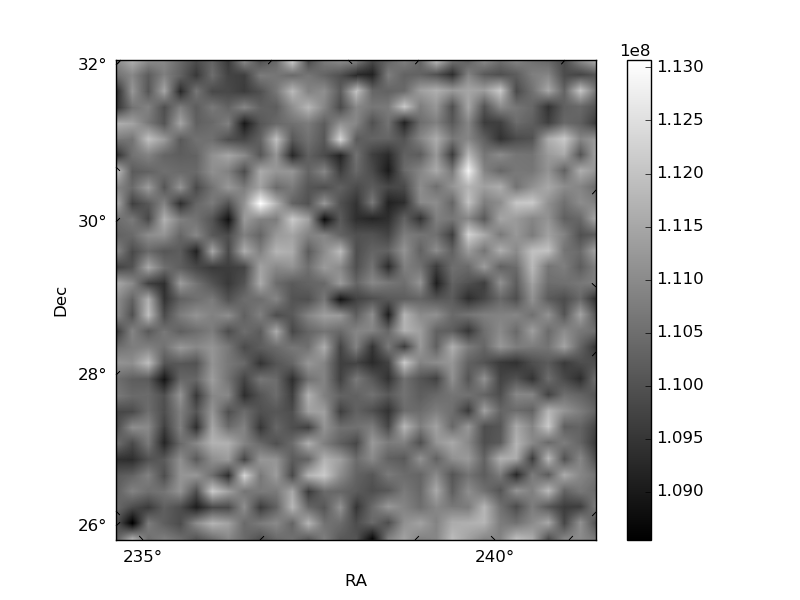
Histogram calculated using DETX and DETY for each event in the final _common_clean file
| Quadrant A | 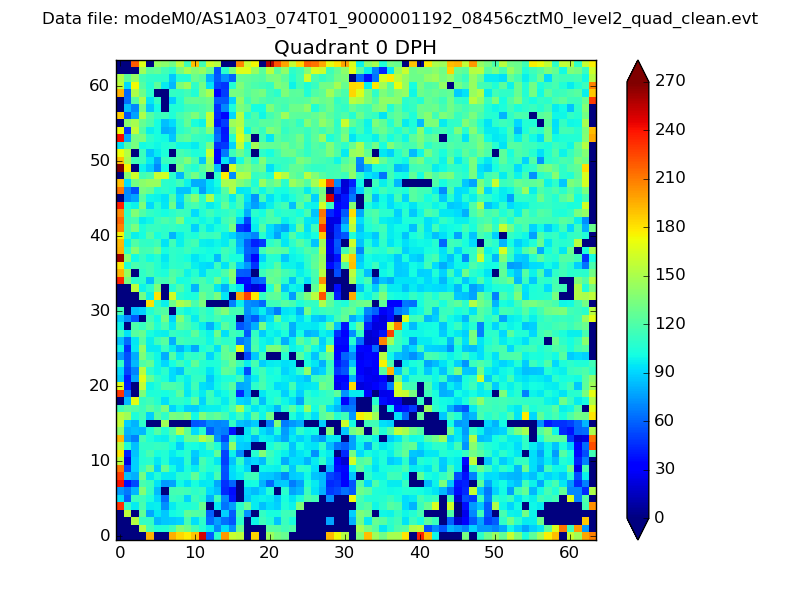 |
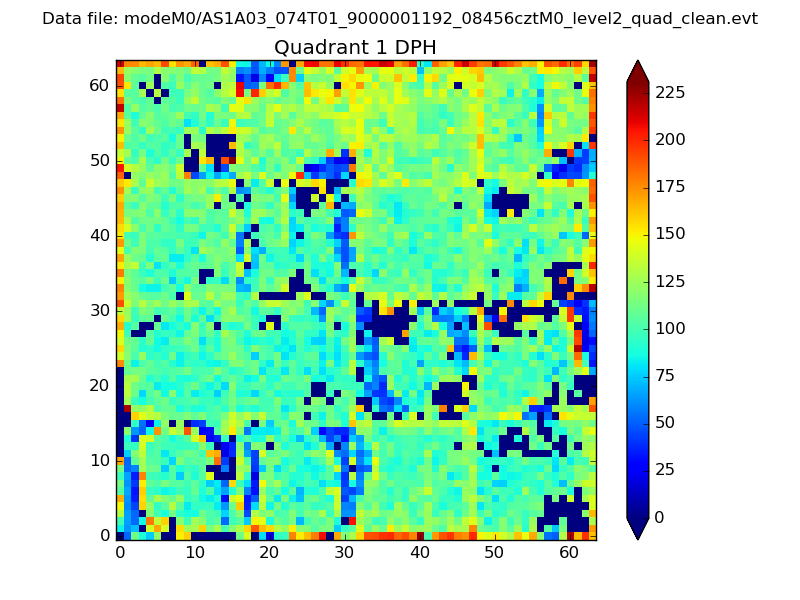 |
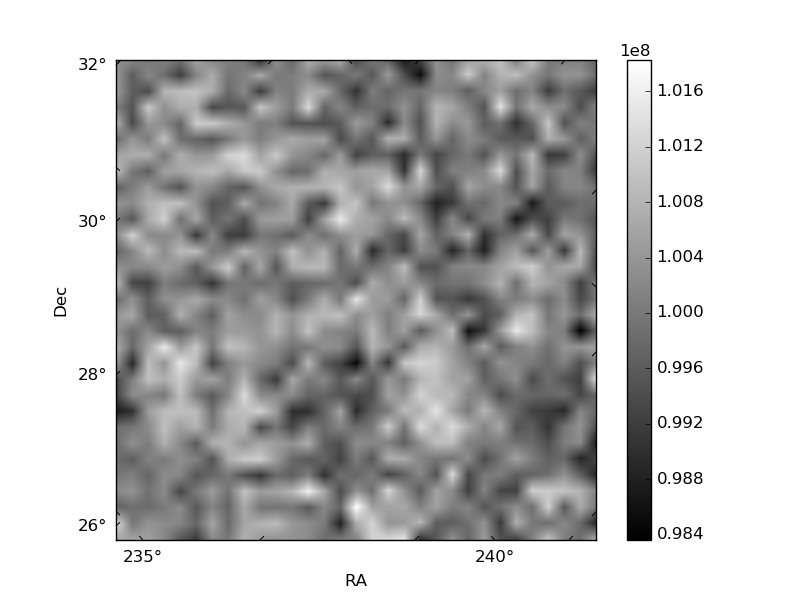
Quadrant B |
|---|---|---|---|
| Quadrant D | 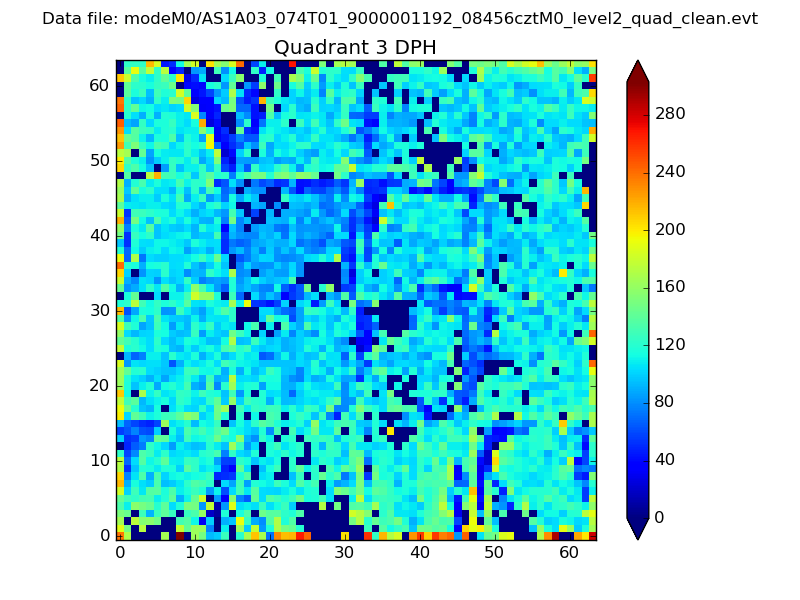 |
 |
Quadrant C |
| Plot type | Count rate plots | Images |
|---|---|---|
| Comparison with Poisson distribution Blue bars denote a histogram of data divided into 1 sec bins. Red curve is a Poisson curve with rate = median count rate of data. |
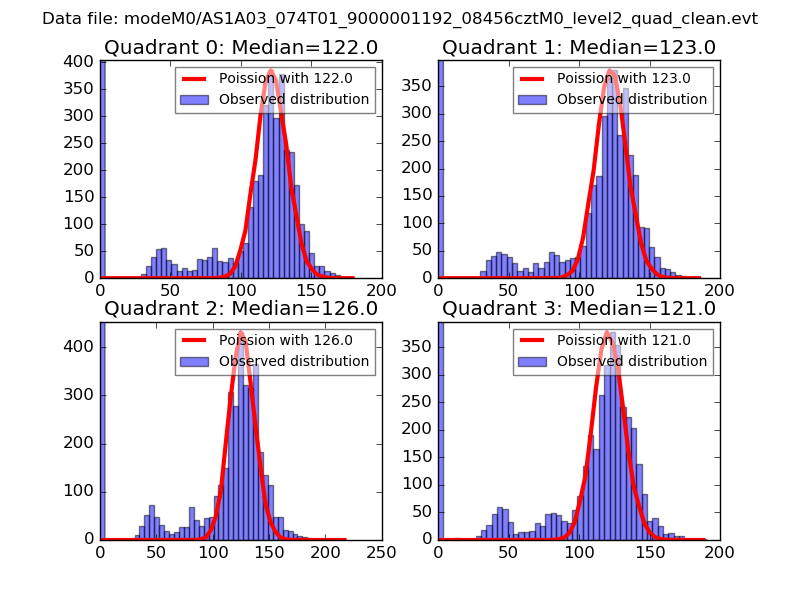 |
 |
| Quadrant-wise count rates Data is divided into 100 sec bins |
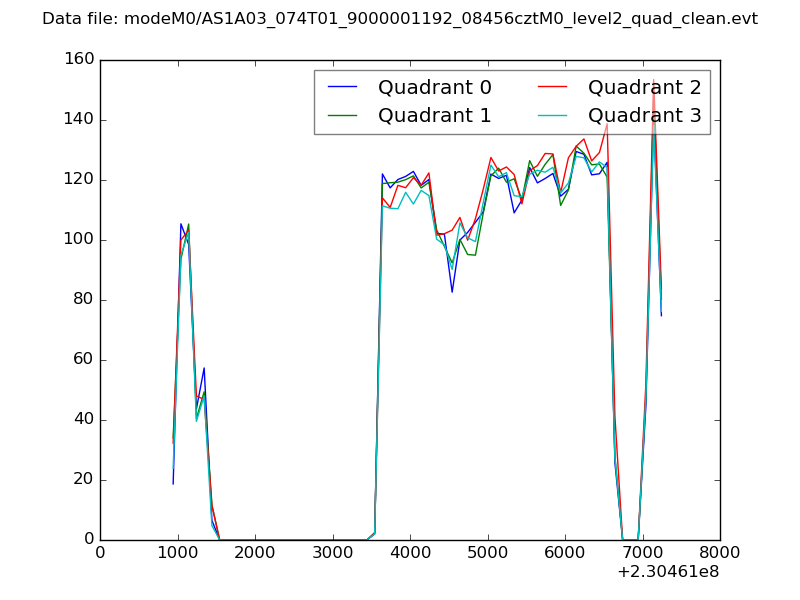 |
|
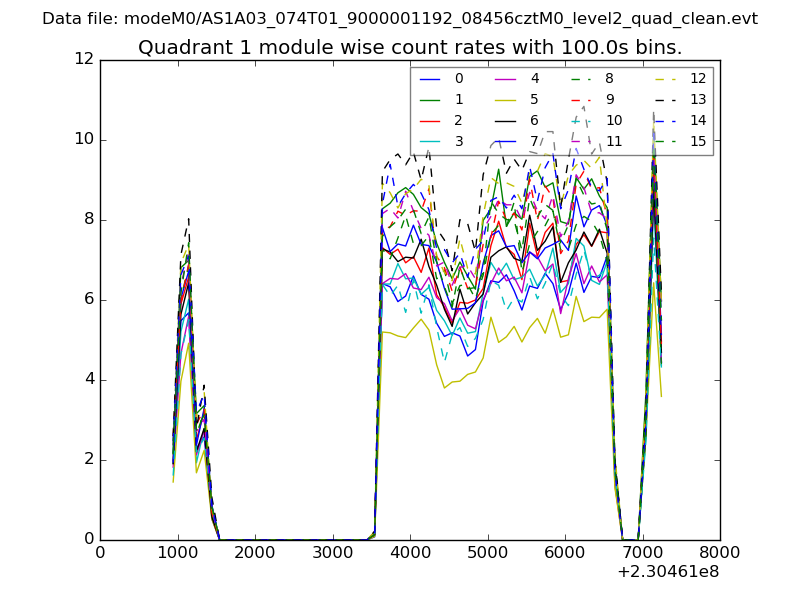
| Module-wise count rates for Quadrant A Data is divided into 100 sec bins |
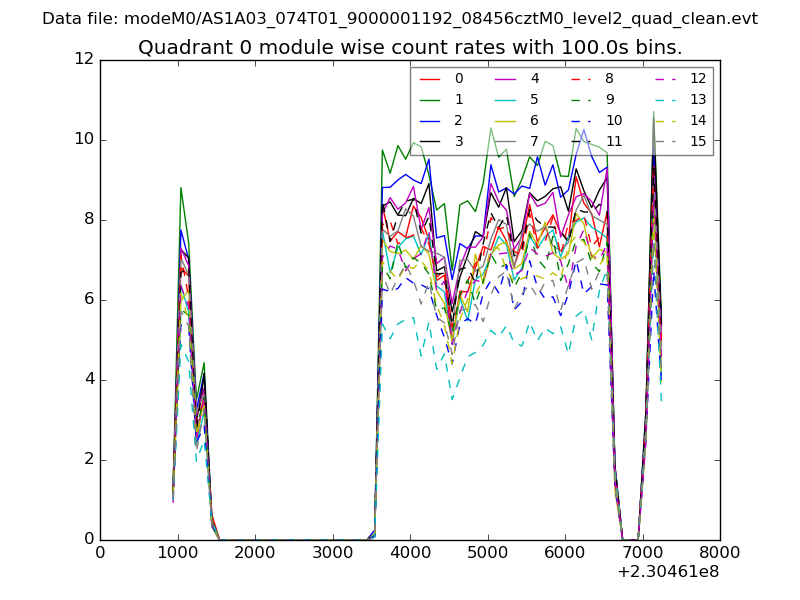 |
 |
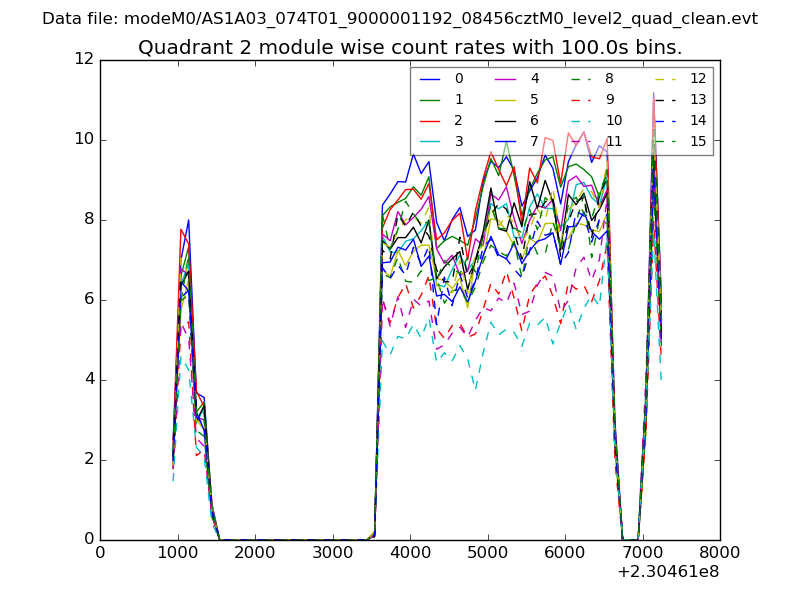
| Module-wise count rates for Quadrant B Data is divided into 100 sec bins |
 |
 |
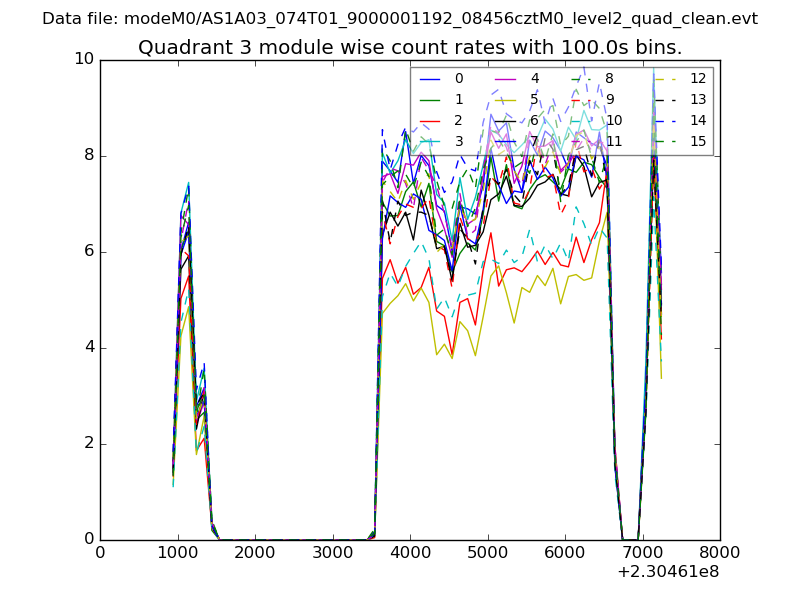
| Module-wise count rates for Quadrant C Data is divided into 100 sec bins |
 |
 |
| Module-wise count rates for Quadrant D Data is divided into 100 sec bins |
 |
 |
| Parameter | Plot |
|---|---|
| CZT HV Monitor | 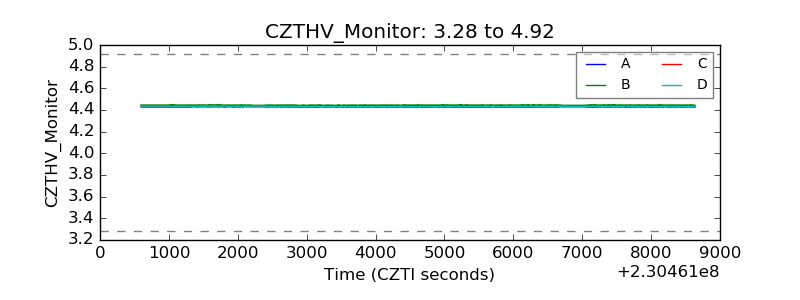 |
| D_VDD | 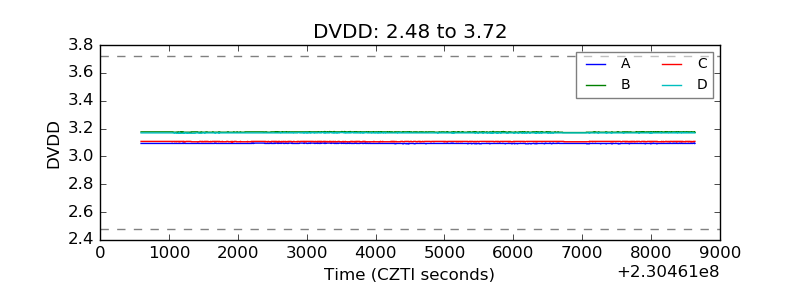 |
| Temperature 1 | 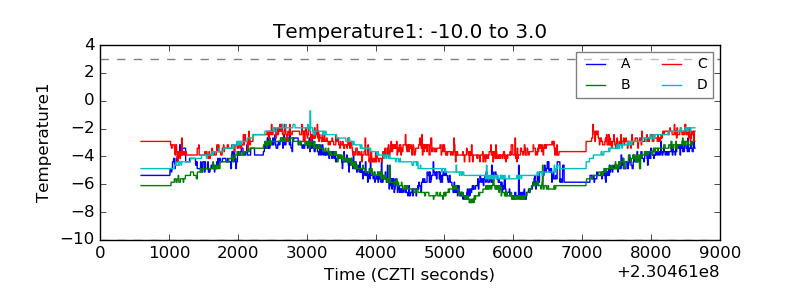 |
| Veto HV Monitor | 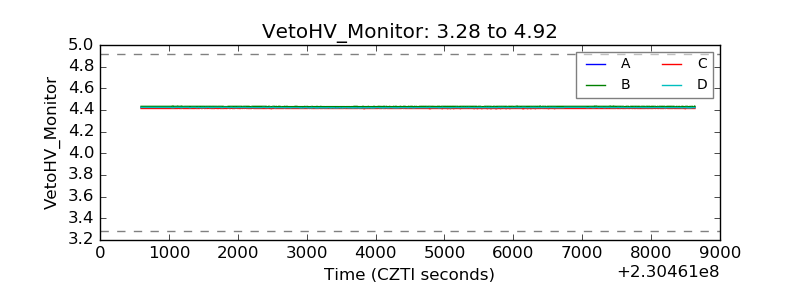 |
| Veto LLD | 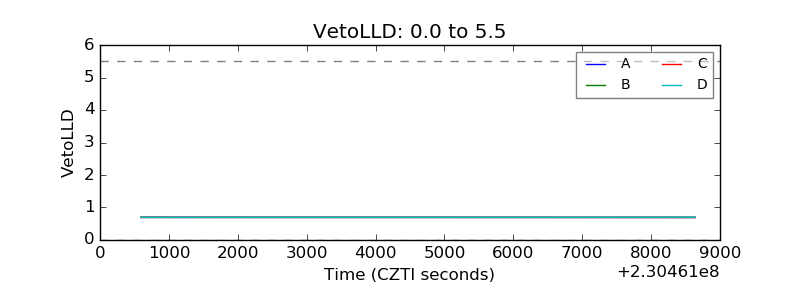 |
| Alpha Counter | 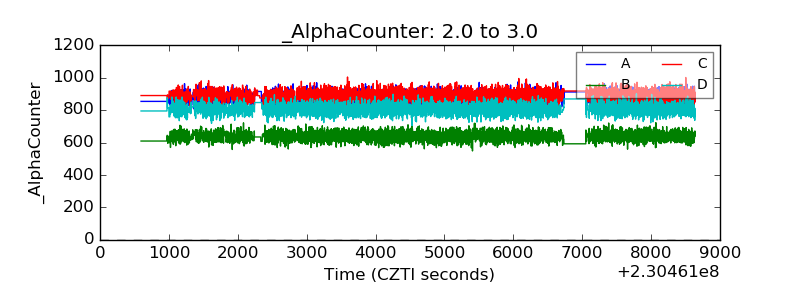 |
| _CPM_Rate | 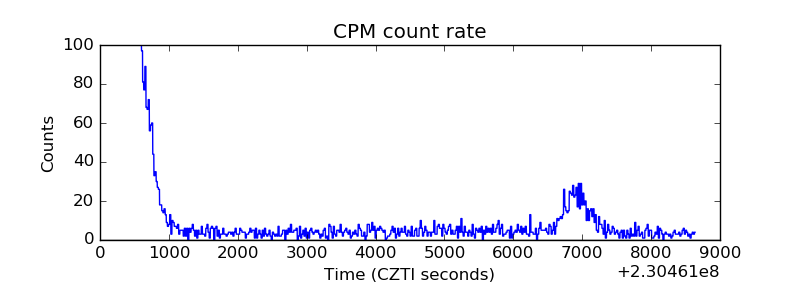 |
| CZT Counter | 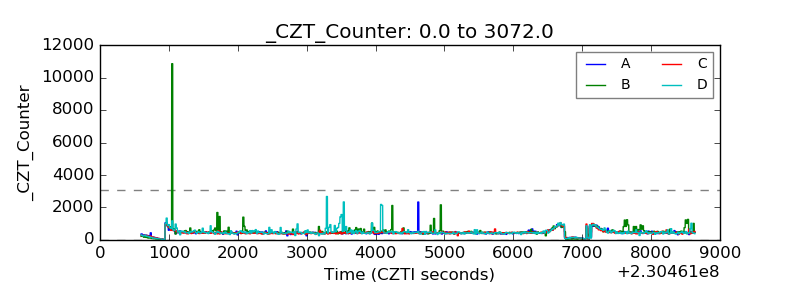 |
| +2.5 Volts monitor |  |
| +5 Volts monitor |  |
| _ROLL_ROT | 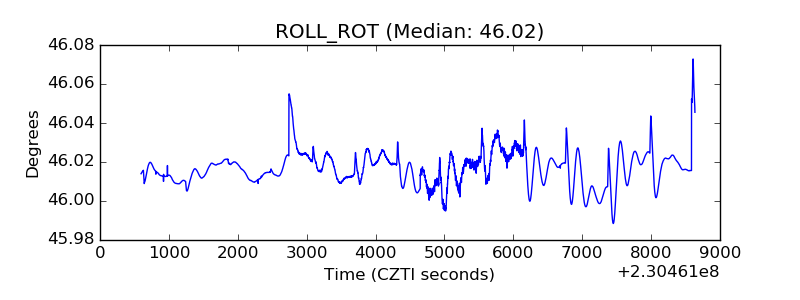 |
| _Roll_DEC | 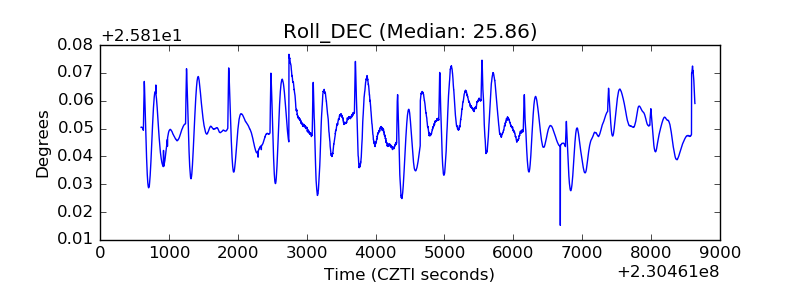 |
| _Roll_RA | 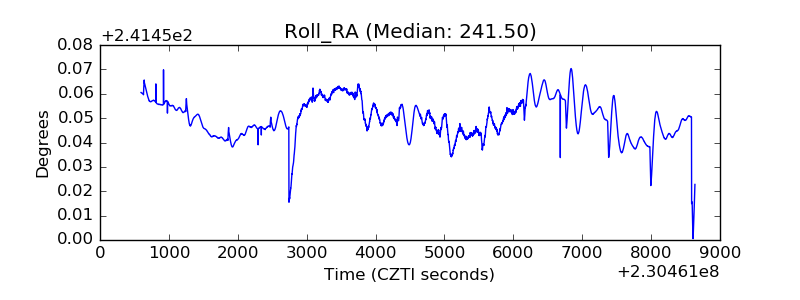 |
| Veto Counter |  |