| Param | Original file | Final file |
|---|---|---|
| Filename | modeM0/AS1A03_074T01_9000001192_08457cztM0_level2.evt | modeM0/AS1A03_074T01_9000001192_08457cztM0_level2_quad_clean.evt |
| Size (bytes) | 1,731,288,960 | 303,004,800 |
| Size | 1.6 GB | 289.0 MB |
| Events in quadrant A | 11,918,835 | 1,851,638 |
| Events in quadrant B | 13,120,573 | 1,866,753 |
| Events in quadrant C | 11,688,518 | 1,907,341 |
| Events in quadrant D | 14,021,115 | 1,837,922 |
| Mode SS | |||
|---|---|---|---|
| Quadrant | BADHDUFLAG | Total packets | Discarded packets |
| A | 0 | 508 | 0 |
| B | 0 | 508 | 0 |
| C | 0 | 508 | 0 |
| D | 0 | 508 | 0 |
| Mode M9 | |||
|---|---|---|---|
| Quadrant | BADHDUFLAG | Total packets | Discarded packets |
| A | 0 | 37 | 0 |
| B | 0 | 37 | 0 |
| C | 0 | 37 | 0 |
| D | 0 | 37 | 0 |
| Mode M0 | |||
|---|---|---|---|
| Quadrant | BADHDUFLAG | Total packets | Discarded packets |
| A | 0 | 51905 | 16 |
| B | 0 | 54844 | 15 |
| C | 0 | 51811 | 9 |
| D | 0 | 58444 | 21 |
| Quadrant | Total seconds | Saturated seconds | Saturation percentage |
|---|---|---|---|
| A | 24904 | 697 | 2.798747% |
| B | 24905 | 837 | 3.360771% |
| C | 24907 | 484 | 1.943229% |
| D | 24901 | 825 | 3.313120% |
Noise dominated data is calculated using 1-second bins in cleaned event files. If a bin has >2000 counts, and if more than 50% of those come from <1% of pixels, then it is considered to be noise-dominated and hence unusable.
| Quadrant | # 1 sec bins | Bins with >0 counts | Bins with >2000 counts | High rate bins dominated by noise | Noise dominated (total time) | Noise dominated (detector-on time) | Marked lightcurve |
|---|---|---|---|---|---|---|---|
| A | 28599 | 24913 | 6 | 6 | 0.02% | 0.02% | 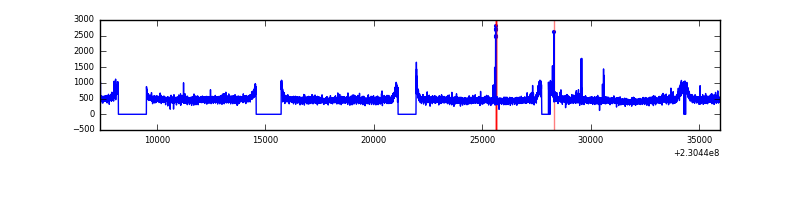 |
| B | 28599 | 24911 | 64 | 64 | 0.22% | 0.26% | 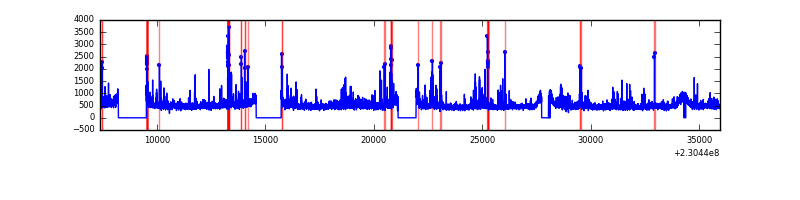 |
| C | 28599 | 24916 | 0 | 0 | 0.00% | 0.00% | 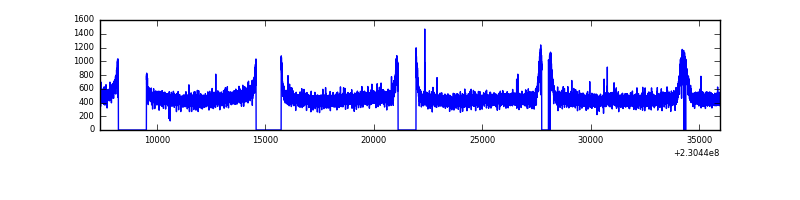 |
| D | 28599 | 24914 | 222 | 222 | 0.78% | 0.89% | 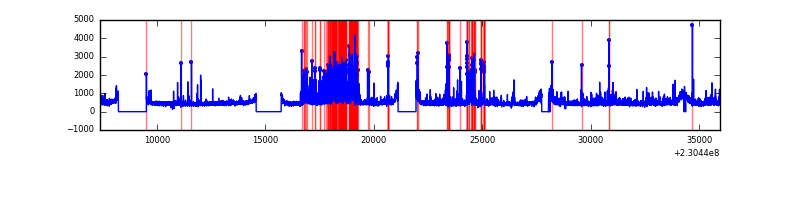 |
Top three noisy pixels from each quadrant. If the there are fewer than three noisy pixels in the level2.evt file, extra rows are filled as -1
| Pixel properties | Quadrant properties | ||||||
|---|---|---|---|---|---|---|---|
| Quadrant | DetID | PixID | Counts | Sigma | Mean | Median | Sigma |
| A | 13 | 251 | 66249 | 101.43 | 3068 | 2996 | 623.6 |
| A | 0 | 226 | 28578 | 41.02 | 3068 | 2996 | 623.6 |
| A | 12 | 194 | 27416 | 39.16 | 3068 | 2996 | 623.6 |
| B | 5 | 255 | 338748 | 571.01 | 3062 | 2982 | 588.0 |
| B | 11 | 51 | 210357 | 352.67 | 3062 | 2982 | 588.0 |
| B | 4 | 48 | 208355 | 349.26 | 3062 | 2982 | 588.0 |
| C | 13 | 61 | 22585 | 28.39 | 2991 | 2997 | 690.0 |
| C | 8 | 222 | 14511 | 16.69 | 2991 | 2997 | 690.0 |
| C | 7 | 221 | 9294 | 9.13 | 2991 | 2997 | 690.0 |
| D | 1 | 52 | 1843555 | 2595.95 | 2985 | 2909 | 709.0 |
| D | 2 | 152 | 260393 | 363.14 | 2985 | 2909 | 709.0 |
| D | 11 | 129 | 228242 | 317.8 | 2985 | 2909 | 709.0 |
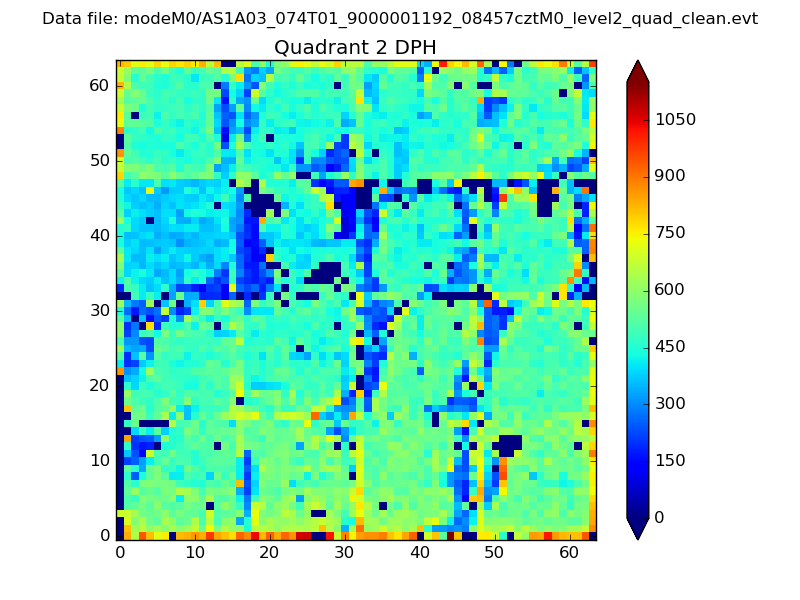
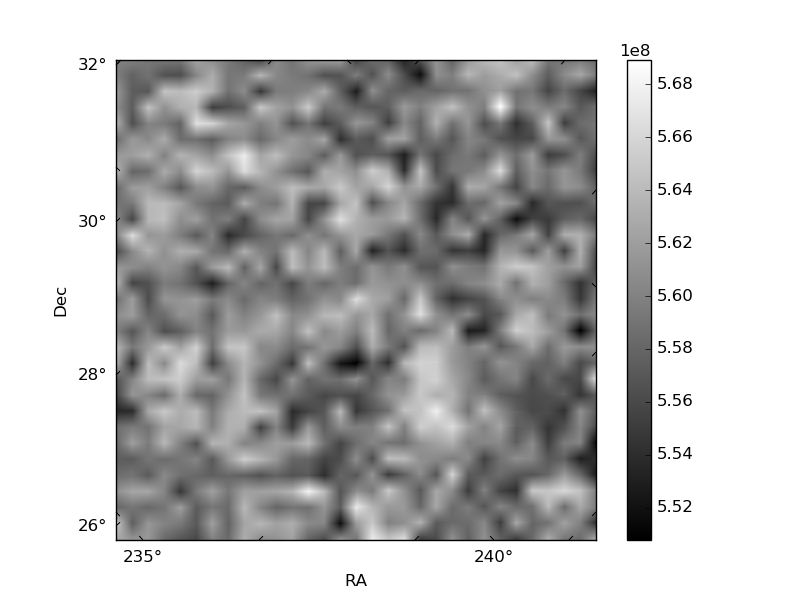
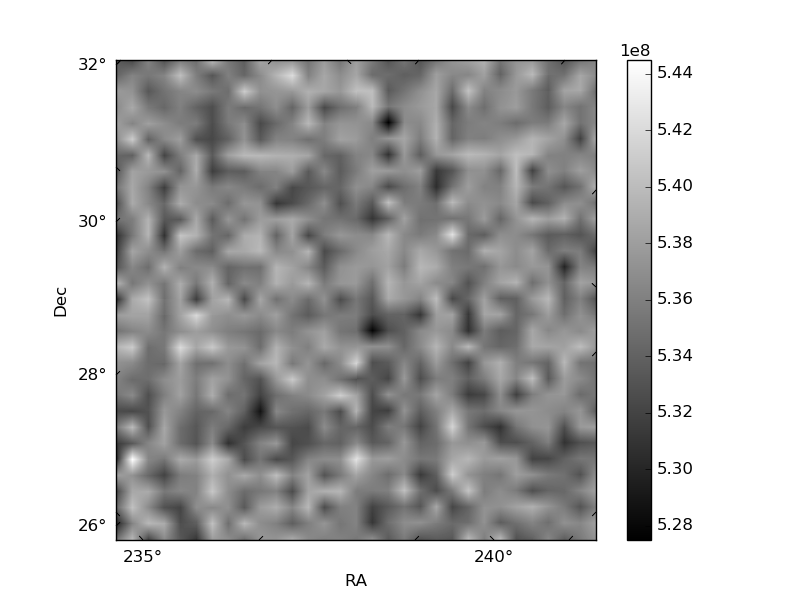
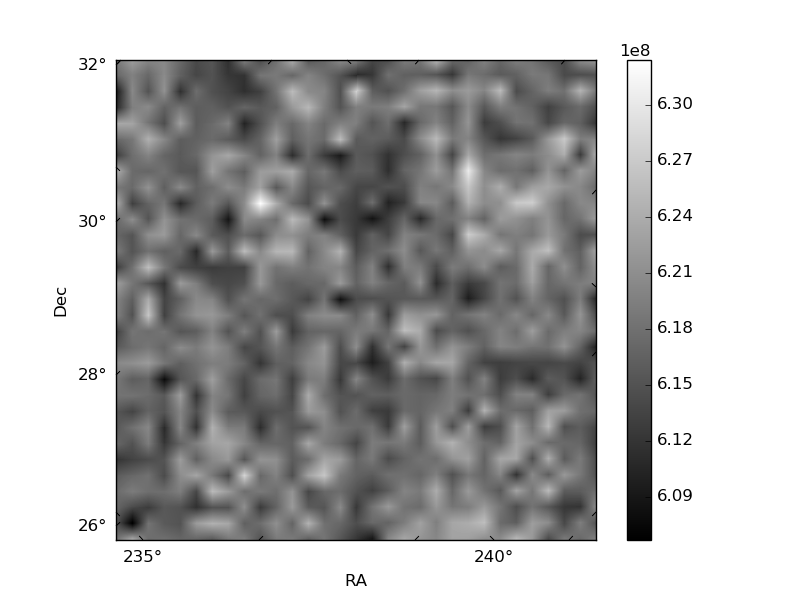
Histogram calculated using DETX and DETY for each event in the final _common_clean file
| Quadrant A | 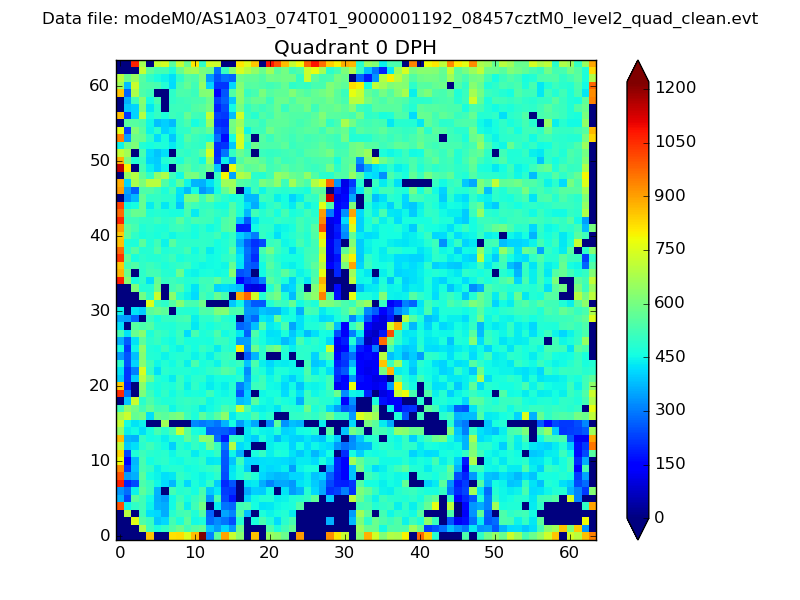 |
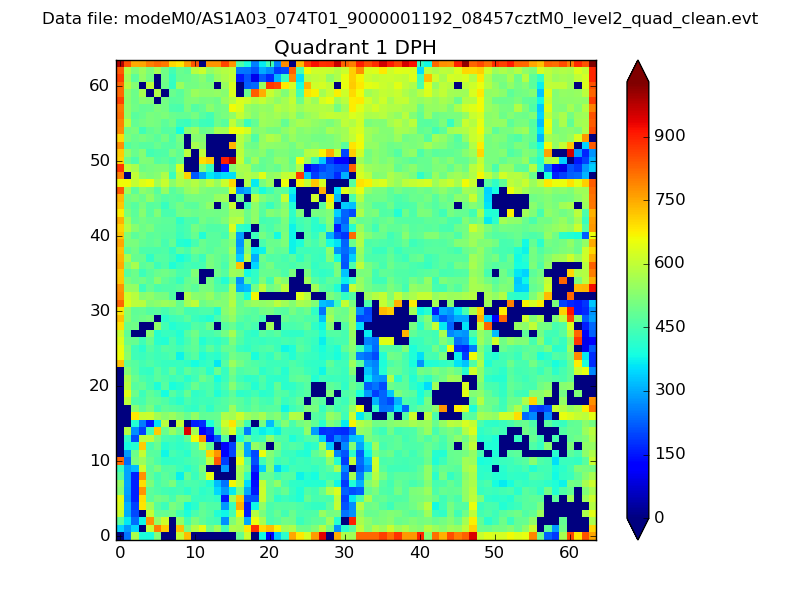 |
Quadrant B |
|---|---|---|---|
| Quadrant D | 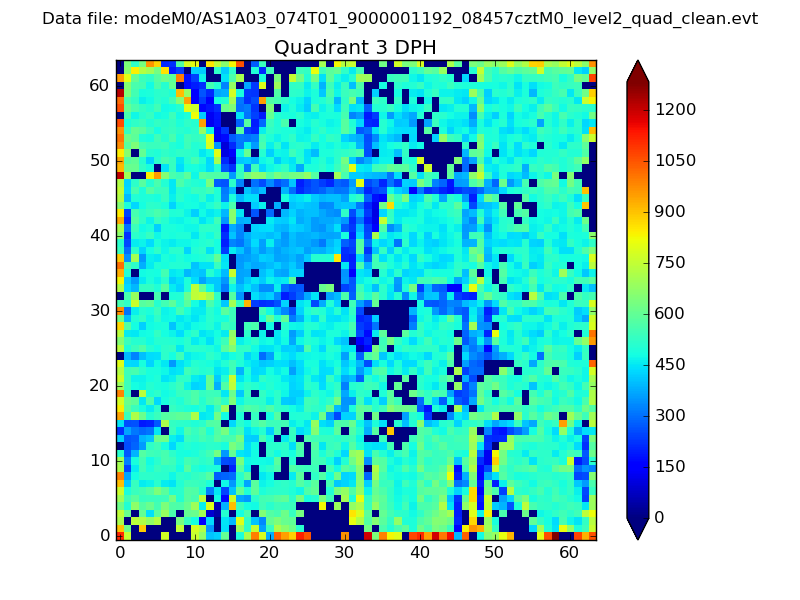 |
 |
Quadrant C |
| Plot type | Count rate plots | Images |
|---|---|---|
| Comparison with Poisson distribution Blue bars denote a histogram of data divided into 1 sec bins. Red curve is a Poisson curve with rate = median count rate of data. |
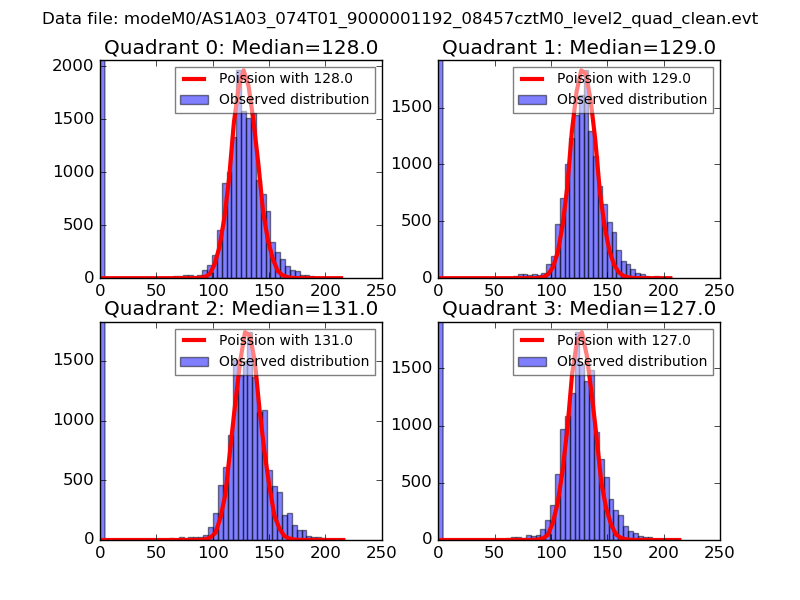 |
 |
| Quadrant-wise count rates Data is divided into 100 sec bins |
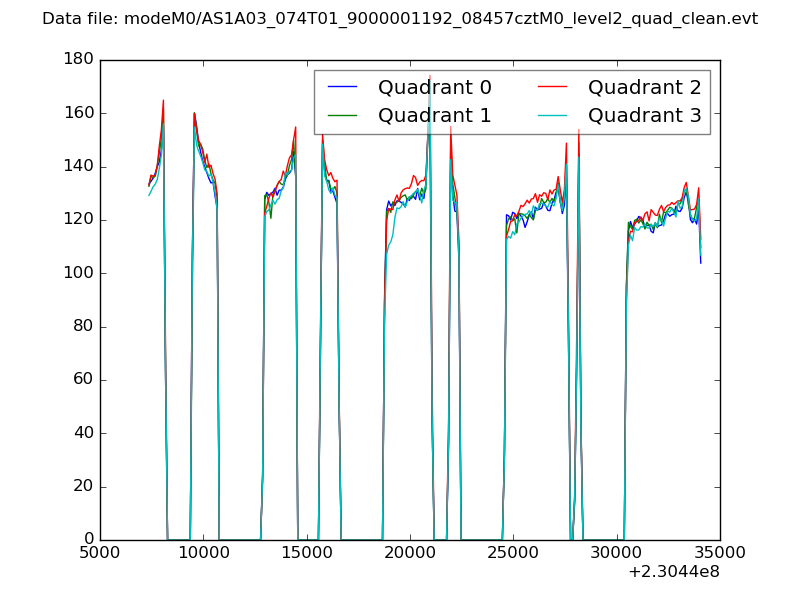 |
|
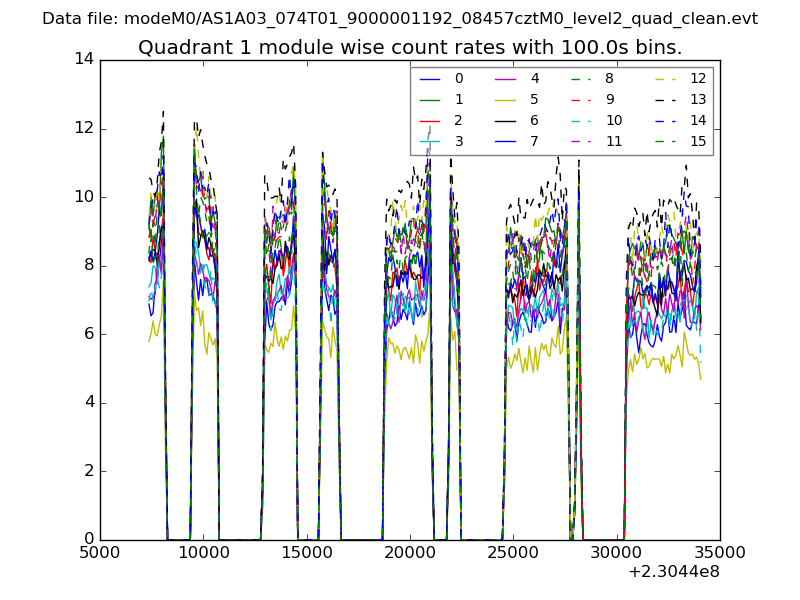
| Module-wise count rates for Quadrant A Data is divided into 100 sec bins |
 |
 |
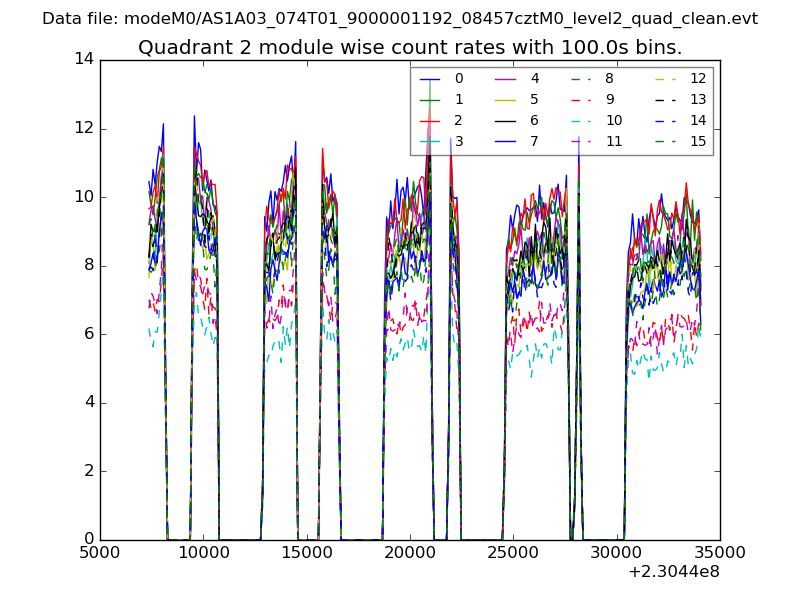
| Module-wise count rates for Quadrant B Data is divided into 100 sec bins |
 |
 |
| Module-wise count rates for Quadrant C Data is divided into 100 sec bins |
 |
 |
| Module-wise count rates for Quadrant D Data is divided into 100 sec bins |
 |
 |
| Parameter | Plot |
|---|---|
| CZT HV Monitor | 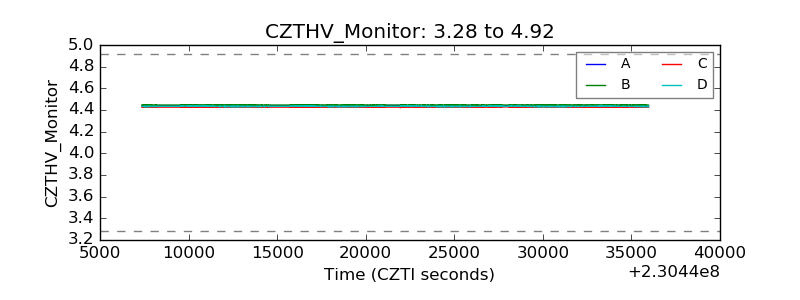 |
| D_VDD | 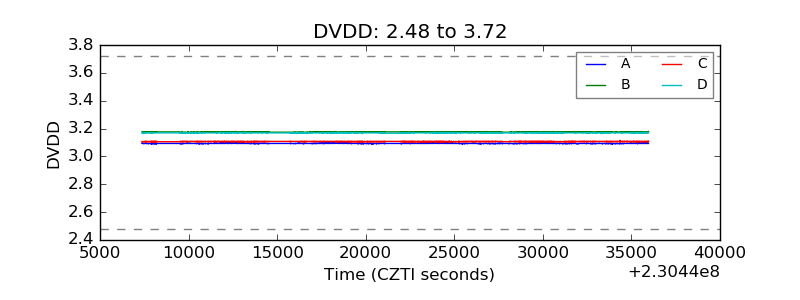 |
| Temperature 1 | 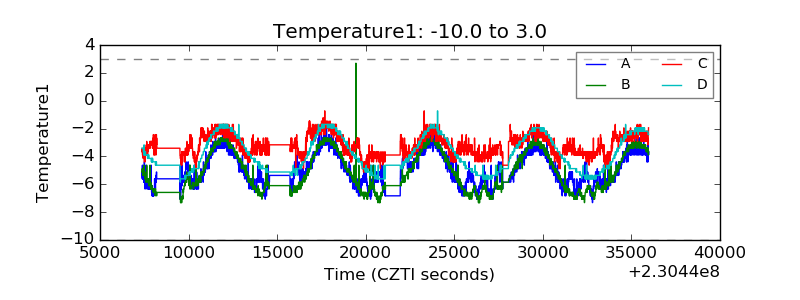 |
| Veto HV Monitor | 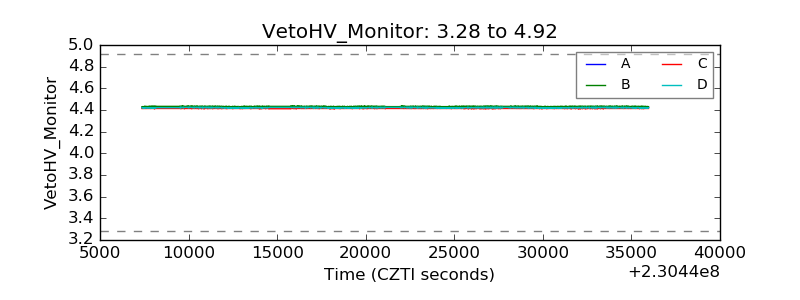 |
| Veto LLD | 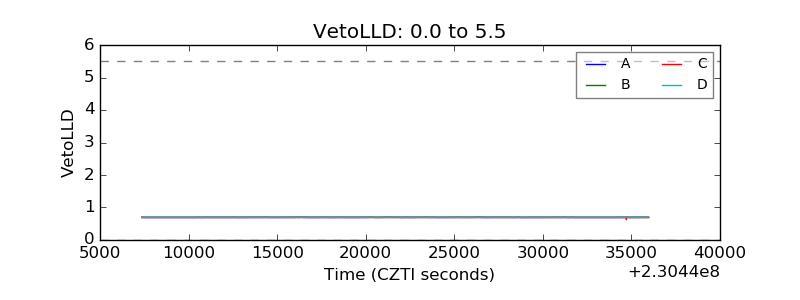 |
| Alpha Counter | 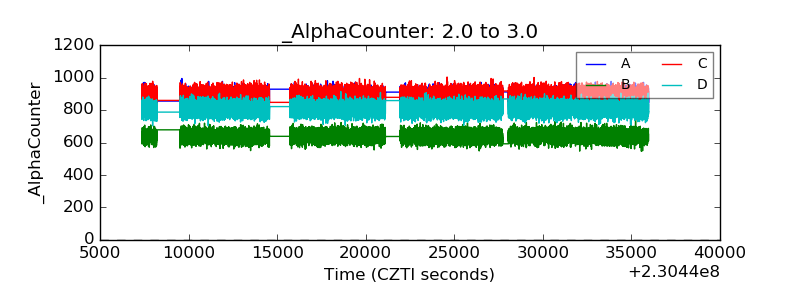 |
| _CPM_Rate | 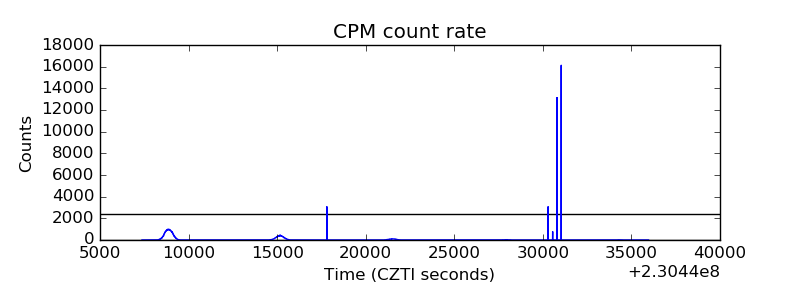 |
| CZT Counter | 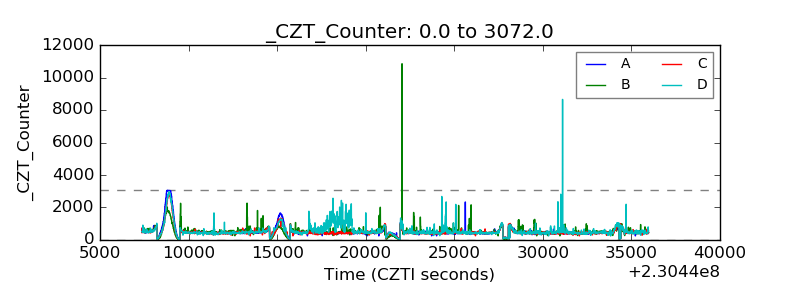 |
| +2.5 Volts monitor |  |
| +5 Volts monitor |  |
| _ROLL_ROT | 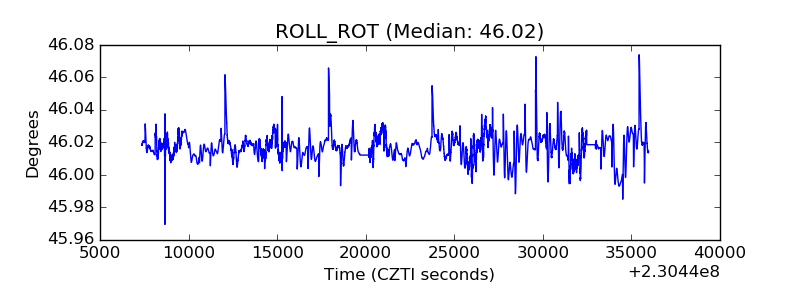 |
| _Roll_DEC | 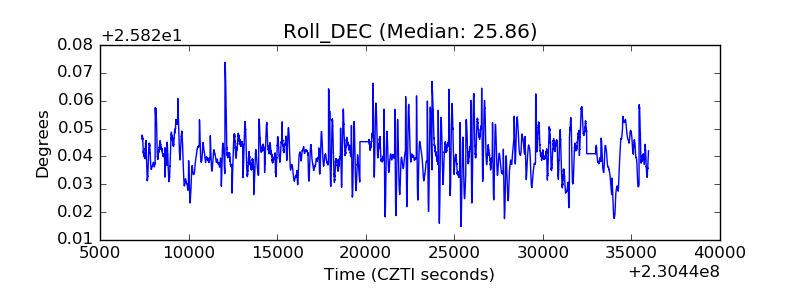 |
| _Roll_RA | 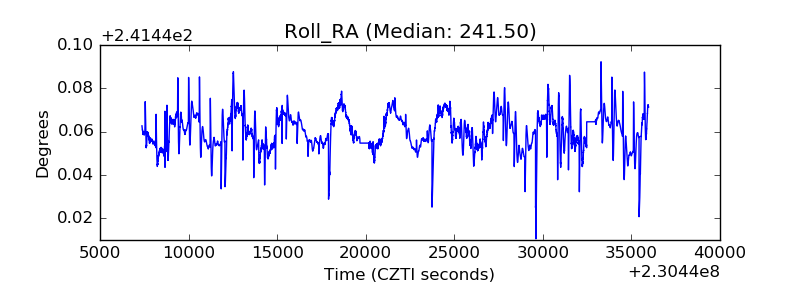 |
| Veto Counter |  |