| Param | Original file | Final file |
|---|---|---|
| Filename | modeM0/AS1A03_074T01_9000001192_08458cztM0_level2.evt | modeM0/AS1A03_074T01_9000001192_08458cztM0_level2_quad_clean.evt |
| Size (bytes) | 587,813,760 | 93,519,360 |
| Size | 560.6 MB | 89.2 MB |
| Events in quadrant A | 4,185,711 | 551,951 |
| Events in quadrant B | 4,484,438 | 554,390 |
| Events in quadrant C | 4,128,594 | 566,331 |
| Events in quadrant D | 4,408,651 | 551,611 |
| Mode SS | |||
|---|---|---|---|
| Quadrant | BADHDUFLAG | Total packets | Discarded packets |
| A | 0 | 180 | 0 |
| B | 0 | 180 | 0 |
| C | 0 | 180 | 0 |
| D | 0 | 180 | 0 |
| Mode M9 | |||
|---|---|---|---|
| Quadrant | BADHDUFLAG | Total packets | Discarded packets |
| A | 0 | 1 | 0 |
| B | 0 | 1 | 0 |
| C | 0 | 1 | 0 |
| D | 0 | 1 | 0 |
| Mode M0 | |||
|---|---|---|---|
| Quadrant | BADHDUFLAG | Total packets | Discarded packets |
| A | 0 | 18337 | 23 |
| B | 0 | 18983 | 25 |
| C | 0 | 18330 | 24 |
| D | 0 | 19079 | 20 |
| Quadrant | Total seconds | Saturated seconds | Saturation percentage |
|---|---|---|---|
| A | 8741 | 368 | 4.210045% |
| B | 8741 | 440 | 5.033749% |
| C | 8741 | 308 | 3.523624% |
| D | 8743 | 331 | 3.785886% |
Noise dominated data is calculated using 1-second bins in cleaned event files. If a bin has >2000 counts, and if more than 50% of those come from <1% of pixels, then it is considered to be noise-dominated and hence unusable.
| Quadrant | # 1 sec bins | Bins with >0 counts | Bins with >2000 counts | High rate bins dominated by noise | Noise dominated (total time) | Noise dominated (detector-on time) | Marked lightcurve |
|---|---|---|---|---|---|---|---|
| A | 8975 | 8754 | 0 | 0 | 0.00% | 0.00% | 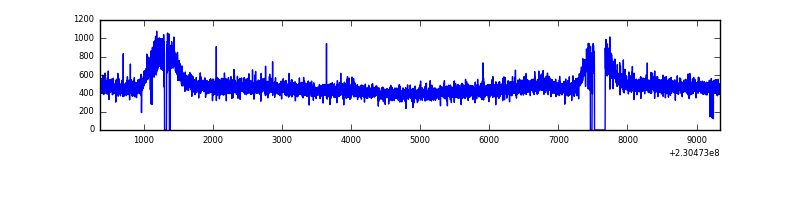 |
| B | 8975 | 8753 | 17 | 17 | 0.19% | 0.19% | 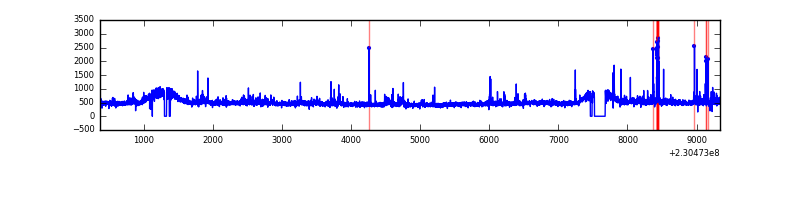 |
| C | 8975 | 8754 | 0 | 0 | 0.00% | 0.00% | 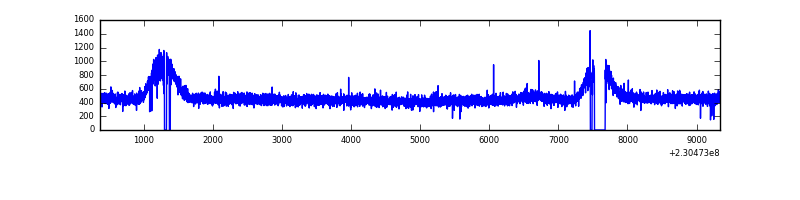 |
| D | 8975 | 8754 | 13 | 13 | 0.14% | 0.15% | 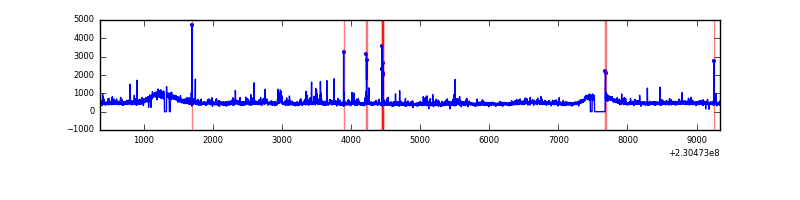 |
Top three noisy pixels from each quadrant. If the there are fewer than three noisy pixels in the level2.evt file, extra rows are filled as -1
| Pixel properties | Quadrant properties | ||||||
|---|---|---|---|---|---|---|---|
| Quadrant | DetID | PixID | Counts | Sigma | Mean | Median | Sigma |
| A | 13 | 251 | 18702 | 79.47 | 1084 | 1058 | 222.0 |
| A | 0 | 226 | 9937 | 39.99 | 1084 | 1058 | 222.0 |
| A | 12 | 194 | 9805 | 39.39 | 1084 | 1058 | 222.0 |
| B | 0 | 214 | 136861 | 646.98 | 1079 | 1052 | 209.9 |
| B | 11 | 51 | 57234 | 267.64 | 1079 | 1052 | 209.9 |
| B | 4 | 48 | 55676 | 260.22 | 1079 | 1052 | 209.9 |
| C | 13 | 61 | 7891 | 27.78 | 1055 | 1056 | 246.0 |
| C | 8 | 222 | 6499 | 22.12 | 1055 | 1056 | 246.0 |
| C | 7 | 221 | 3680 | 10.67 | 1055 | 1056 | 246.0 |
| D | 2 | 152 | 203767 | 798.08 | 1056 | 1025 | 254.0 |
| D | 11 | 129 | 66324 | 257.05 | 1056 | 1025 | 254.0 |
| D | 2 | 14 | 50592 | 195.12 | 1056 | 1025 | 254.0 |
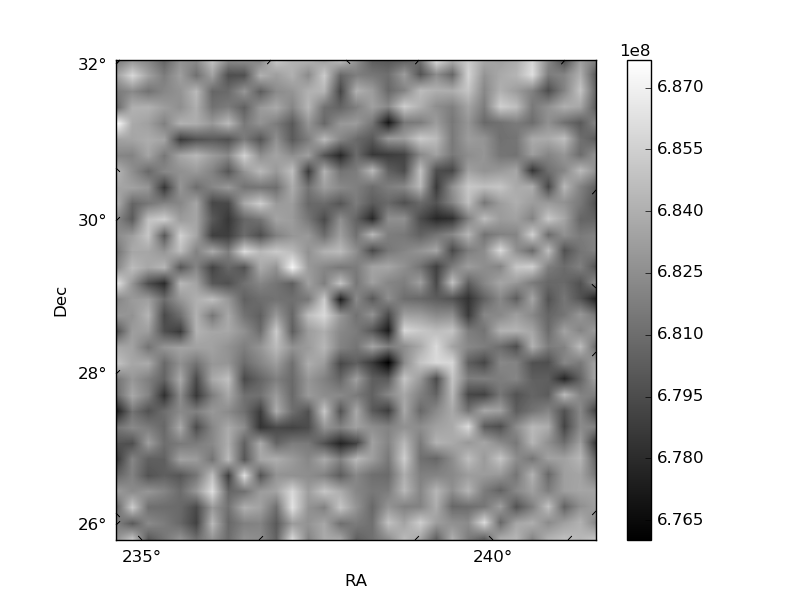
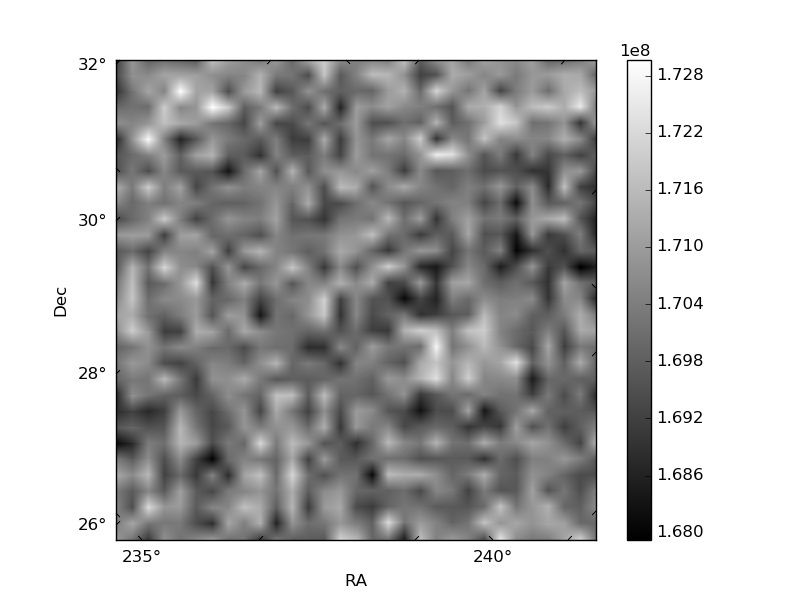
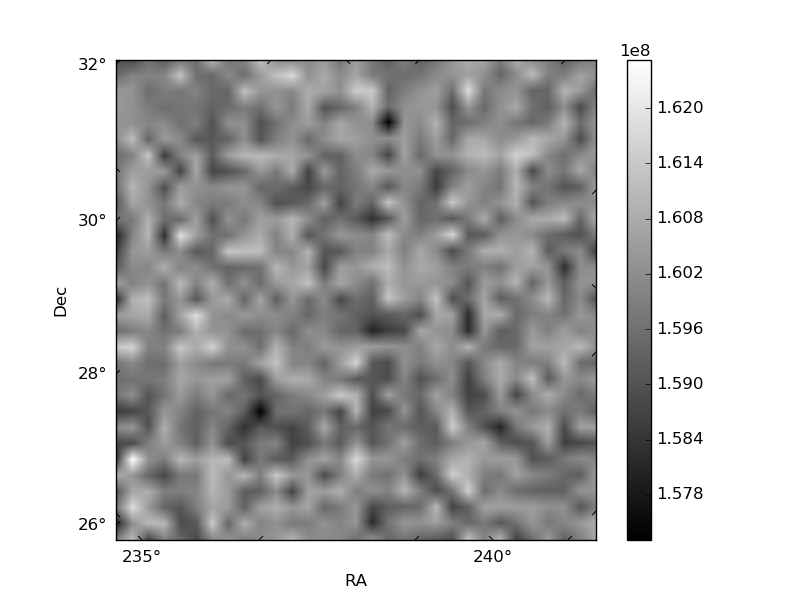
Histogram calculated using DETX and DETY for each event in the final _common_clean file
| Quadrant A | 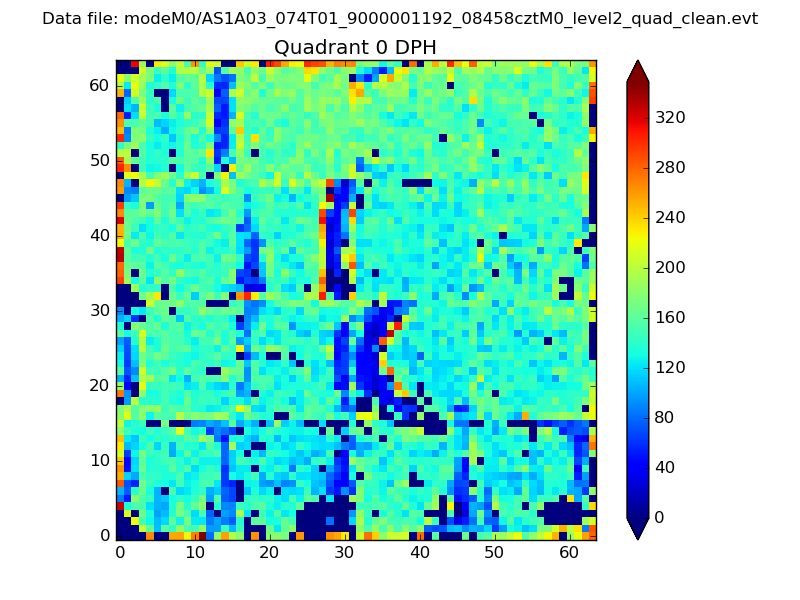 |
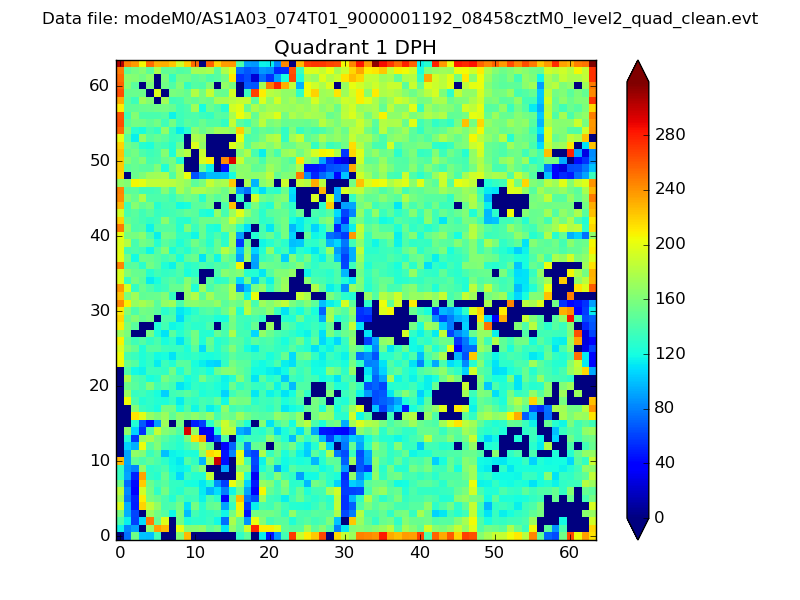 |
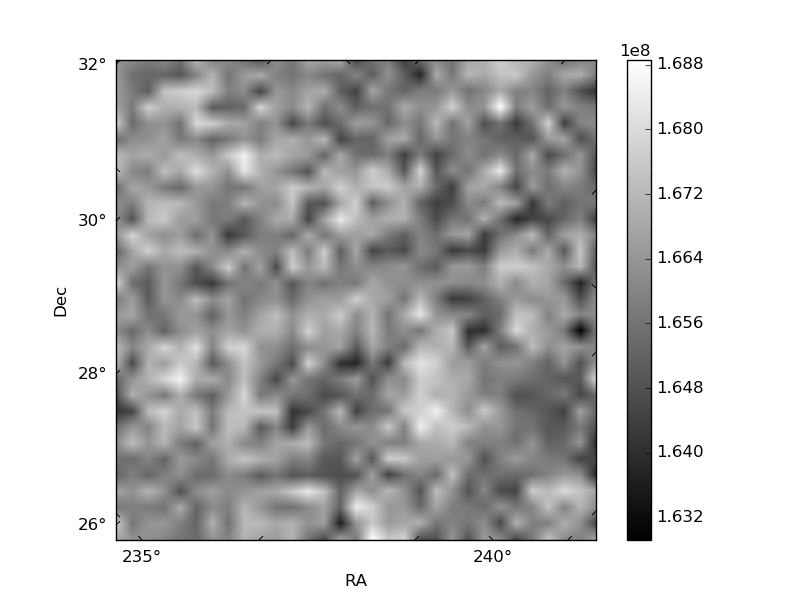
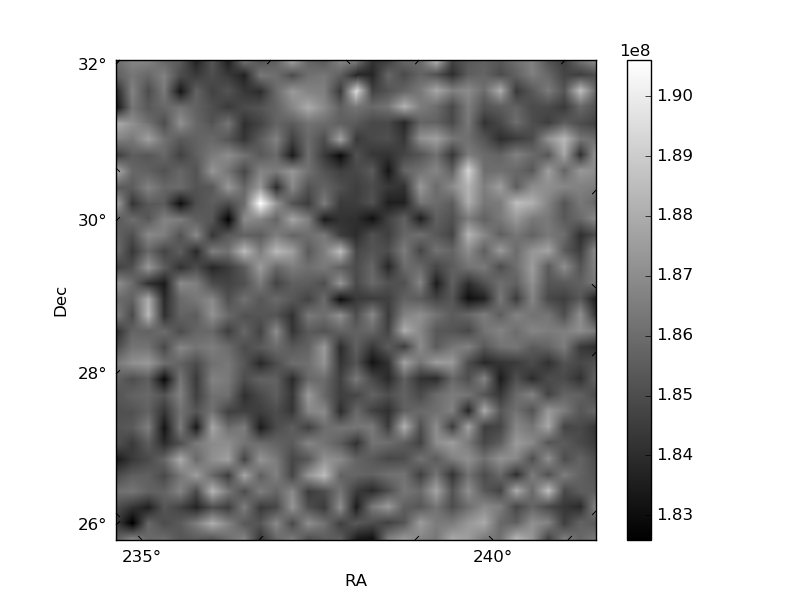
Quadrant B |
|---|---|---|---|
| Quadrant D | 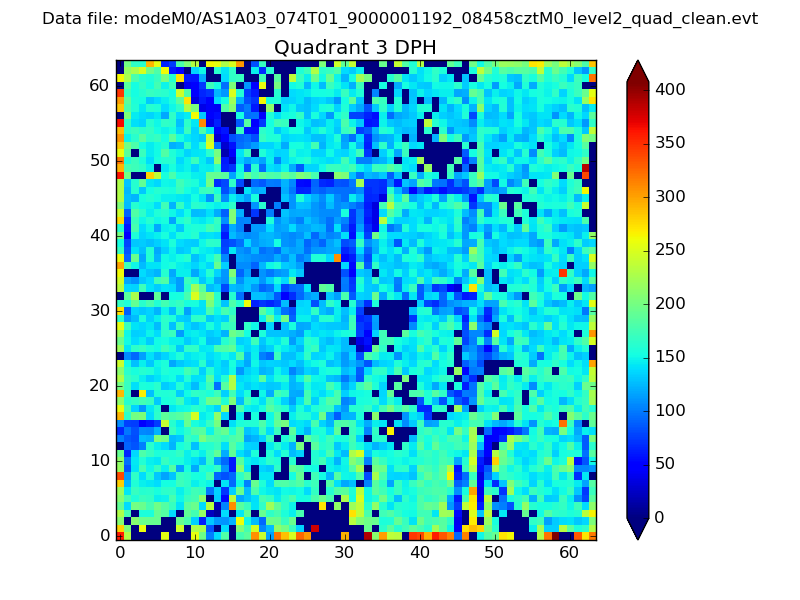 |
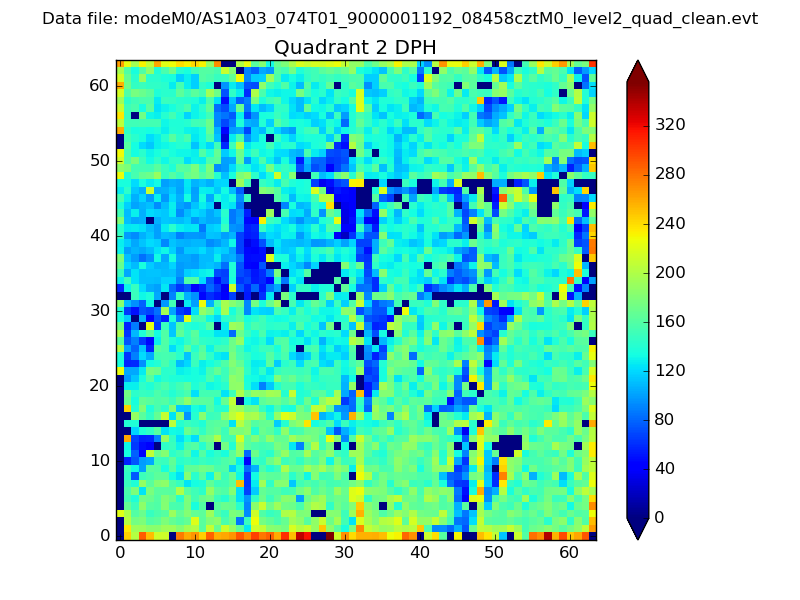 |
Quadrant C |
| Plot type | Count rate plots | Images |
|---|---|---|
| Comparison with Poisson distribution Blue bars denote a histogram of data divided into 1 sec bins. Red curve is a Poisson curve with rate = median count rate of data. |
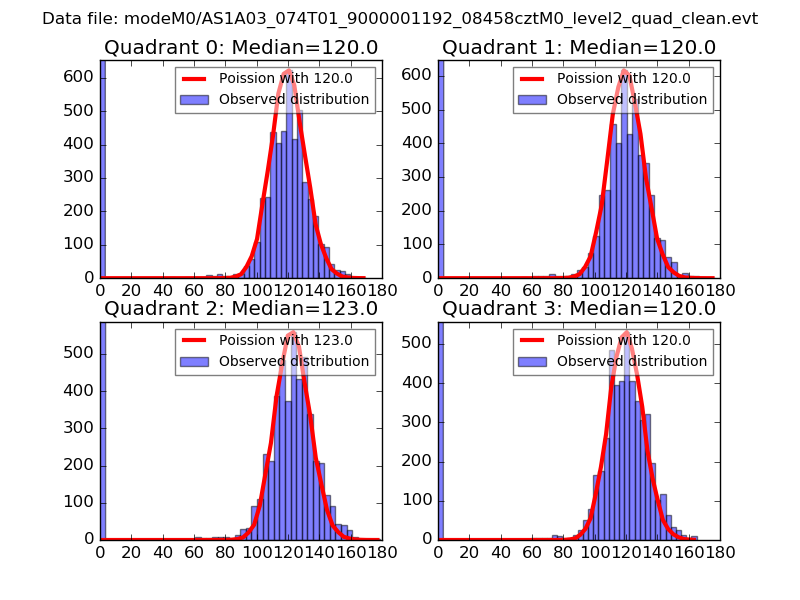 |
 |
| Quadrant-wise count rates Data is divided into 100 sec bins |
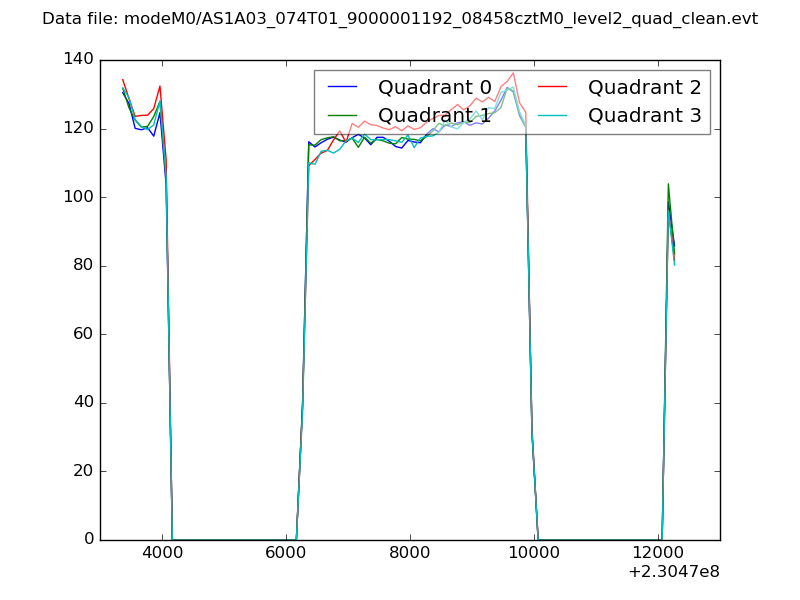 |
|
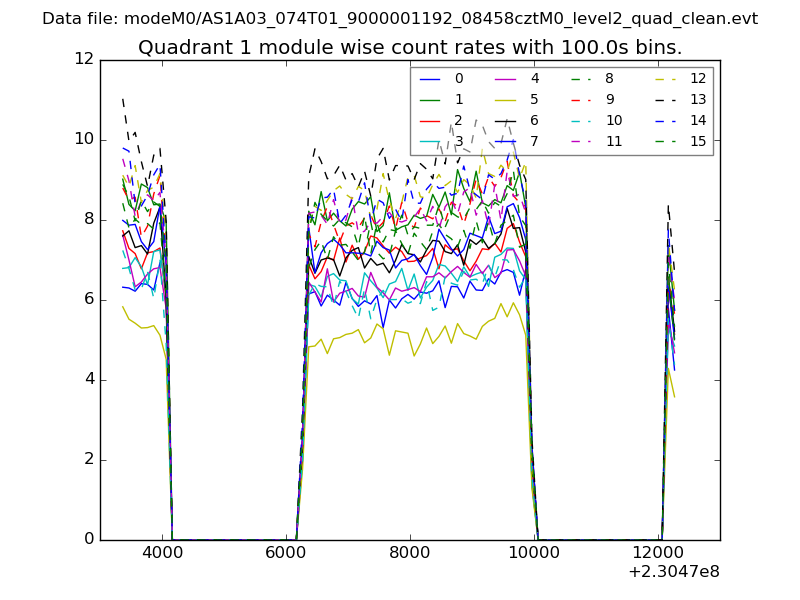
| Module-wise count rates for Quadrant A Data is divided into 100 sec bins |
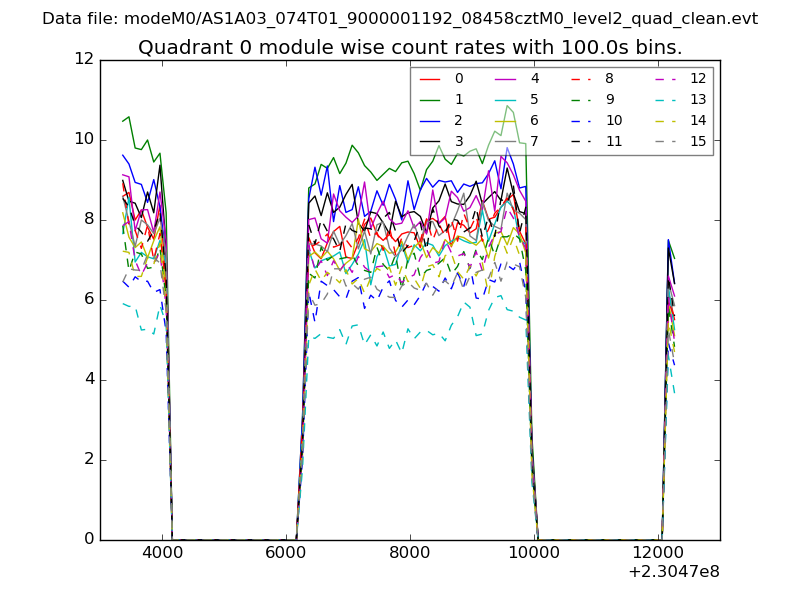 |
 |
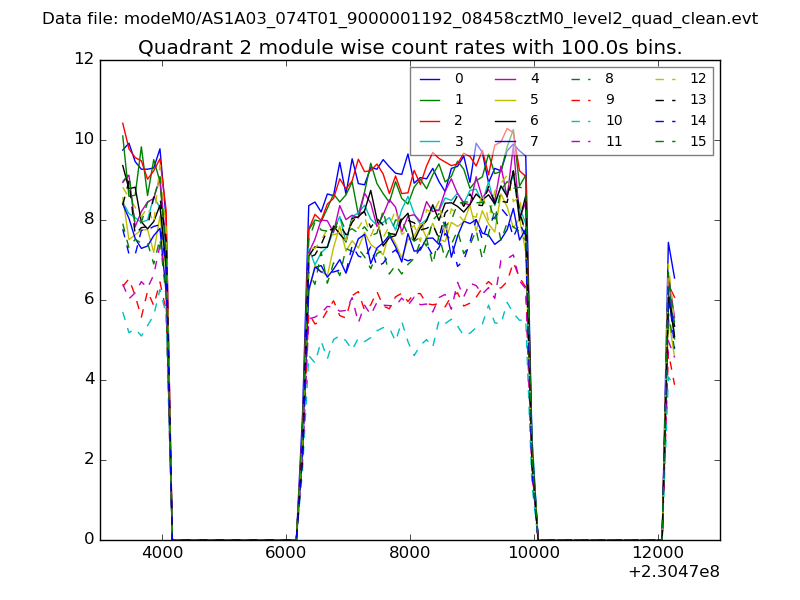
| Module-wise count rates for Quadrant B Data is divided into 100 sec bins |
 |
 |
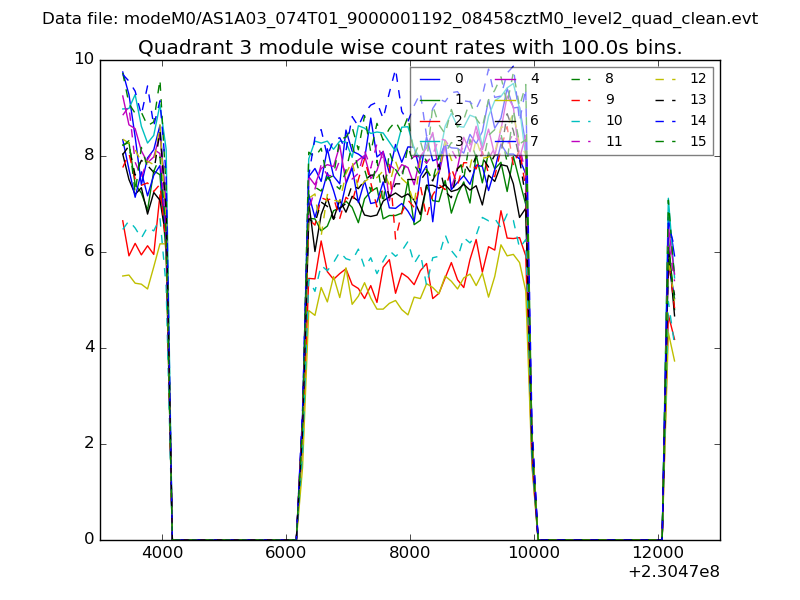
| Module-wise count rates for Quadrant C Data is divided into 100 sec bins |
 |
 |
| Module-wise count rates for Quadrant D Data is divided into 100 sec bins |
 |
 |
| Parameter | Plot |
|---|---|
| CZT HV Monitor | 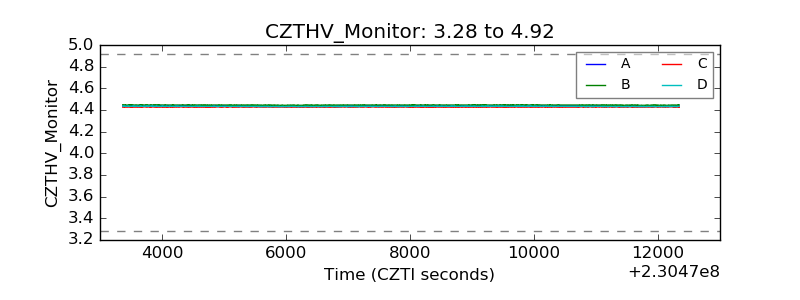 |
| D_VDD | 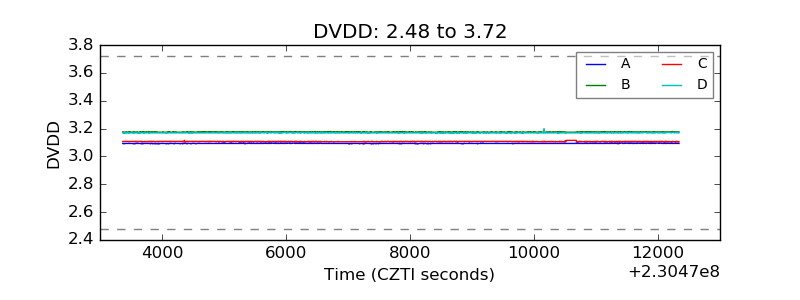 |
| Temperature 1 | 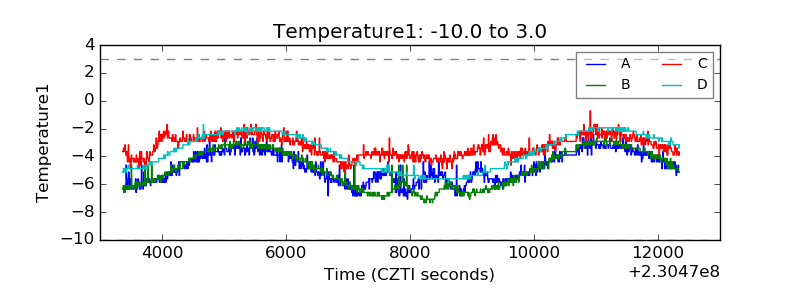 |
| Veto HV Monitor | 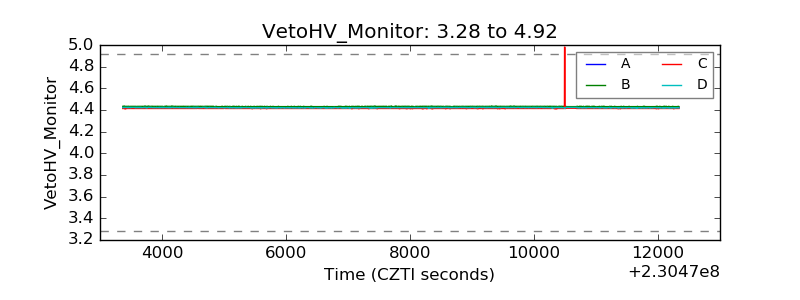 |
| Veto LLD | 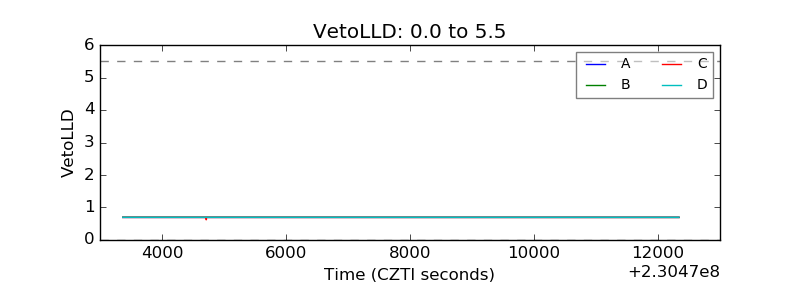 |
| Alpha Counter | 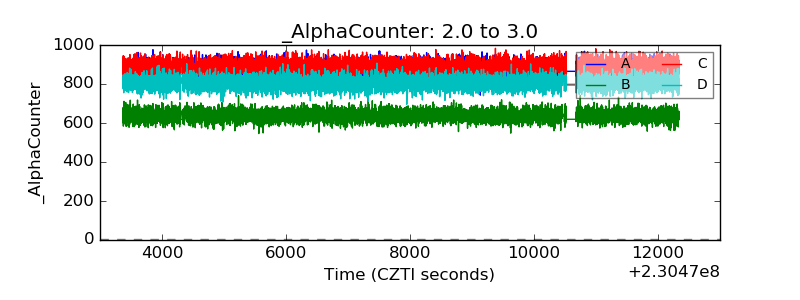 |
| _CPM_Rate | 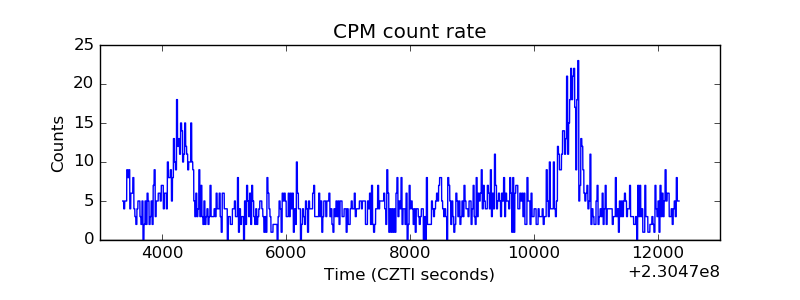 |
| CZT Counter | 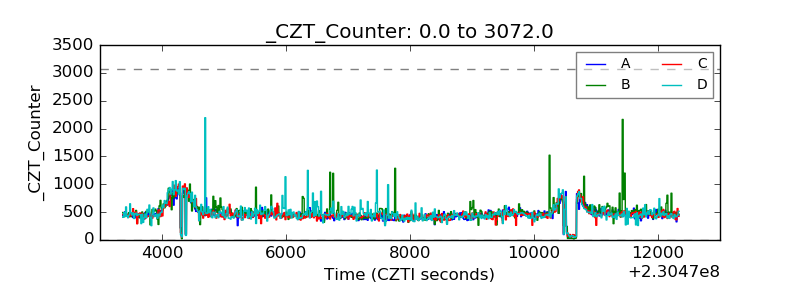 |
| +2.5 Volts monitor |  |
| +5 Volts monitor |  |
| _ROLL_ROT | 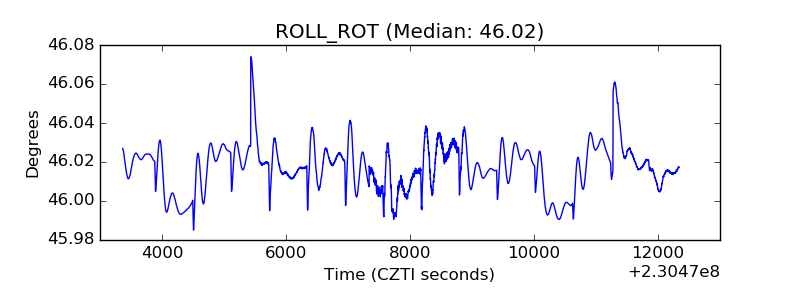 |
| _Roll_DEC | 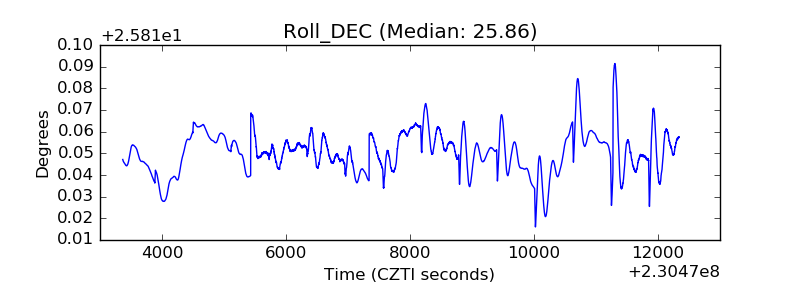 |
| _Roll_RA |  |
| Veto Counter | 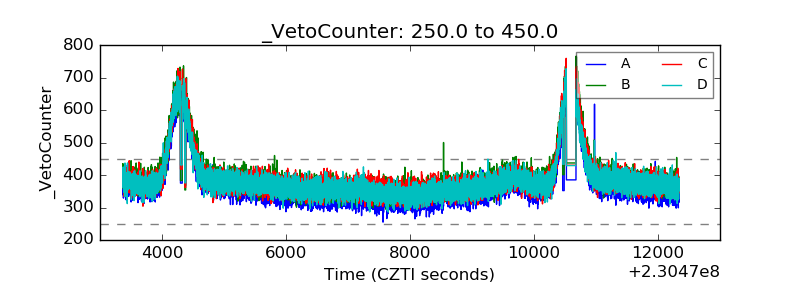 |