| Param | Original file | Final file |
|---|---|---|
| Filename | modeM0/AS1A03_074T01_9000001192_08461cztM0_level2.evt | modeM0/AS1A03_074T01_9000001192_08461cztM0_level2_quad_clean.evt |
| Size (bytes) | 1,194,572,160 | 230,624,640 |
| Size | 1.1 GB | 219.9 MB |
| Events in quadrant A | 8,616,753 | 1,410,807 |
| Events in quadrant B | 9,012,470 | 1,424,856 |
| Events in quadrant C | 8,678,719 | 1,468,766 |
| Events in quadrant D | 8,627,359 | 1,416,254 |
| Mode SS | |||
|---|---|---|---|
| Quadrant | BADHDUFLAG | Total packets | Discarded packets |
| A | 0 | 383 | 6 |
| B | 0 | 384 | 12 |
| C | 0 | 384 | 10 |
| D | 0 | 383 | 7 |
| Mode M9 | |||
|---|---|---|---|
| Quadrant | BADHDUFLAG | Total packets | Discarded packets |
| A | 0 | 21 | 0 |
| B | 0 | 21 | 0 |
| C | 0 | 21 | 0 |
| D | 0 | 21 | 0 |
| Mode M0 | |||
|---|---|---|---|
| Quadrant | BADHDUFLAG | Total packets | Discarded packets |
| A | 0 | 39333 | 1003 |
| B | 0 | 40302 | 1195 |
| C | 0 | 39608 | 976 |
| D | 0 | 39294 | 1035 |
| Quadrant | Total seconds | Saturated seconds | Saturation percentage |
|---|---|---|---|
| A | 18338 | 262 | 1.428727% |
| B | 18335 | 324 | 1.767112% |
| C | 18368 | 250 | 1.361063% |
| D | 18329 | 187 | 1.020241% |
Noise dominated data is calculated using 1-second bins in cleaned event files. If a bin has >2000 counts, and if more than 50% of those come from <1% of pixels, then it is considered to be noise-dominated and hence unusable.
| Quadrant | # 1 sec bins | Bins with >0 counts | Bins with >2000 counts | High rate bins dominated by noise | Noise dominated (total time) | Noise dominated (detector-on time) | Marked lightcurve |
|---|---|---|---|---|---|---|---|
| A | 20929 | 18732 | 55 | 55 | 0.26% | 0.29% | 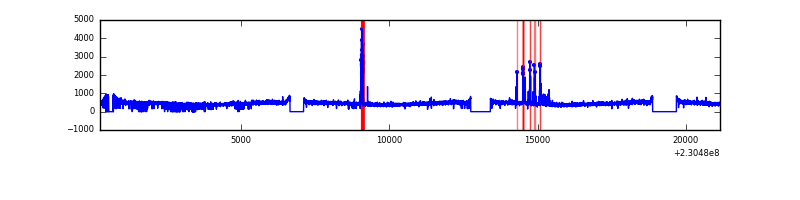 |
| B | 20929 | 18718 | 28 | 28 | 0.13% | 0.15% | 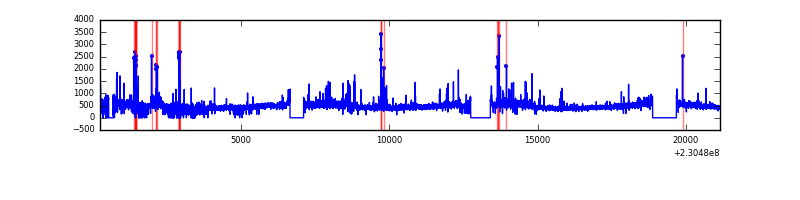 |
| C | 20929 | 18721 | 43 | 43 | 0.21% | 0.23% |  |
| D | 20929 | 18707 | 17 | 17 | 0.08% | 0.09% | 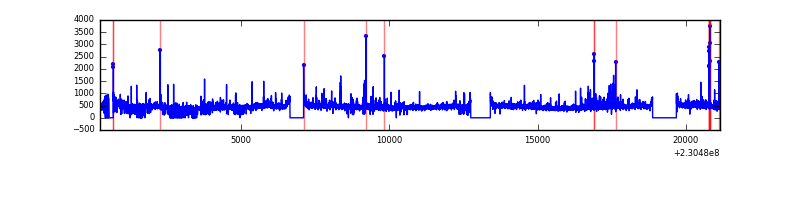 |
Top three noisy pixels from each quadrant. If the there are fewer than three noisy pixels in the level2.evt file, extra rows are filled as -1
| Pixel properties | Quadrant properties | ||||||
|---|---|---|---|---|---|---|---|
| Quadrant | DetID | PixID | Counts | Sigma | Mean | Median | Sigma |
| A | 13 | 251 | 368442 | 839.69 | 2145 | 2097 | 436.3 |
| A | 0 | 226 | 19808 | 40.59 | 2145 | 2097 | 436.3 |
| A | 12 | 194 | 18940 | 38.61 | 2145 | 2097 | 436.3 |
| B | 0 | 214 | 206125 | 496.16 | 2152 | 2096 | 411.2 |
| B | 11 | 51 | 177402 | 426.31 | 2152 | 2096 | 411.2 |
| B | 4 | 81 | 167752 | 402.85 | 2152 | 2096 | 411.2 |
| C | 9 | 54 | 435794 | 886.25 | 2110 | 2118 | 489.3 |
| C | 13 | 61 | 15837 | 28.04 | 2110 | 2118 | 489.3 |
| C | 8 | 222 | 12336 | 20.88 | 2110 | 2118 | 489.3 |
| D | 2 | 152 | 299402 | 593.43 | 2099 | 2054 | 501.1 |
| D | 1 | 52 | 100289 | 196.05 | 2099 | 2054 | 501.1 |
| D | 2 | 14 | 96038 | 187.57 | 2099 | 2054 | 501.1 |
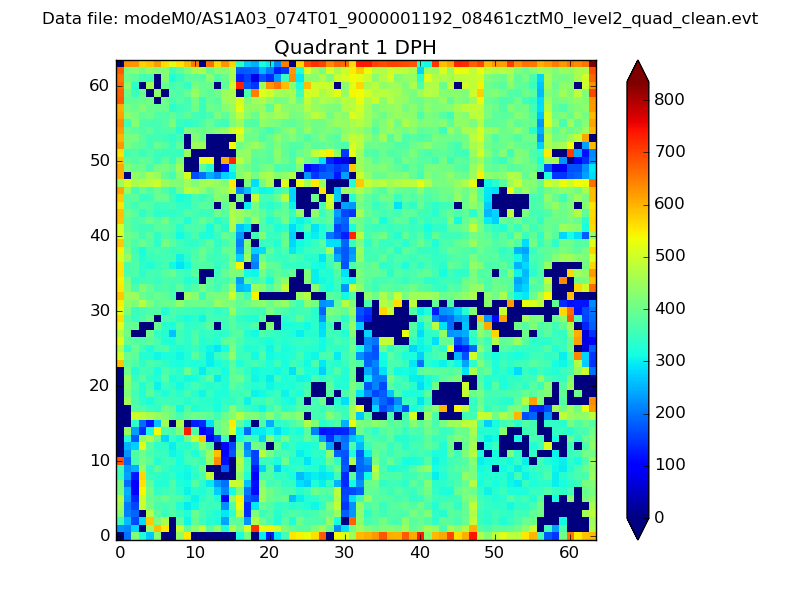
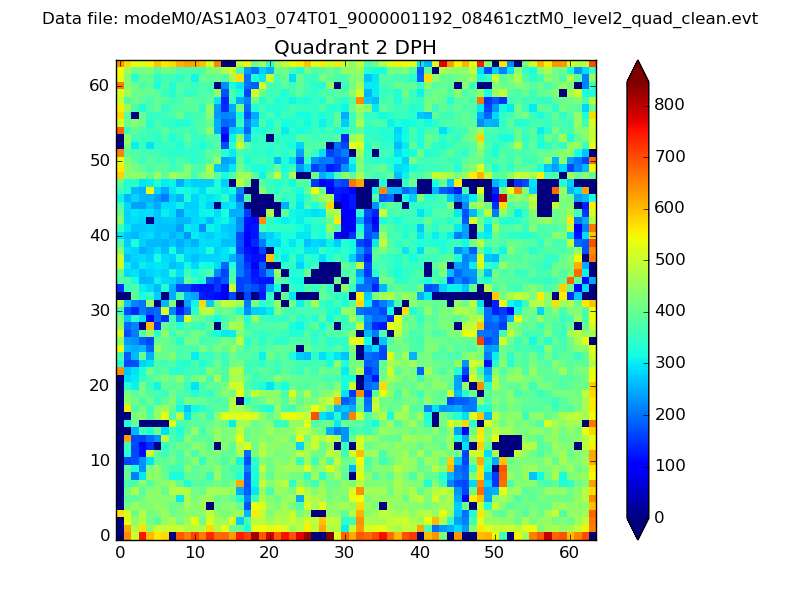
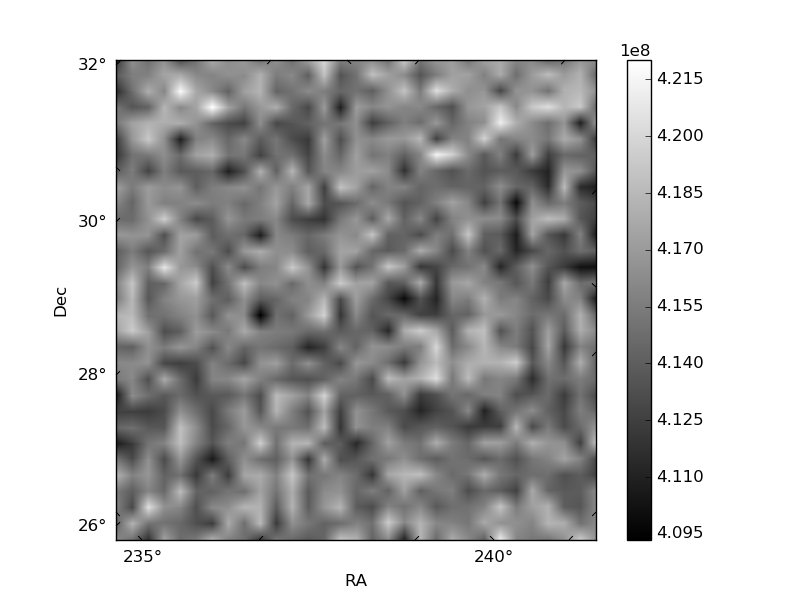
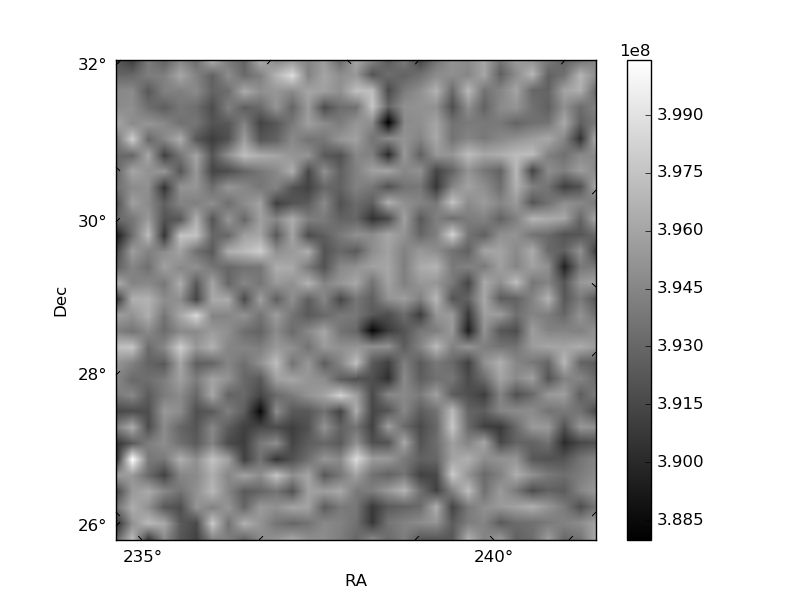
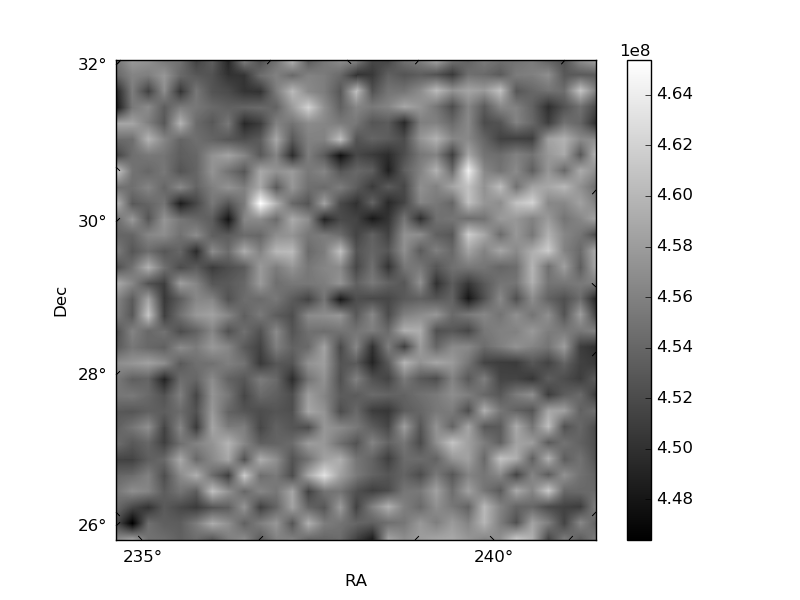
Histogram calculated using DETX and DETY for each event in the final _common_clean file
| Quadrant A |  |
 |
Quadrant B |
|---|---|---|---|
| Quadrant D | 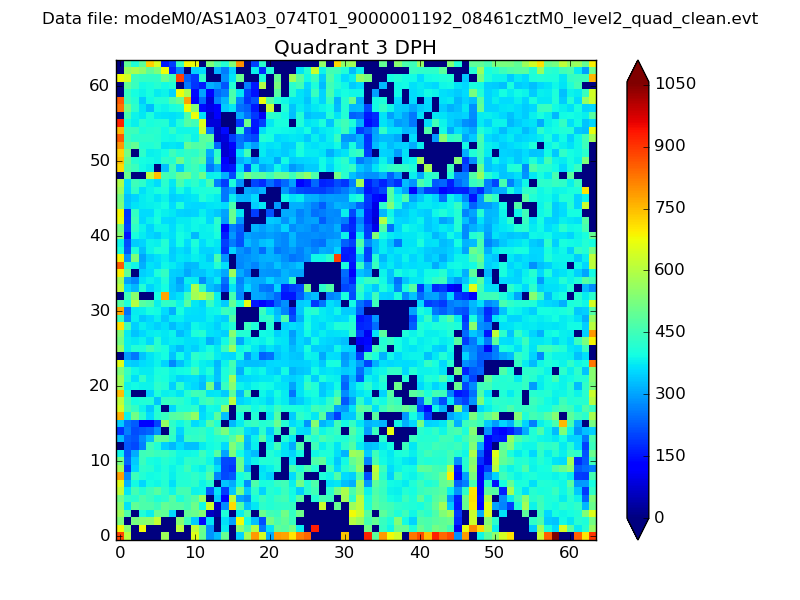 |
 |
Quadrant C |
| Plot type | Count rate plots | Images |
|---|---|---|
| Comparison with Poisson distribution Blue bars denote a histogram of data divided into 1 sec bins. Red curve is a Poisson curve with rate = median count rate of data. |
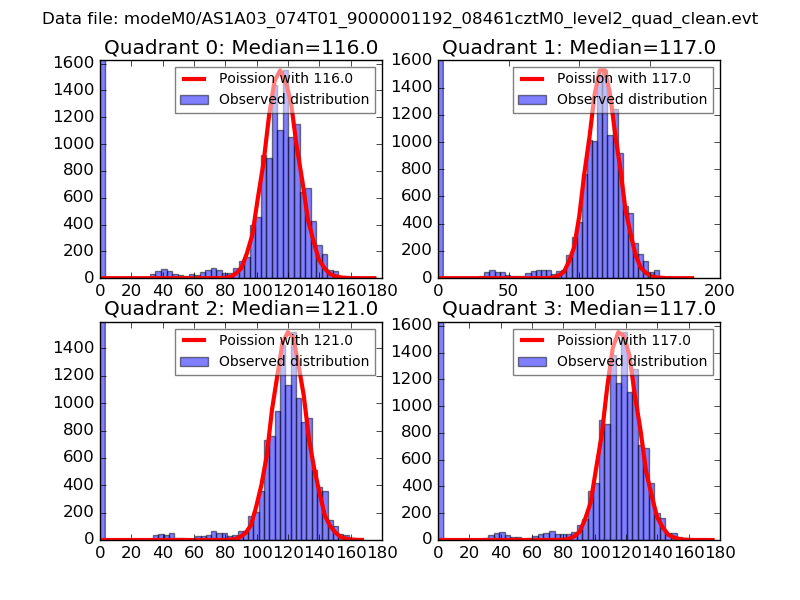 |
 |
| Quadrant-wise count rates Data is divided into 100 sec bins |
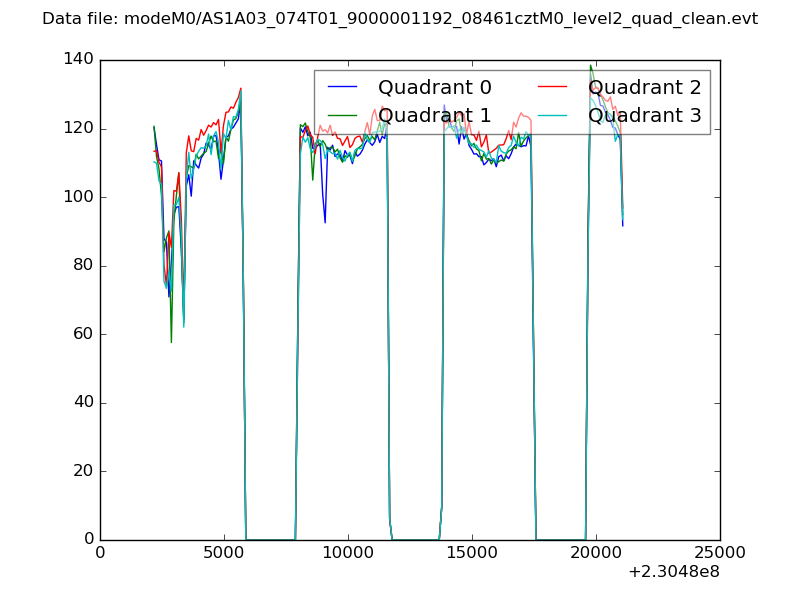 |
|
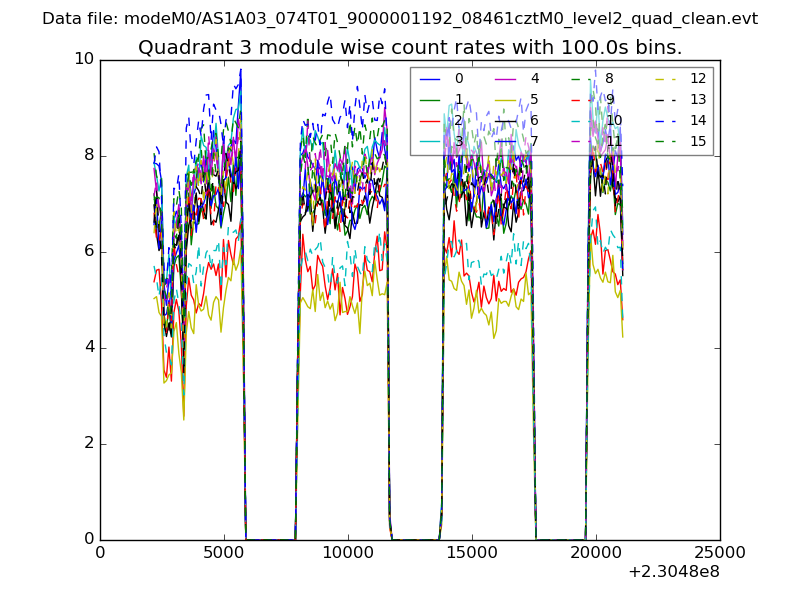
| Module-wise count rates for Quadrant A Data is divided into 100 sec bins |
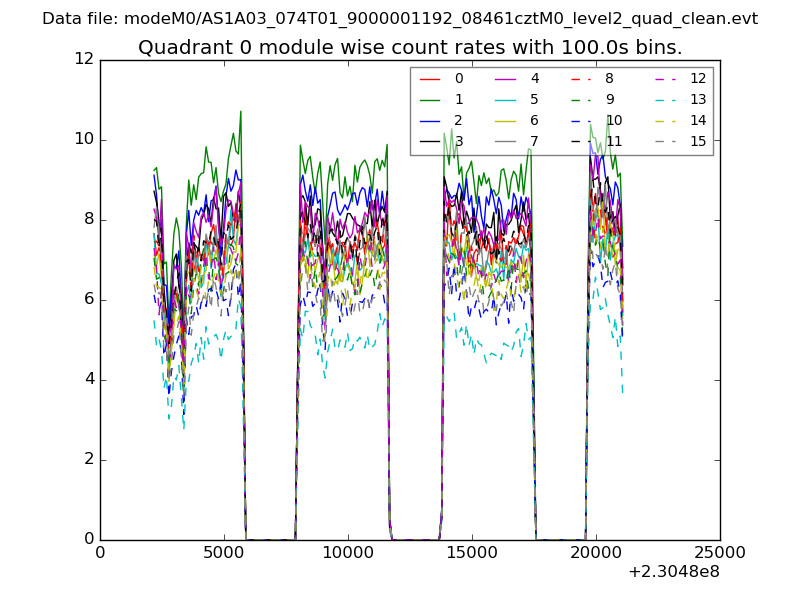 |
 |
| Module-wise count rates for Quadrant B Data is divided into 100 sec bins |
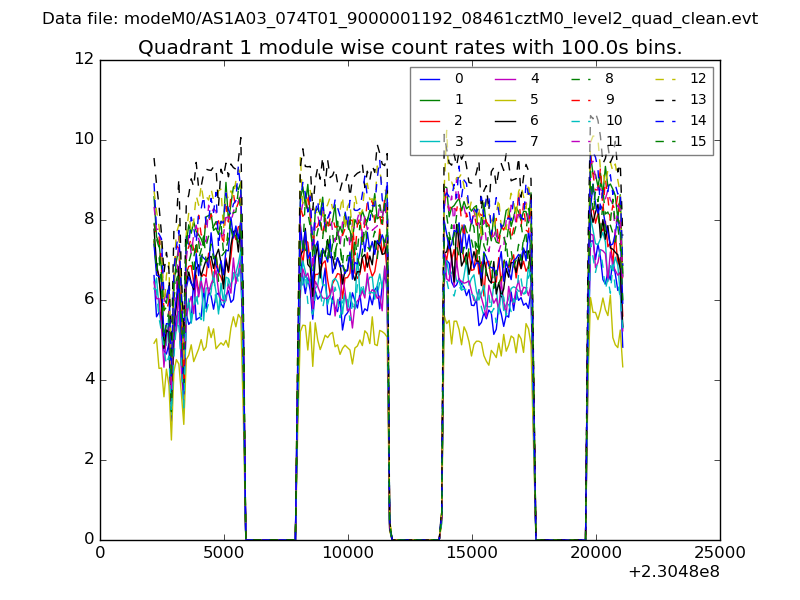 |
 |
| Module-wise count rates for Quadrant C Data is divided into 100 sec bins |
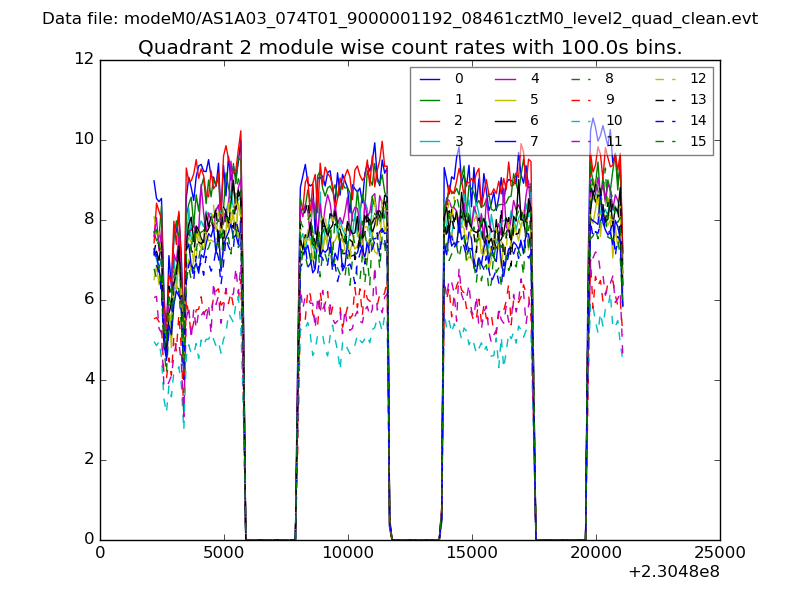 |
 |
| Module-wise count rates for Quadrant D Data is divided into 100 sec bins |
 |
 |
| Parameter | Plot |
|---|---|
| CZT HV Monitor | 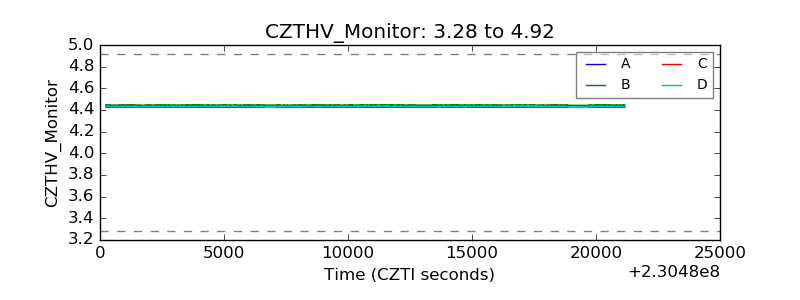 |
| D_VDD | 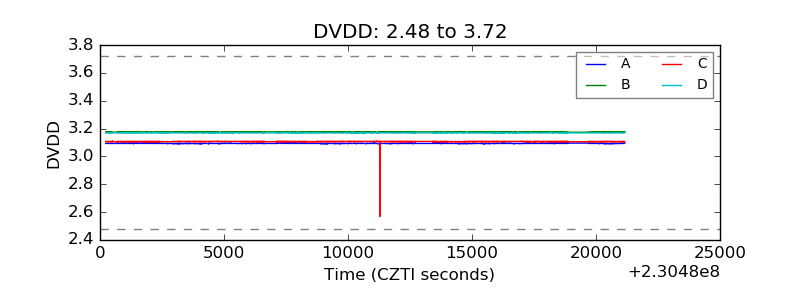 |
| Temperature 1 | 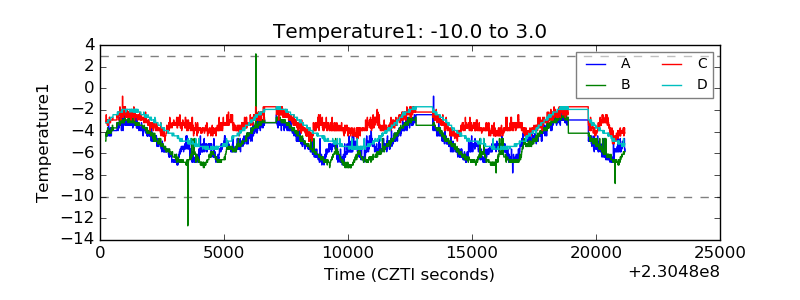 |
| Veto HV Monitor | 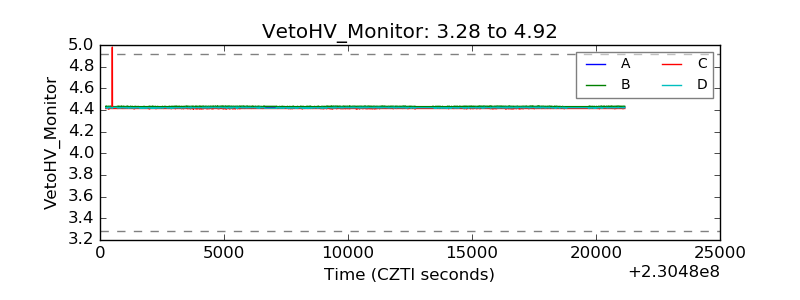 |
| Veto LLD | 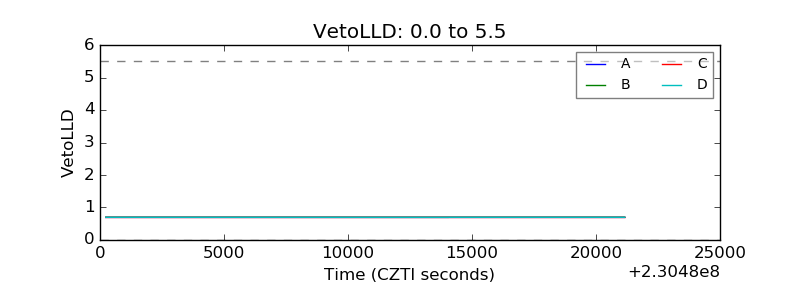 |
| Alpha Counter | 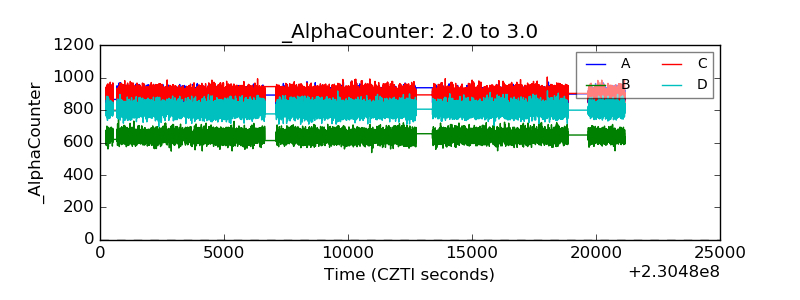 |
| _CPM_Rate | 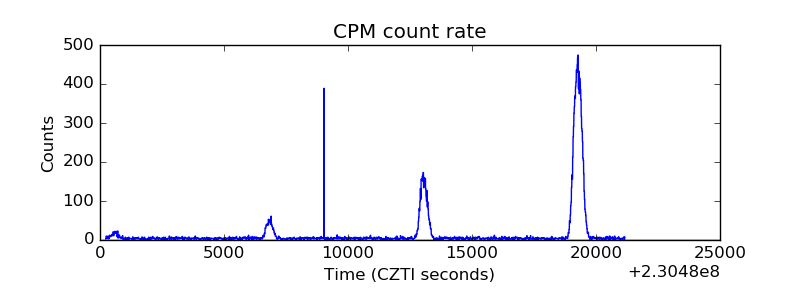 |
| CZT Counter | 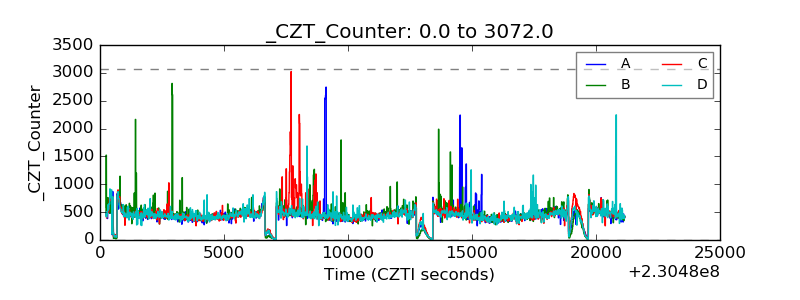 |
| +2.5 Volts monitor |  |
| +5 Volts monitor |  |
| _ROLL_ROT | 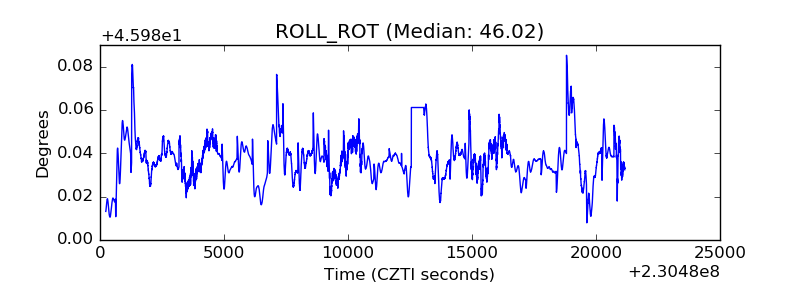 |
| _Roll_DEC | 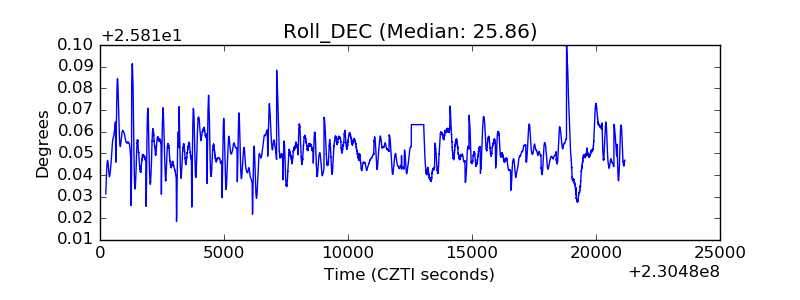 |
| _Roll_RA | 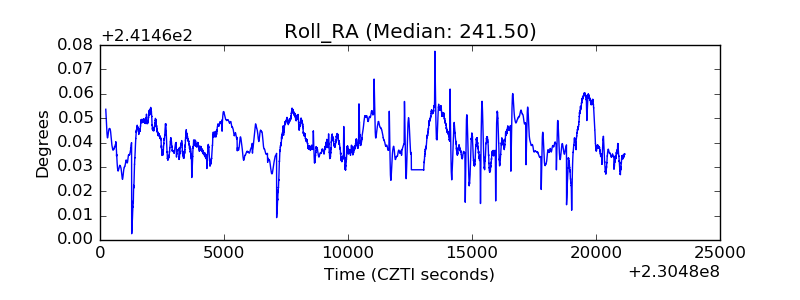 |
| Veto Counter | 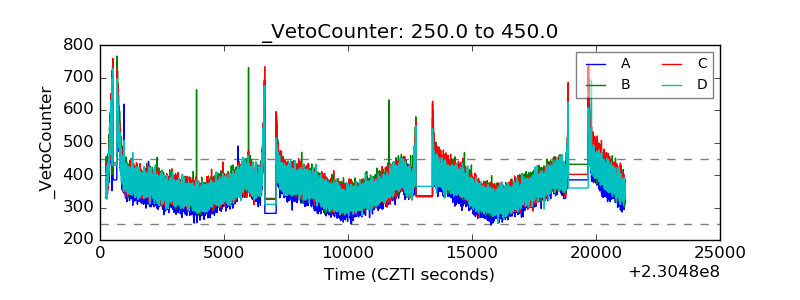 |