| Param | Original file | Final file |
|---|---|---|
| Filename | modeM0/AS1A03_074T01_9000001192_08462cztM0_level2.evt | modeM0/AS1A03_074T01_9000001192_08462cztM0_level2_quad_clean.evt |
| Size (bytes) | 484,300,800 | 99,247,680 |
| Size | 461.9 MB | 94.6 MB |
| Events in quadrant A | 3,400,036 | 612,469 |
| Events in quadrant B | 3,697,398 | 623,123 |
| Events in quadrant C | 3,403,859 | 639,678 |
| Events in quadrant D | 3,659,865 | 612,337 |
| Mode SS | |||
|---|---|---|---|
| Quadrant | BADHDUFLAG | Total packets | Discarded packets |
| A | 0 | 154 | 0 |
| B | 0 | 154 | 0 |
| C | 0 | 154 | 0 |
| D | 0 | 154 | 0 |
| Mode M9 | |||
|---|---|---|---|
| Quadrant | BADHDUFLAG | Total packets | Discarded packets |
| A | 0 | 18 | 0 |
| B | 0 | 18 | 0 |
| C | 0 | 18 | 0 |
| D | 0 | 18 | 0 |
| Mode M0 | |||
|---|---|---|---|
| Quadrant | BADHDUFLAG | Total packets | Discarded packets |
| A | 0 | 15261 | 10 |
| B | 0 | 15956 | 18 |
| C | 0 | 15232 | 18 |
| D | 0 | 16143 | 21 |
| Quadrant | Total seconds | Saturated seconds | Saturation percentage |
|---|---|---|---|
| A | 7446 | 27 | 0.362611% |
| B | 7441 | 72 | 0.967612% |
| C | 7441 | 22 | 0.295659% |
| D | 7439 | 54 | 0.725904% |
Noise dominated data is calculated using 1-second bins in cleaned event files. If a bin has >2000 counts, and if more than 50% of those come from <1% of pixels, then it is considered to be noise-dominated and hence unusable.
| Quadrant | # 1 sec bins | Bins with >0 counts | Bins with >2000 counts | High rate bins dominated by noise | Noise dominated (total time) | Noise dominated (detector-on time) | Marked lightcurve |
|---|---|---|---|---|---|---|---|
| A | 9234 | 7451 | 0 | 0 | 0.00% | 0.00% |  |
| B | 9234 | 7451 | 19 | 19 | 0.21% | 0.25% |  |
| C | 9234 | 7451 | 0 | 0 | 0.00% | 0.00% |  |
| D | 9234 | 7450 | 33 | 33 | 0.36% | 0.44% |  |
Top three noisy pixels from each quadrant. If the there are fewer than three noisy pixels in the level2.evt file, extra rows are filled as -1
| Pixel properties | Quadrant properties | ||||||
|---|---|---|---|---|---|---|---|
| Quadrant | DetID | PixID | Counts | Sigma | Mean | Median | Sigma |
| A | 0 | 226 | 8075 | 39.92 | 883 | 863 | 180.7 |
| A | 12 | 194 | 7730 | 38.01 | 883 | 863 | 180.7 |
| A | 13 | 251 | 6356 | 30.41 | 883 | 863 | 180.7 |
| B | 4 | 81 | 111370 | 643.25 | 888 | 866 | 171.8 |
| B | 0 | 214 | 89260 | 514.54 | 888 | 866 | 171.8 |
| B | 11 | 51 | 27762 | 156.56 | 888 | 866 | 171.8 |
| C | 13 | 61 | 6407 | 27.19 | 871 | 871 | 203.6 |
| C | 8 | 222 | 4356 | 17.12 | 871 | 871 | 203.6 |
| C | 14 | 67 | 2965 | 10.29 | 871 | 871 | 203.6 |
| D | 2 | 152 | 149842 | 721.24 | 861 | 840 | 206.6 |
| D | 13 | 169 | 80230 | 384.28 | 861 | 840 | 206.6 |
| D | 2 | 14 | 62818 | 300.0 | 861 | 840 | 206.6 |
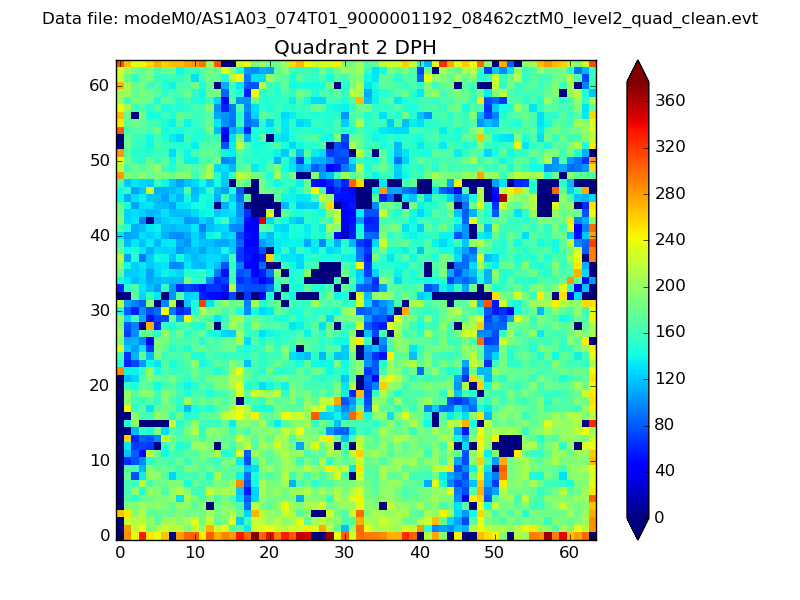
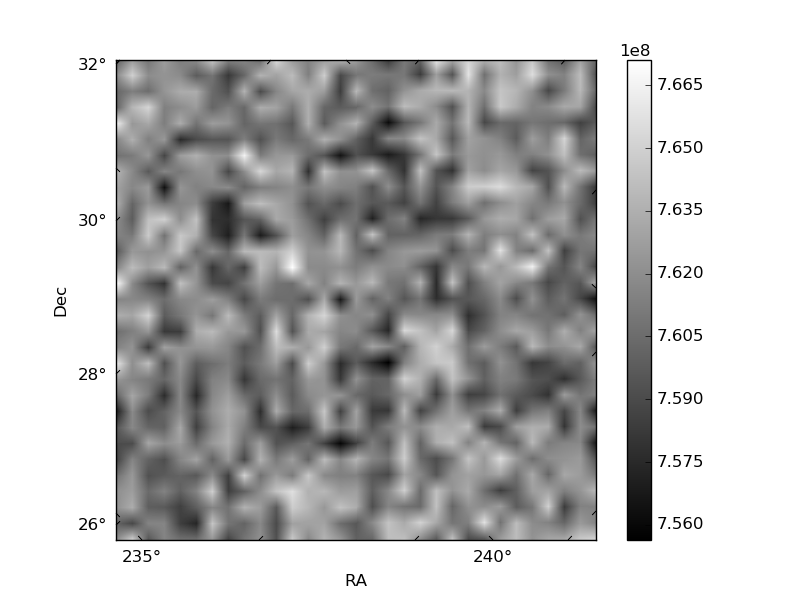
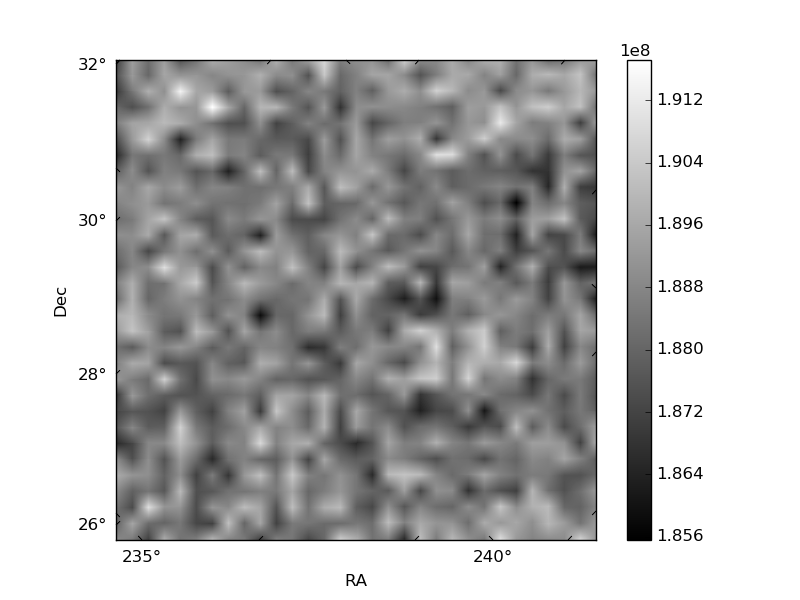
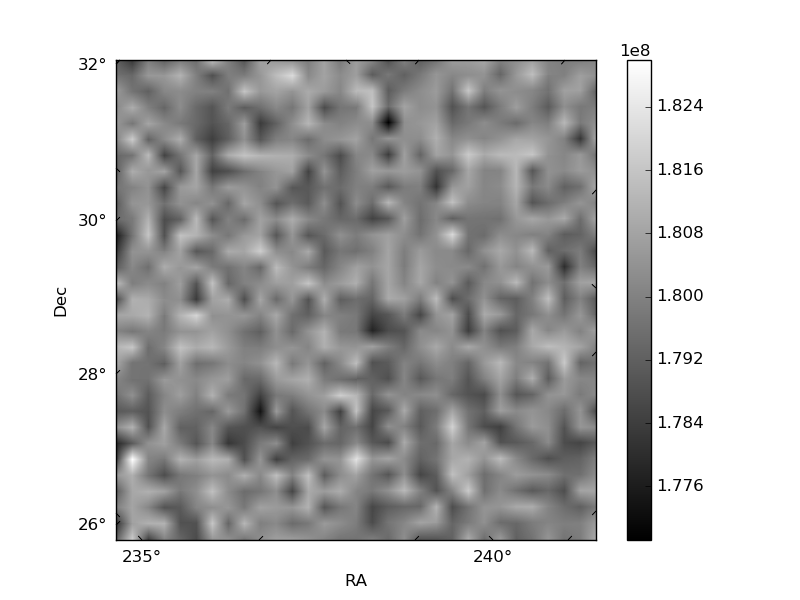
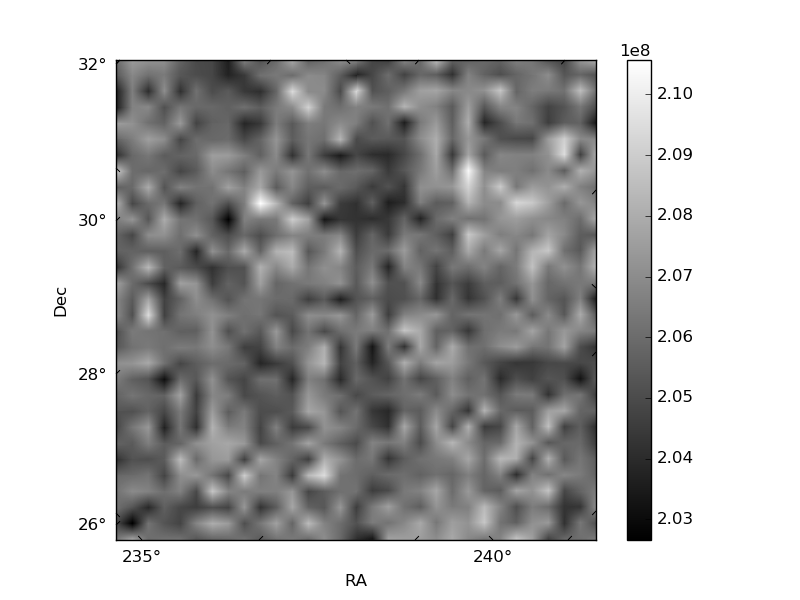
Histogram calculated using DETX and DETY for each event in the final _common_clean file
| Quadrant A | 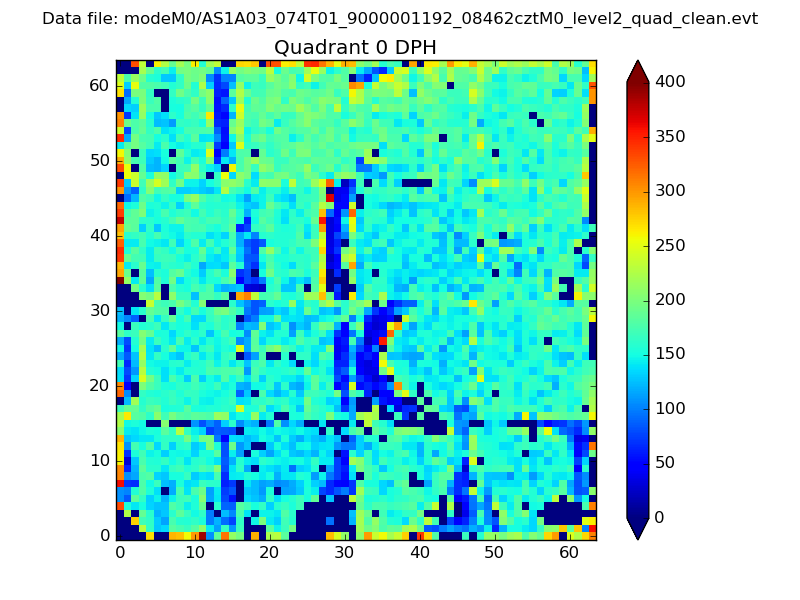 |
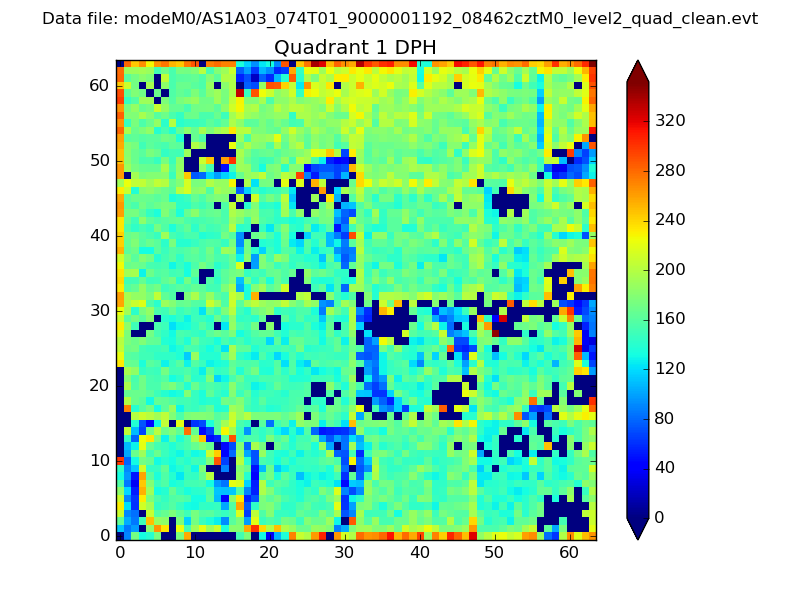 |
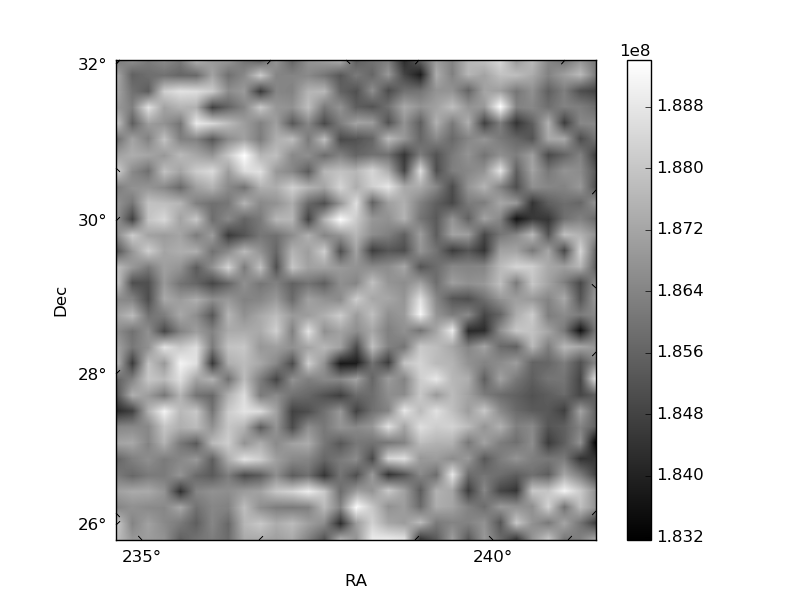
Quadrant B |
|---|---|---|---|
| Quadrant D | 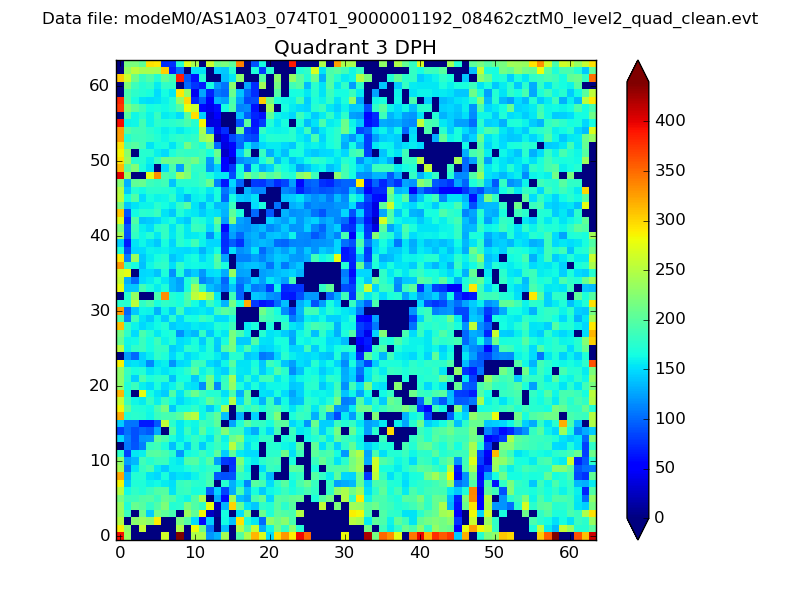 |
 |
Quadrant C |
| Plot type | Count rate plots | Images |
|---|---|---|
| Comparison with Poisson distribution Blue bars denote a histogram of data divided into 1 sec bins. Red curve is a Poisson curve with rate = median count rate of data. |
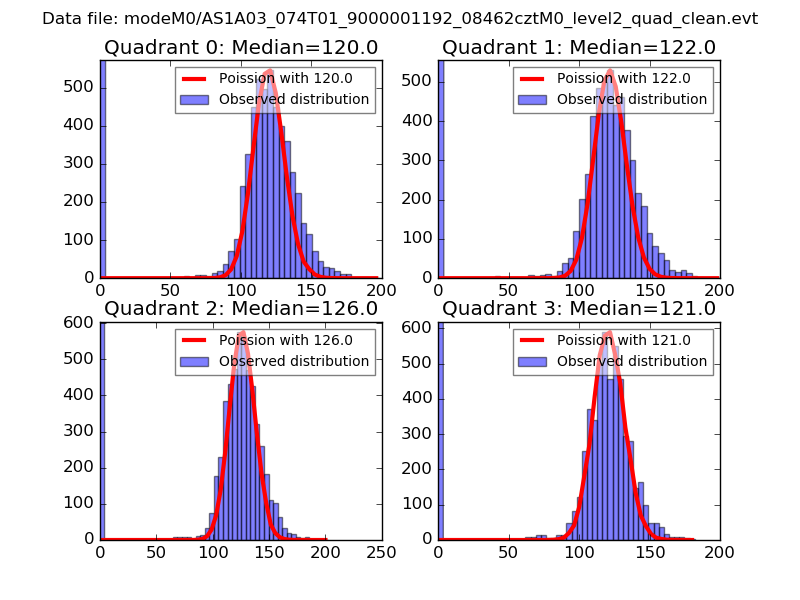 |
 |
| Quadrant-wise count rates Data is divided into 100 sec bins |
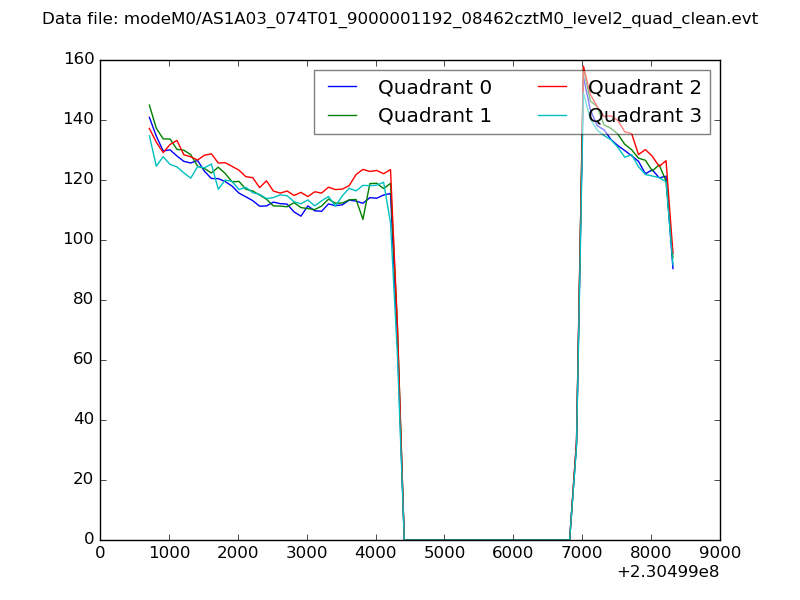 |
|
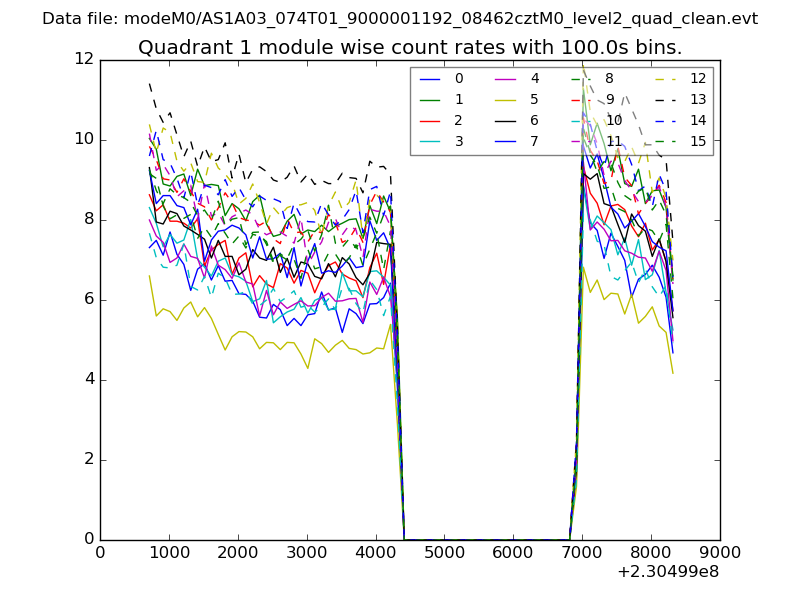
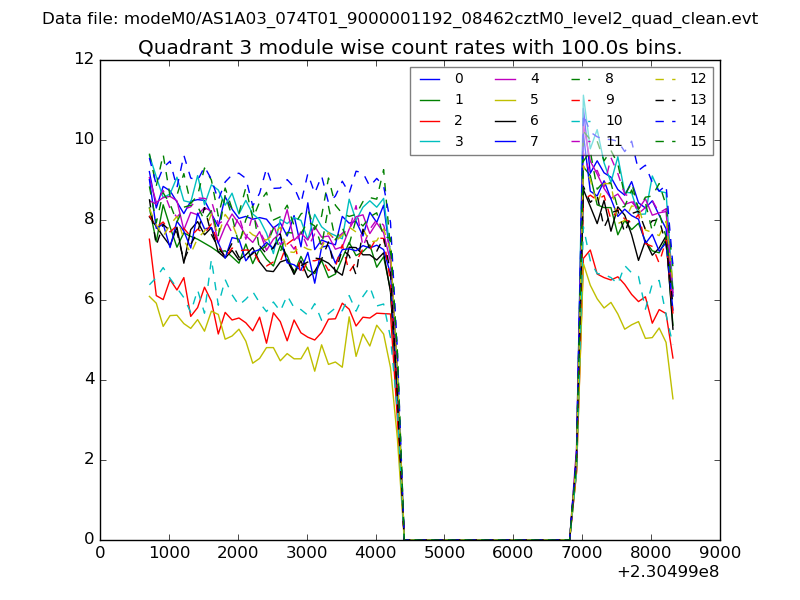
| Module-wise count rates for Quadrant A Data is divided into 100 sec bins |
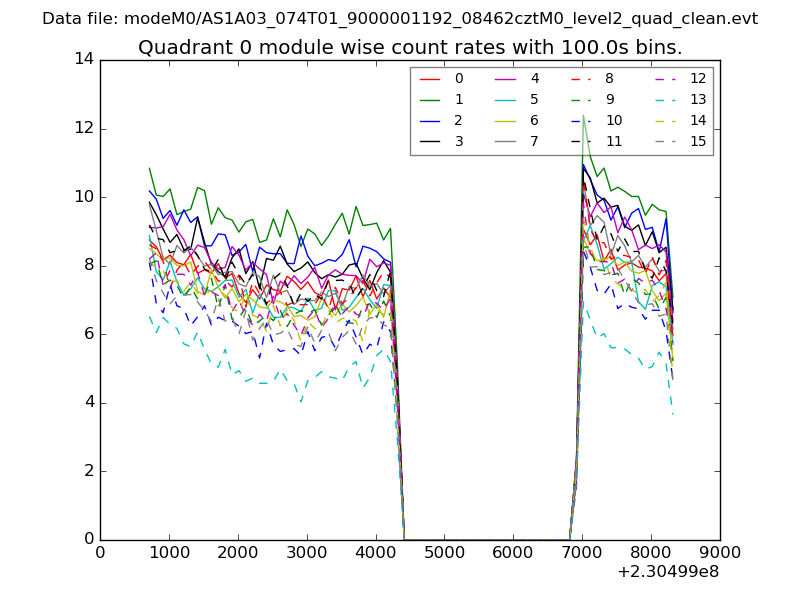 |
 |
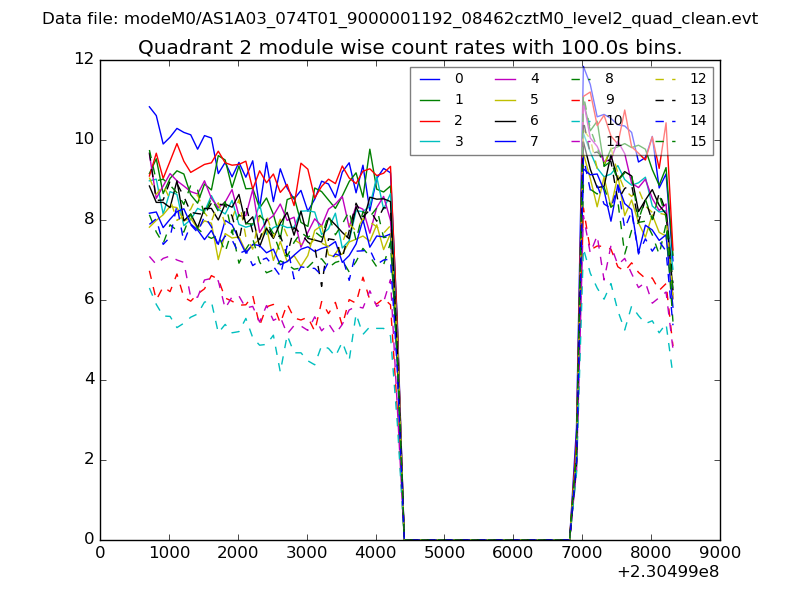
| Module-wise count rates for Quadrant B Data is divided into 100 sec bins |
 |
 |
| Module-wise count rates for Quadrant C Data is divided into 100 sec bins |
 |
 |
| Module-wise count rates for Quadrant D Data is divided into 100 sec bins |
 |
 |
| Parameter | Plot |
|---|---|
| CZT HV Monitor | 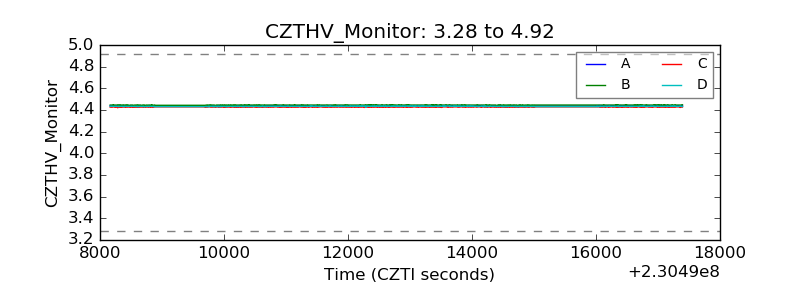 |
| D_VDD | 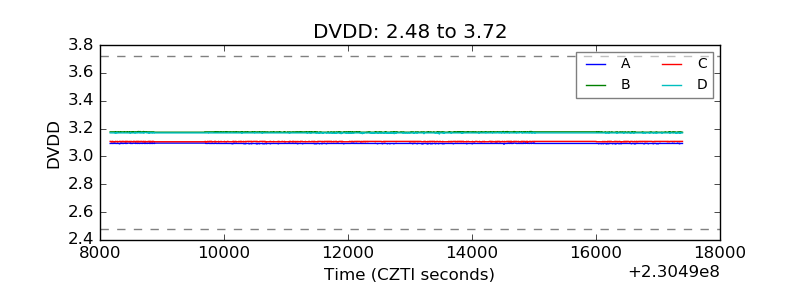 |
| Temperature 1 | 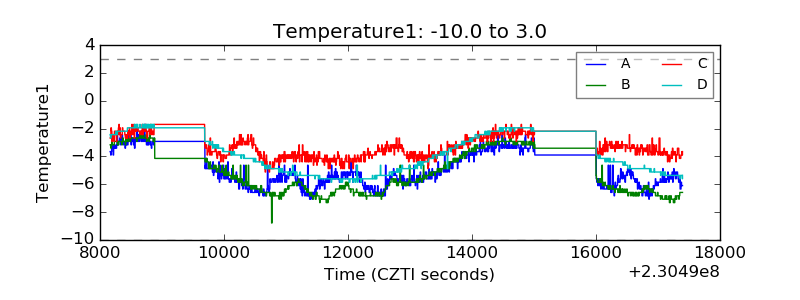 |
| Veto HV Monitor | 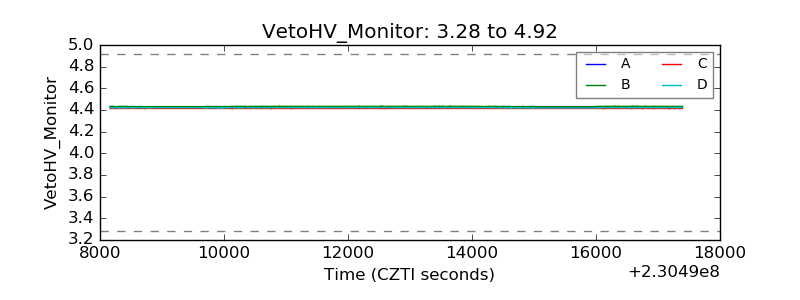 |
| Veto LLD |  |
| Alpha Counter | 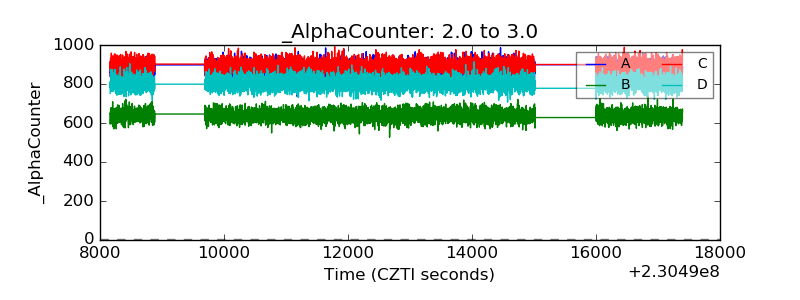 |
| _CPM_Rate | 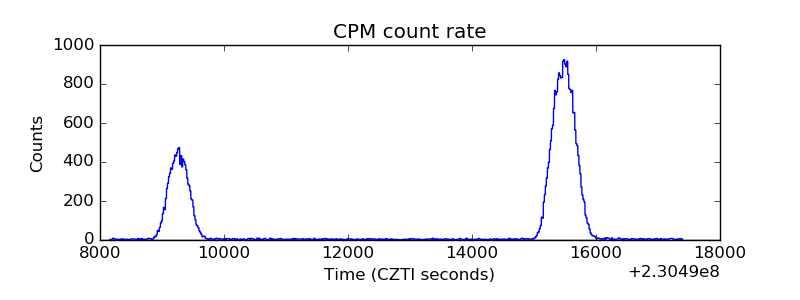 |
| CZT Counter |  |
| +2.5 Volts monitor |  |
| +5 Volts monitor |  |
| _ROLL_ROT | 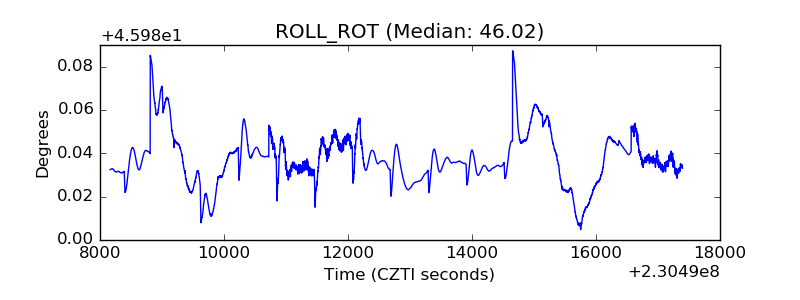 |
| _Roll_DEC | 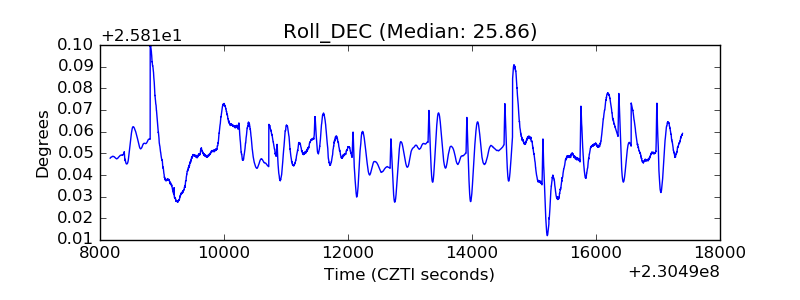 |
| _Roll_RA | 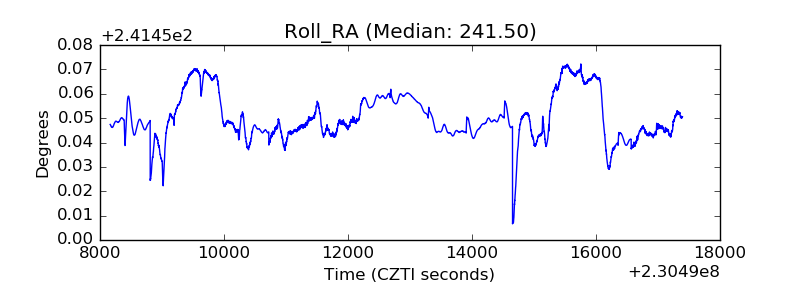 |
| Veto Counter | 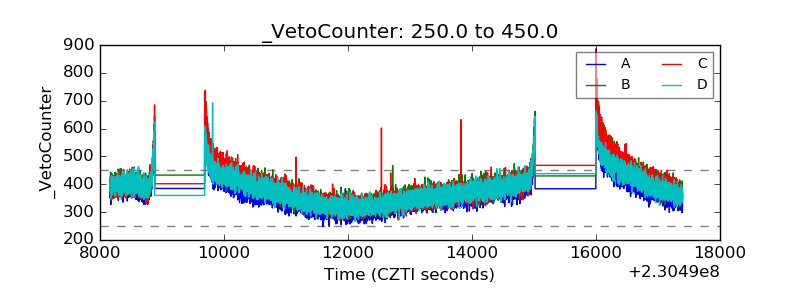 |