| Param | Original file | Final file |
|---|---|---|
| Filename | modeM0/AS1A03_074T01_9000001192_08465cztM0_level2.evt | modeM0/AS1A03_074T01_9000001192_08465cztM0_level2_quad_clean.evt |
| Size (bytes) | 426,985,920 | 87,485,760 |
| Size | 407.2 MB | 83.4 MB |
| Events in quadrant A | 3,041,012 | 542,888 |
| Events in quadrant B | 3,213,614 | 553,088 |
| Events in quadrant C | 3,059,248 | 560,701 |
| Events in quadrant D | 3,173,131 | 536,984 |
| Mode SS | |||
|---|---|---|---|
| Quadrant | BADHDUFLAG | Total packets | Discarded packets |
| A | 0 | 136 | 2 |
| B | 0 | 136 | 0 |
| C | 0 | 136 | 0 |
| D | 0 | 136 | 0 |
| Mode M9 | |||
|---|---|---|---|
| Quadrant | BADHDUFLAG | Total packets | Discarded packets |
| A | 0 | 23 | 0 |
| B | 0 | 23 | 0 |
| C | 0 | 23 | 0 |
| D | 0 | 23 | 0 |
| Mode M0 | |||
|---|---|---|---|
| Quadrant | BADHDUFLAG | Total packets | Discarded packets |
| A | 0 | 13457 | 3 |
| B | 0 | 13902 | 2 |
| C | 0 | 13477 | 2 |
| D | 0 | 14000 | 2 |
| Quadrant | Total seconds | Saturated seconds | Saturation percentage |
|---|---|---|---|
| A | 6533 | 28 | 0.428593% |
| B | 6533 | 51 | 0.780652% |
| C | 6533 | 25 | 0.382673% |
| D | 6533 | 36 | 0.551049% |
Noise dominated data is calculated using 1-second bins in cleaned event files. If a bin has >2000 counts, and if more than 50% of those come from <1% of pixels, then it is considered to be noise-dominated and hence unusable.
| Quadrant | # 1 sec bins | Bins with >0 counts | Bins with >2000 counts | High rate bins dominated by noise | Noise dominated (total time) | Noise dominated (detector-on time) | Marked lightcurve |
|---|---|---|---|---|---|---|---|
| A | 8853 | 6534 | 0 | 0 | 0.00% | 0.00% | 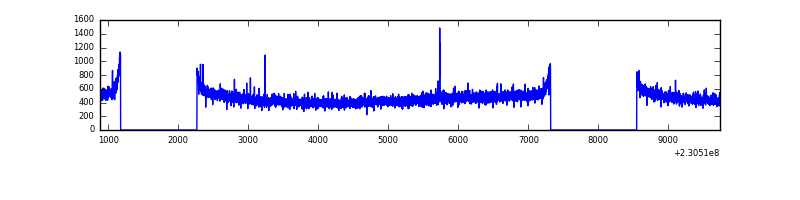 |
| B | 8853 | 6535 | 4 | 4 | 0.05% | 0.06% | 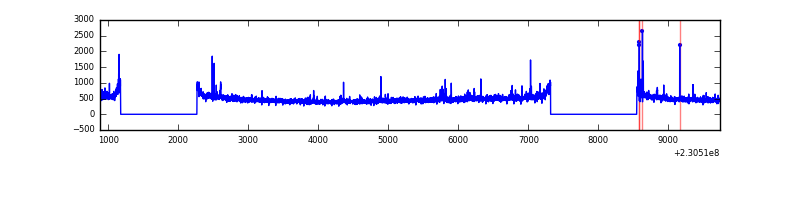 |
| C | 8853 | 6535 | 0 | 0 | 0.00% | 0.00% |  |
| D | 8853 | 6535 | 20 | 20 | 0.23% | 0.31% | 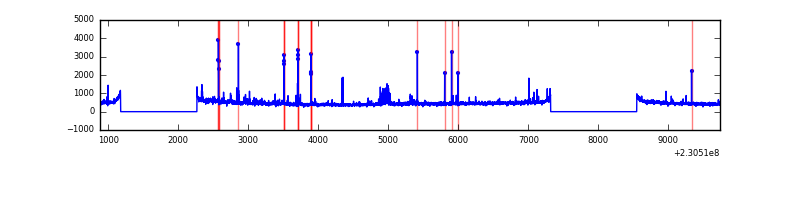 |
Top three noisy pixels from each quadrant. If the there are fewer than three noisy pixels in the level2.evt file, extra rows are filled as -1
| Pixel properties | Quadrant properties | ||||||
|---|---|---|---|---|---|---|---|
| Quadrant | DetID | PixID | Counts | Sigma | Mean | Median | Sigma |
| A | 0 | 226 | 7273 | 40.61 | 789 | 771 | 160.1 |
| A | 12 | 194 | 6914 | 38.37 | 789 | 771 | 160.1 |
| A | 13 | 251 | 4670 | 24.35 | 789 | 771 | 160.1 |
| B | 0 | 214 | 43161 | 281.53 | 796 | 777 | 150.5 |
| B | 11 | 51 | 32963 | 213.79 | 796 | 777 | 150.5 |
| B | 4 | 81 | 25770 | 166.02 | 796 | 777 | 150.5 |
| C | 8 | 128 | 14228 | 74.55 | 777 | 781 | 180.4 |
| C | 8 | 112 | 6237 | 30.25 | 777 | 781 | 180.4 |
| C | 13 | 61 | 5866 | 28.19 | 777 | 781 | 180.4 |
| D | 2 | 152 | 80800 | 439.75 | 766 | 749 | 182.0 |
| D | 2 | 14 | 71869 | 390.69 | 766 | 749 | 182.0 |
| D | 13 | 105 | 63772 | 346.21 | 766 | 749 | 182.0 |
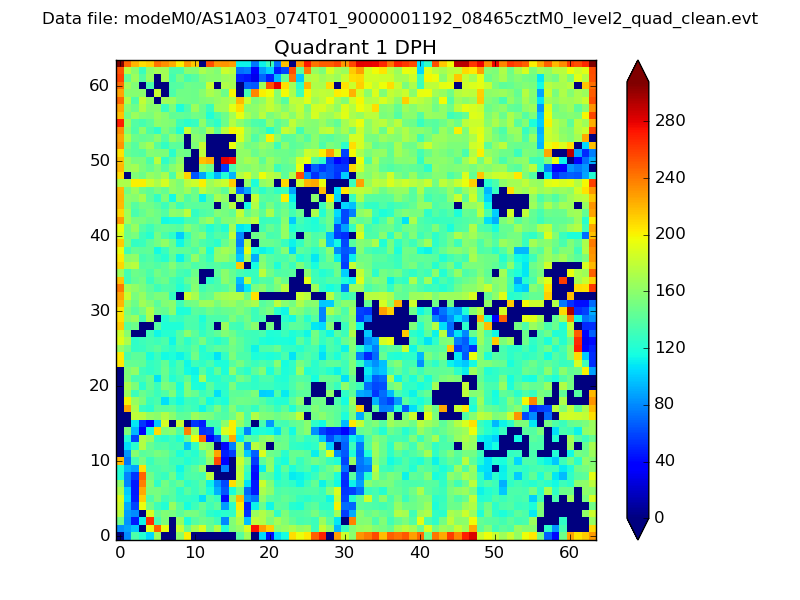
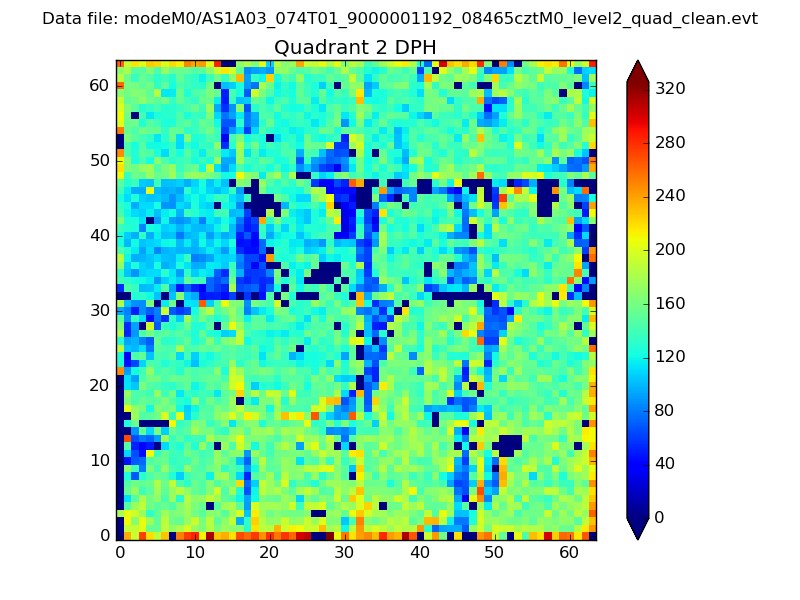
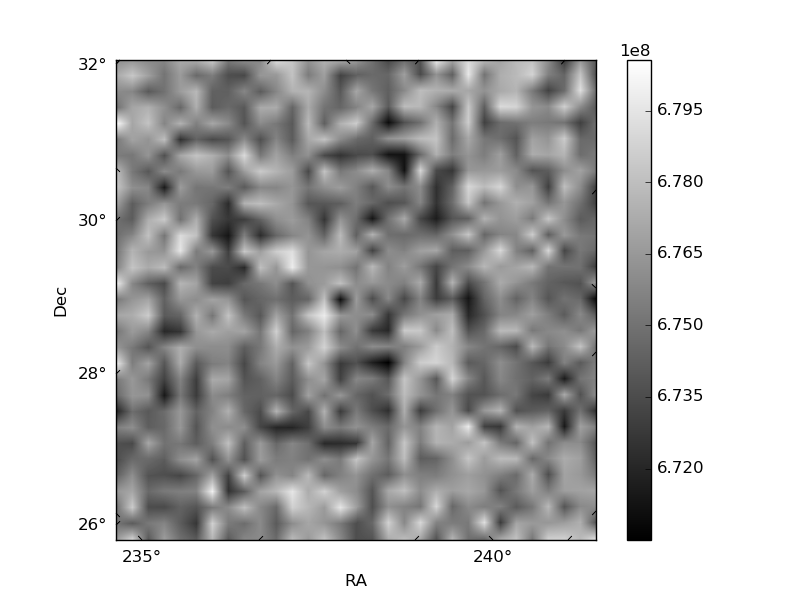
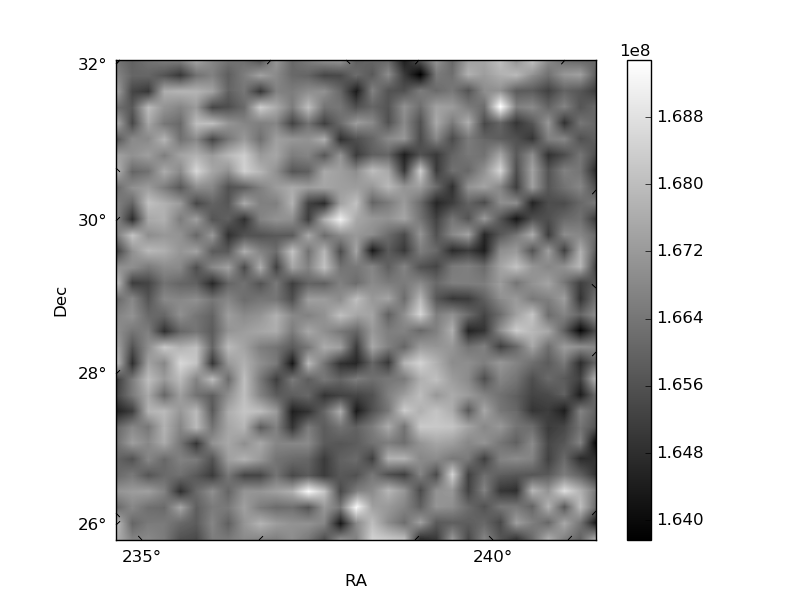
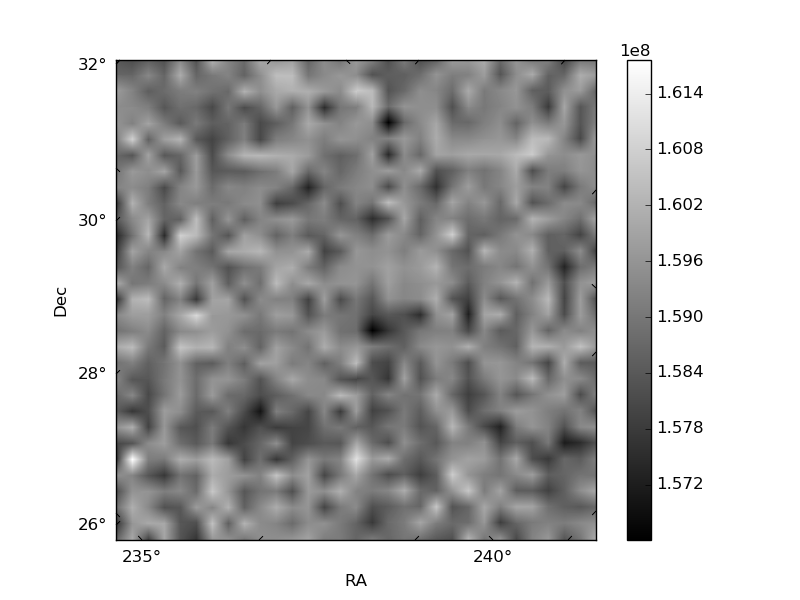
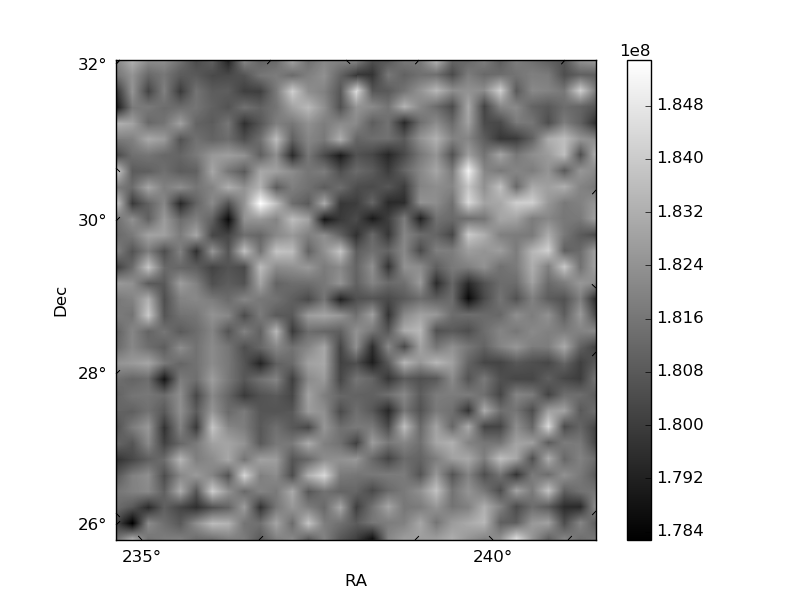
Histogram calculated using DETX and DETY for each event in the final _common_clean file
| Quadrant A | 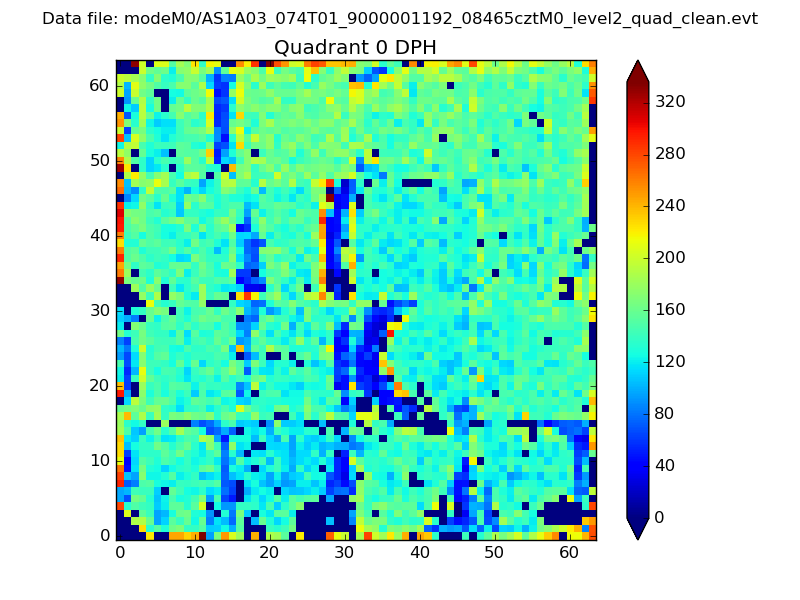 |
 |
Quadrant B |
|---|---|---|---|
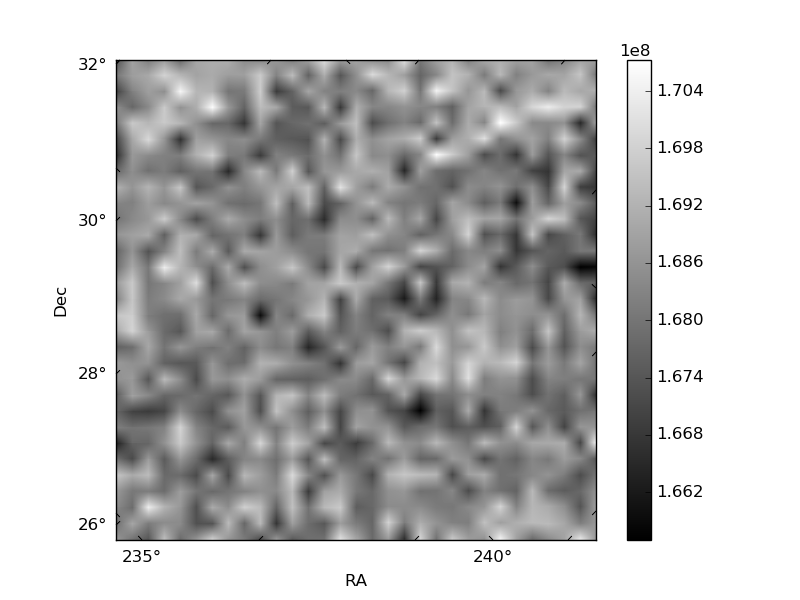
| Quadrant D | 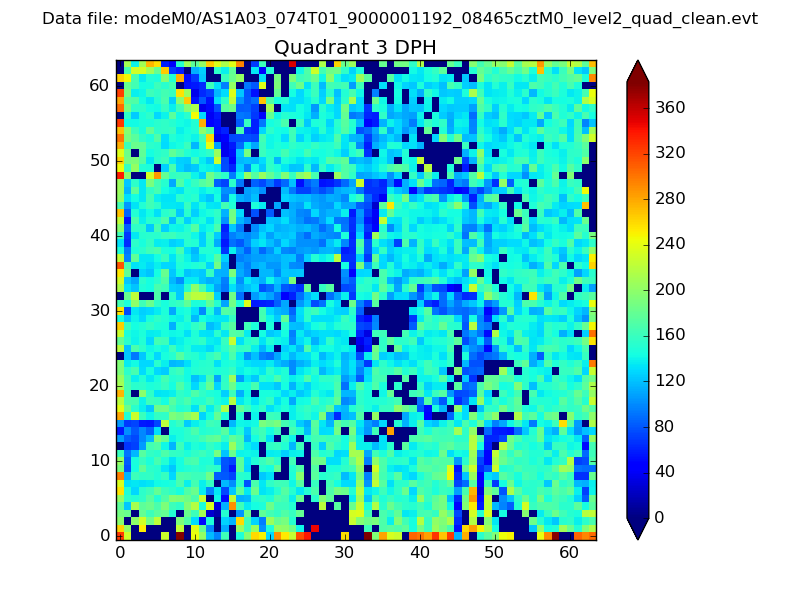 |
 |
Quadrant C |
| Plot type | Count rate plots | Images |
|---|---|---|
| Comparison with Poisson distribution Blue bars denote a histogram of data divided into 1 sec bins. Red curve is a Poisson curve with rate = median count rate of data. |
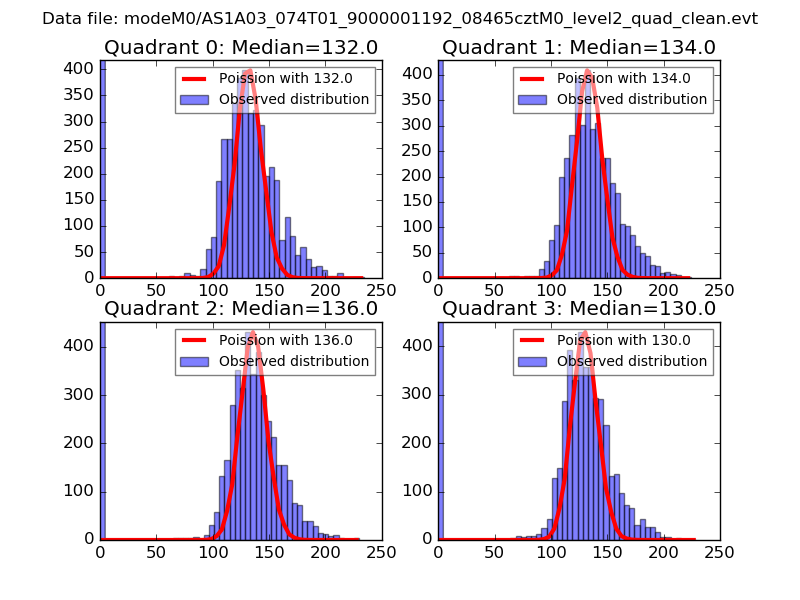 |
 |
| Quadrant-wise count rates Data is divided into 100 sec bins |
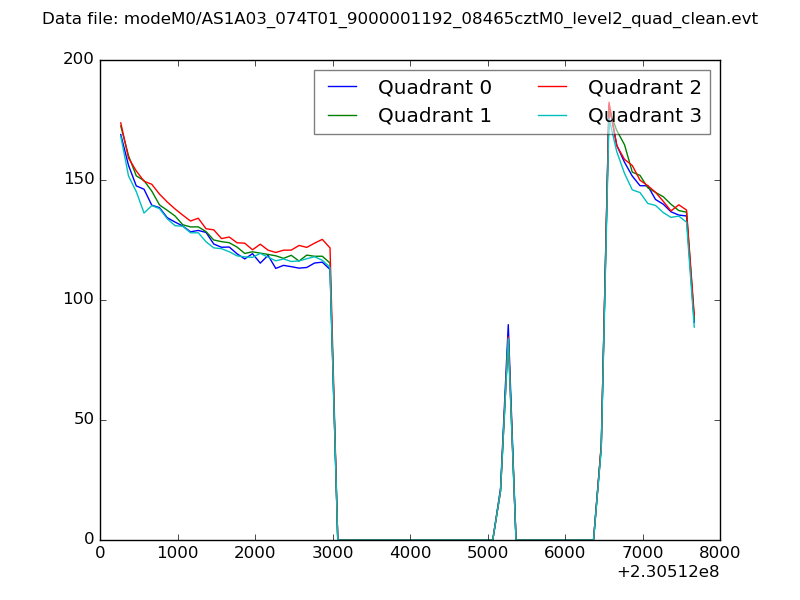 |
|
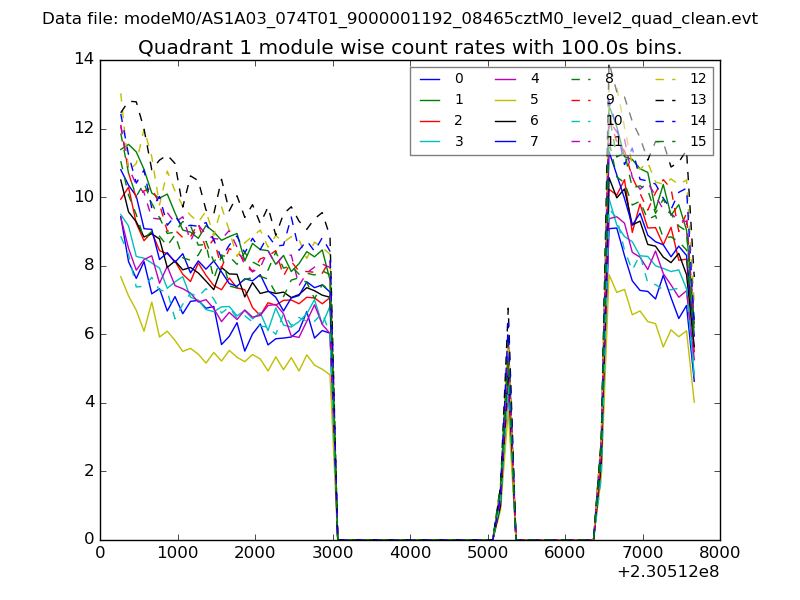
| Module-wise count rates for Quadrant A Data is divided into 100 sec bins |
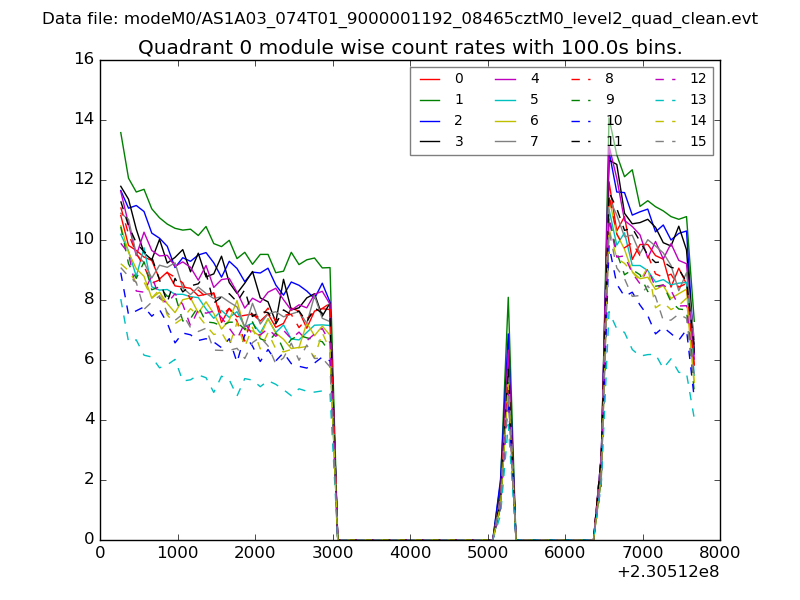 |
 |
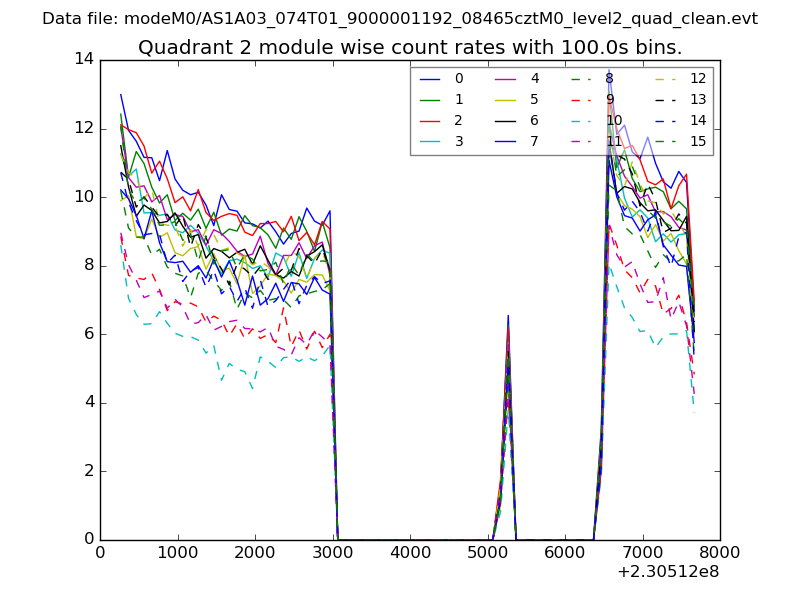
| Module-wise count rates for Quadrant B Data is divided into 100 sec bins |
 |
 |
| Module-wise count rates for Quadrant C Data is divided into 100 sec bins |
 |
 |
| Module-wise count rates for Quadrant D Data is divided into 100 sec bins |
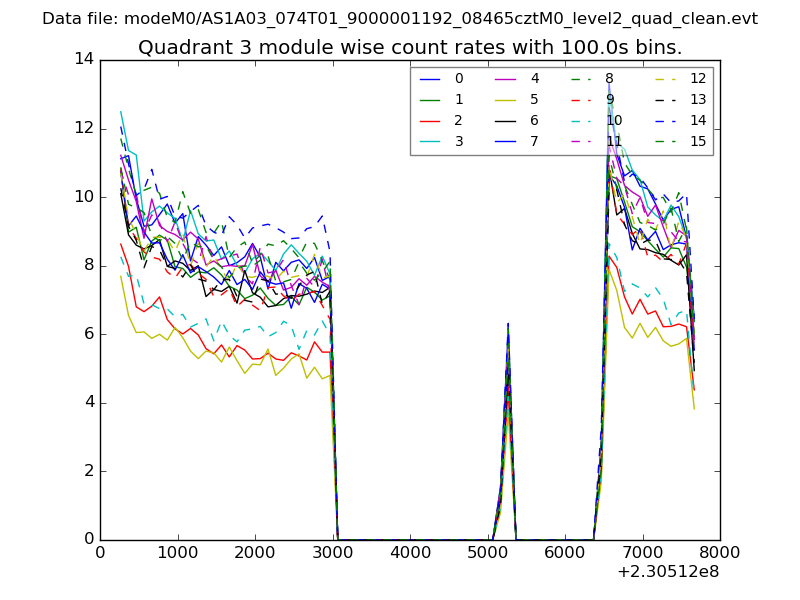 |
 |
| Parameter | Plot |
|---|---|
| CZT HV Monitor | 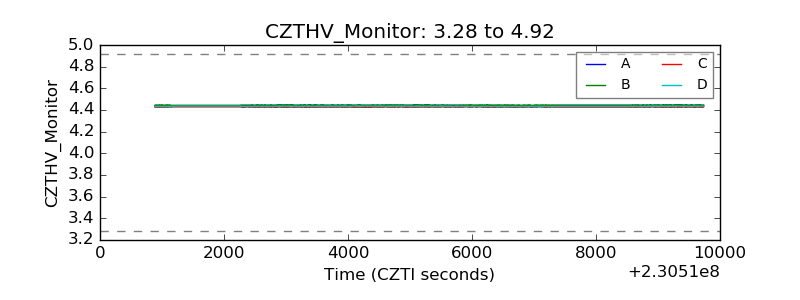 |
| D_VDD | 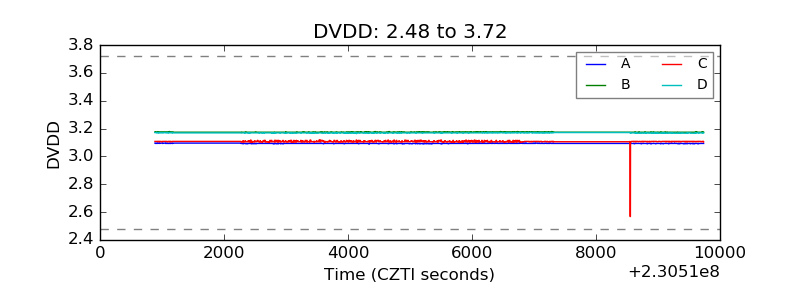 |
| Temperature 1 | 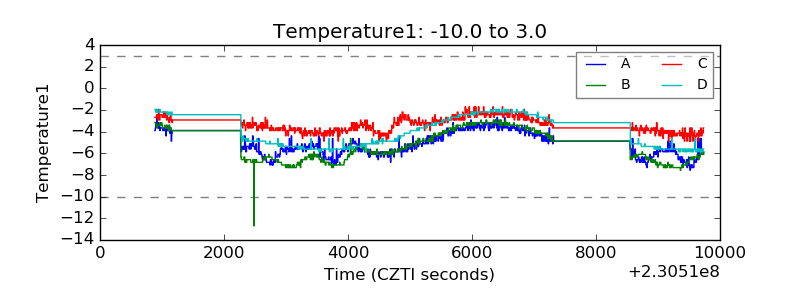 |
| Veto HV Monitor | 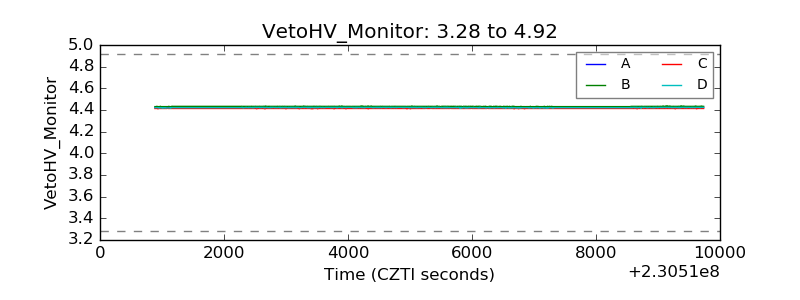 |
| Veto LLD | 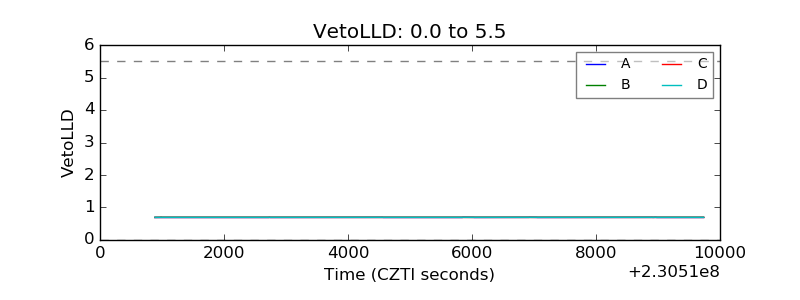 |
| Alpha Counter | 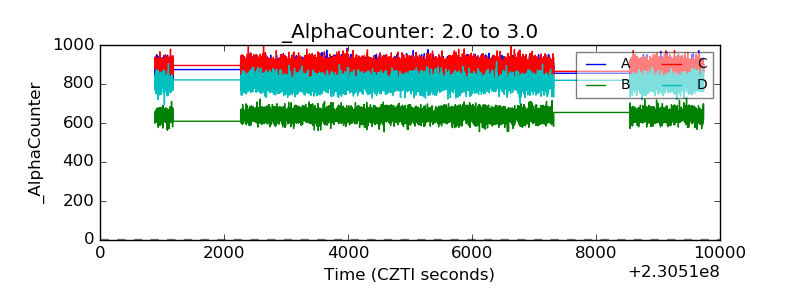 |
| _CPM_Rate | 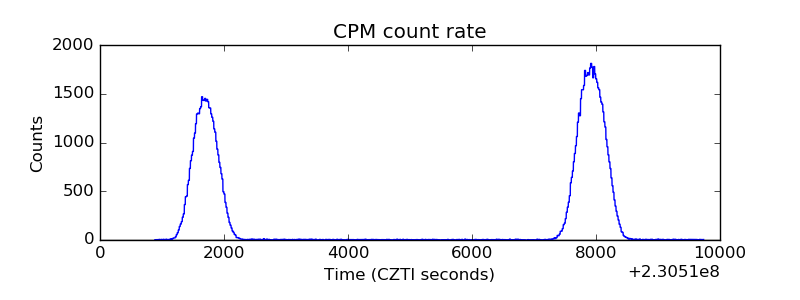 |
| CZT Counter | 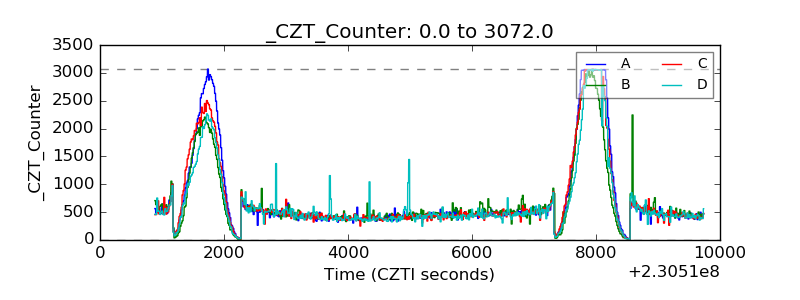 |
| +2.5 Volts monitor |  |
| +5 Volts monitor |  |
| _ROLL_ROT | 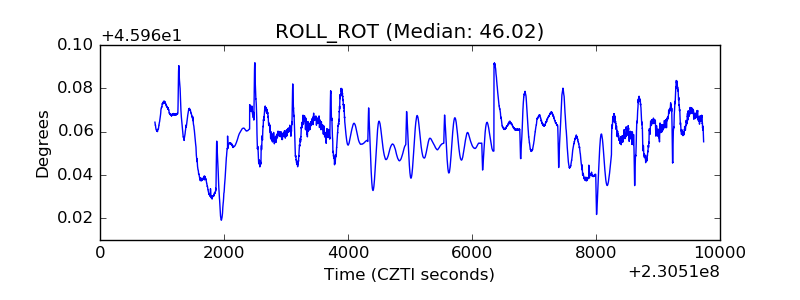 |
| _Roll_DEC | 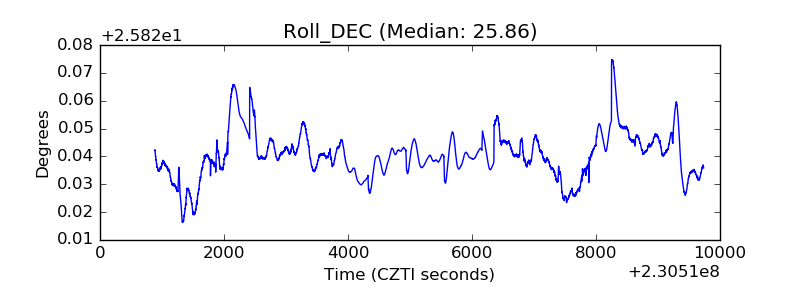 |
| _Roll_RA | 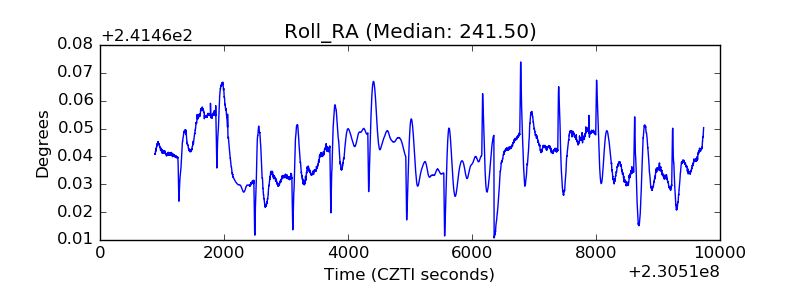 |
| Veto Counter | 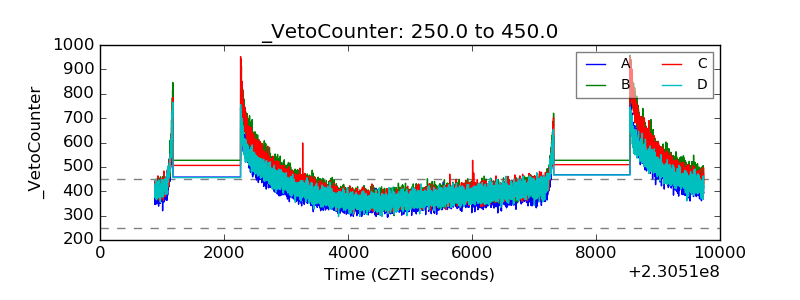 |